 Nitrogen fertilization, fungicide application, and genetic resistance for the management of diseases on wheat
ABSTRACT.
Nitrogen (N) fertilization is a common practice to increase grain yield worldwide. This study aimed to determine the effects of three N rates (70, 130, and 200 kg ha−1, referred to as low, recommended, and high, respectively) and a pre-mix fungicide (bixafen + prothioconazole + trifloxystrobin) on the disease intensity and grain yield of 2 early-maturing wheat cultivars named as TBIO Audaz and TBIO Tibagi. Two field experiments were conducted during the 2019 and 2020 growing seasons using the split-split plot design. Tan spot, powdery mildew, leaf rust, and Fusarium head blight (FHB) were the primary diseases observed. The recommended and high N rates reduced the area under the disease progress curve (AUDPC) for tan spot. However, the AUDPC for powdery mildew increased with high N for both cultivars, but N rates did not affect leaf rust or FHB. The use of early maturing wheat cultivars did not prevent the occurrence of FHB damage, except on plants from cultivar TBIO Audaz known to be moderately resistant. When combined with N fertilization, fungicide application reduced the AUDPC for tan spot, powdery mildew, leaf rust, and FHB by 31, 33, 75, and 40%, respectively, compared to the non-treated control. The cultivar × fungicide and cultivar × N interactions were significant (p < 0.05) for AUDPCs and yield variables. Both the recommended and high N rates similarly increased the yield, health area duration, and tan spot control at the same level compared to the low N rate. These findings combined with economic and cost-efficiency analyses suggest that using a moderately resistant cultivar with recommended N rates help to maintain adequate N use efficiency and economic returns to growers.
Keywords:
nutrition; disease control; nitrogen use efficiency; fungicide mixture; sustainable disease management
Introduction1
Wheat (Triticum aestivum L.) is one of the most important crops and is the most consumed cereal worldwide. However, several diseases and pests are estimated to reduce yields by 21.5% globally, threatening food security (Savary et al., 2019). In Brazil, the southern region is the most important for wheat production, with the state of Rio Grande do Sul being the second largest producer, accounting for 36% of total Brazilian production (Companhia Nacional de Abastecimento [CONAB], 2021a). However, the weather conditions in southern Brazil are often highly favorable for certain diseases that affect wheat (Del Ponte et al., 2009). The main leaf diseases include tan spot (Pyrenophora tritici-repentis (Died.) Drechs.), powdery mildew (Blumeria graminis (DC.) f. sp. tritici), yellow (stripe) rust (Puccinia striiformis West.), and leaf rust (P. triticina Eriks. (=P. recondita Rob. Ex Desm. f. sp. tritici Eriks & Henn.). Additionally, Fusarium head blight (FHB), caused by the Fusarium graminearum species complex, affects wheat from anthesis to the late stages of grain development (Del Ponte et al., 2007), while wheat blast (Magnaporthe oryzae Triticum pathotype) primarily infects wheat spikes (Cruz et al., 2015; Debona et al., 2012), although it is less common in Rio Grande do Sul State, Brazil.
The prevalence of pathogens causing leaf spots varies with weather conditions, such as rainfall and daily temperature ranges, as well as the disease resistance levels of wheat genotypes (Fernandez et al., 2016). The use of resistant genotypes is the most important and economic method for reducing yield losses due to the occurrence of disease (Faris et al., 2012). Additionally, the use of early maturing cultivars helps to avoid spike diseases that occur at maturity and enables the cultivation of more than one crop per season (Gilbert & Haber, 2013). In Brazil, only cultivars with moderate resistance are available to manage tan spot, FHB, and wheat blast, but resistant cultivars are available to manage powdery mildew and rusts (Bertagnolli et al., 2019; Dorneles et al., 2018; Pazdiora et al., 2018; Reunião da Comissão Brasileira de Pesquisa de Trigo e Triticale, 2018). Fungicide applications are often used to mitigate yield losses caused by the different wheat diseases (Fleitas et al., 2018; MacLean et al., 2018; Reunião da Comissão Brasileira de Pesquisa de Trigo e Triticale, 2018). Similarly, reducing disease epidemics depends on both effectiveness of fungicides and the resistance levels of the cultivar (Ruske et al., 2003).
In general, cultivating susceptible cultivars under weather conditions optimal for infection of pathogen increases the risk of disease outbreak and the need of using fungicides sprays. For wheat, strategies to protect the flag leaves and delay their senescence are crucial for ensuring a high grain yield considering that flag leaf is the primary contributor to grain development and filling (Blandino & Reyneri, 2009). However, under conditions favorable to disease (e.g., monoculture, no-till practices and use of susceptible cultivars), tan spot may occur before tillering, requiring earlier fungicide application to delay production of secondary inoculum, which can infect the flag leaves. On the other hand, diseases, such as FHB and blast, which mainly affect wheat spikes, pose challenges for fungicide application. For instance, the efficacy of chemical control against FHB has been reported to be as low as 50-60%, often proving unsatisfactory disease control (Barro et al., 2021; Machado et al., 2017). This is mainly due to the difficulty of delivering an adequate amount of fungicide to the biological target, due to a prolonged flowering period and low product persistence on the surface of the flower organ (Reis et al., 1996).
Wheat fertilization is a strategy to reduce disease development, enhance fungicide efficiency, or decrease its demand (Pazdiora et al., 2021). For example, nitrogen (N) fertilization has been shown to reduce tan spot severity and increase the green leaf area in wheat plants (Castro et al., 2018; Fleitas et al., 2018; Schierenbeck et al., 2019a; Simón et al., 2020). Moreover, the combination use of a pre-mix of fungicides from different chemical groups (triazoles, strobilurins, and carboxamides) along with higher N rates has been found to reduce disease progress and increase grain yield (Castro et al., 2018; Fleitas et al., 2018; Schierenbeck et al., 2019b; Simón et al., 2020). However, the effect of N fertilization varies depending on the host-pathogen interaction, N rates and its sources used, and wheat cultivars, resulting, therefore, in different yields (Mur et al., 2017; Román Ramos et al., 2024).
Fertilizers containing N are widely used globally to increase cereal yield. However, field studies examining the effect of N fertilization’s effect on the N use efficiency (NUE) as well as the impact of other disease management strategies, including the use of fungicide pre-mixes or early maturing wheat cultivars with contrasting resistance, remain scarce. Therefore, the objective of this study was to investigate the effects of altering the N fertilization rate, compared to the recommended dose, in combination with two applications of a pre-mix fungicide (carboxamide + triazolinthione + strobilurin) on the disease intensity and grain yield of two early maturing wheat cultivars with contrasting levels of disease susceptibility against diseases.
Material and methods
Field trials
Experiments were conducted in the field at the Centro Agropecuário da Palma (31°48'06.4" S 52°30'18.6" W) belonging to the Universidade Federal de Pelotas, Pelotas, Rio Grande do Sul State, Brazil, during 2 consecutive growing seasons (2019 and 2020). Plots were established in an area previously sown in a wheat-soybean succession system in 2018, allowing for the natural occurrence of diseases. Wheat seeds for the trial plots were sown on July 11, 2019, and July 14, 2020, under a no-till system. Wheat seeds were sown in 9 rows, with 0.17-m spacing between rows, using a plot seeder (Semeato, SHP model) at a seeding rate of 300 seeds m−2, aiming to achieve a plant density of approximately 275 plants m−2. The soil was classified as Argissoil (Ultisol), with 658 g kg−1 of sand, 241 g kg−1 of clay, and 101 g kg−1 of silt. The chemical characteristics of the soil were as follows: 1.0 and 1.79% organic matter; 0.73 and 0.93 g kg−1 N; 3.23 and 4.11 g kg−1 NO3; 0.94 and 1.19 g kg−1 NH4; 20 and 14 ppm phosphorus; 99 and 115 mg dm−3 potassium; 1.7 and 1.8 cmolc dm-3 calcium; 1.2 and 1.3 cmolc dm-3 magnesium; 1 and 0.9 mg dm−3 copper; 1.1 and 0.8 mg dm−3 zinc; 12.7 and 21 mg dm-3 manganese; and pHH2O 5.7 and 6, in 2019 and 2020 growing seasons, respectively.
Weather data, including daily rainfall, relative humidity, and minimum, maximum, and mean temperatures, were recorded at the Pelotas weather station, located latitude 31°52'00" S and longitude 52°21'24" W at an altitude of 13.24 m.
Experimental design and treatments
The experimental design followed a split-split plot arrangement with four replications. The main plots consisted of plants that were either sprayed with fungicide or left non−sprayed. Sub-plots were wheat cultivars (TBIO Audaz and TBIO Tibagi), while the sub-sub-plots represented the different N rates (lower N rate: 70 kg ha−1, recommended N rate: 130 kg ha−1, and higher N rate: 200 kg ha−1). Each sub-sub-plot had an area of 3 m2 (2 m long × 1.5 m wide). Cultivars TBIO Audaz (Biotrigo®) and TBIO Tibagi (Biotrigo®) were chosen based on their regional adaptability, similar anthesis, and maturity times but had contrasting levels of disease resistance. The cultivar TBIO Audaz is considered more resistant to tan spot, powdery mildew, leaf rust, and FHB than cultivar TBIO Tibagi.
A fertilizer was applied at sowing according to the soil test recommendations, ensuring optimal crop yield. The fertilizer consisted of 40 kg ha−1 phosphorus supplied as triple superphosphate and 30 kg ha−1 potassium supplied as potassium chloride. The N (granular urea, 45% N) was applied 15 days after sowing and again at the tillering stage (ZGS23), with 50% of the rate for each treatment applied at each time point.
A pre-mix fungicide containing bixafen (125 g L−1; carboxamide), prothioconazole (175 g L−1; triazolinthione), and trifloxystrobin (150 g L−1; strobirulin) (Fox Xpro®; Bayer CropScience) was applied at a rate of 0.5 L ha−1 at both the flag leaf stage (ZGS 39) and flowering stage (ZGS65) (Zadoks et al., 1974). The fungicide was applied using a CO2 pressure sprayer with four nozzles (TTJ60 11002; Teejet®) and delivering 200 L ha−1.
Experimental measurements
Disease assessments
The main diseases recorded during the two growing seasons were tan spot, powdery mildew, leaf rust, and FHB. The disease incidence was determined by assessing a 1-m section along the centerline of each experimental plot, counting both the total number of plants and those plants showing symptoms of each disease. Disease severity was estimated using the midpoint of the Horsfall-Barratt scale (Horsfall & Barratt 1945) and expressed as a percentage of the leaf area showing disease symptoms. This estimation was based on observations on the third and fourth leaves as well as on the flag leaf of 10 plants per plot from the stem elongation stage (ZGS30) to the hard dough stage (ZGS87). The leaf rust severity was specifically assessed on the flag leaf, using Cobb’s scale as modified by Peterson et al. (1948), from the flowering stage (ZGS65) to the hard dough stage (ZGS87). For FHB severity, 20 randomly selected spikes were assessed from each plot during the same stages. The FHB severity, expressed as the proportion of bleached spikes, was determined as the average disease severity (%) of 20 spikes per plot using the scale described by Stack and McMullen (2011). For each disease, the area under the disease progress curve (AUDPC) was calculated to summarize the disease progress over time, according to Shaner and Finney (1977).
Healthy area duration (HAD)
The leaf area of the fourth and flag leaves was estimated at ZGS39, ZGS60, and ZGS80 growth stagesand calculated by multiplying the length × width × 0.835 (Miralles & Slafer, 1990). In each experimental plot, the number of plants per square meter was counted to calculate the leaf area index (LAI). This was done by multiplying the total leaf area per shoot by the number of plants per square meter, then dividing by the area used for plants per square meter. The LAI was used to estimate the HAD using the following equation:
where n is the number of evaluations, Xi is severity proportion, LAI is the leaf area per m2, and (ti+1 − ti) is the interval between two consecutive assessments (Waggoner & Berger 1987).
Determination of foliar N concentration
Leaf samples were collected at the ZGS60 growth stage from the central rows of all plots. The samples were dried at 60°C for 72h and then ground using an R-TE-350 mill. A subsample of 1 g was used to determine the plant N level (PNL, g kg−1) using the micro-Kjeldahl method (Bremner & Mulvaney, 1982). Grain samples were also ground using a mill (R-TE-350, Tecnal) to determine the total N per grain (TNG; g kg−1), also following the micro-Kjeldahl method (Bremner & Mulvaney, 1982).
Yield determinations
Wheat was harvested from 5 central rows, each 1 m in length (totaling 1 m2), from each plot. The harvested samples were threshed using a mechanical grain thresher (EDA, model TR, Parcela). The samples were air dried for approximately 48h and then cleaned. The grain moisture content of a representative subsample was measured with a moisture tester (AgraTronix, MT-PRO). The grain yield (kg ha−1) was estimated after harvesting the useful area of each plot and adjusted to a 13% moisture content. The 1000-kernel weight (TKW; g) was measured by counting 250 grains in quadruplicate from each plot sample, which were then weighed on an analytical balance accurate to 0.001 g (Shimadzu model BL 3200H). The test weight (TW; kg hL−1) was determined using a Dallemolle type 40 hectoliter balance in accordance with the Method 55-10.01 (American Association of Cereal Chemists, 2010).
Economic analysis
The economic analysis of the treatments was conducted using the dominance analysis technique outlined by Perrin et al. (1979). Production costs were based on CONAB (2021b) and included both fixed and variable costs. Fixed costs encompassed transportation, pre-harvest and harvest machinery, labor, land, technical assistance, and sprays. Variable costs included seeds, fungicides, fertilizers, and other agrochemicals. These variable costs were adjusted according to treatment-specific prices obtained from local sellers. Additional variable production cost revenues were calculated using data from the AGROLINK database for three wheat-producing states (Rio Grande do Sul, Paraná, and Santa Catarina States) from November 2019 to 2020 (AGROLINK, 2021a). Variable costs and wheat prices were converted into USD based on the November 2020 exchange rate (BRL 5.33 = USD 1), which was obtained from http://es.investing.com. The wheat price was considered to be USD 14.47 per 60 kg (AGROLINK, 2021b).
A partial budget was estimated for each treatment based on yield, adjusted yield efficiency (90%), total variable costs, gross income, and net profit (Table S1, see the Supplementary material through the link in the topic data availability).
For dominance analysis, treatments were ranked according to their total variable costs, from lowest to highest. Non-dominated treatments provided a greater net benefit compared to the immediately preceding treatment. The non-dominated treatments were compared and the marginal costs were calculated as the difference between the highest variable cost and the variable cost of the previous treatment. Additionally, the marginal net benefit was calculated as the difference between the net benefit of the current treatment and that of the preceding one. Finally, the marginal return was calculated as the ratio of the marginal net benefit to the marginal variable cost, expressed as a percentage. The treatment with the highest marginal return percentage was considered the most economically viable (Table S2−Supplementary Material).
Calculation of nitrogen use efficiency (NUE)
The NUE was calculated according to Meena et al. (2016) using the following equation:
Nitrogen use efficiency (NUE) =(YieldF (kg)-YieldC (kg)) / (Quantity of nutrietapplied (kg))
where F and C represents plants receiving and not receiving fertilizer, respectively. The NUE for each treatment was used to calculate the cost-efficiency index (Table S3−Supplementary Material).
Cost-efficiency index
It was determined as the ratio between the NUE and the variable costs of each treatment (Sermeño et al., 2001). For this calculation, the treatments were ranked in descending order of the NUE. Based on the variable costs, the lower-cost treatments were classified as non-dominated. The treatment with the lowest rate was considered the most efficient.
Data analyses
Data analyses were performed with mixed effects linear models using the ‘lmer’ function of the lme4 and lmerTest packages in R version 4.0.4. (RStudio, 2021). Data from each year were analyzed separately. Fungicide, cultivar, and N treatment were considered fixed factors, while blocks, the nesting of plots within blocks, and subplots within plots were considered random factors. Assumptions were verified graphically by plotting fitted values versus residuals to assess the homogeneity of variances, and normal Q-Q plots were used to check the normality of the residuals. The residuals were also examined using the ‘simulateResiduals’ function of the DHARMa package. Fixed treatment effects were considered significant at p < 0.05. Estimated marginal means were calculated using the ‘emmeans’ function of the emmeans package, and pairwise comparisons were conducted with the Tukey test using the ‘cld’ function of the multcomp package. Economic analysis was performed using Excel 2013 Microsoft®.
Results
Weather conditions during the growing season and disease development
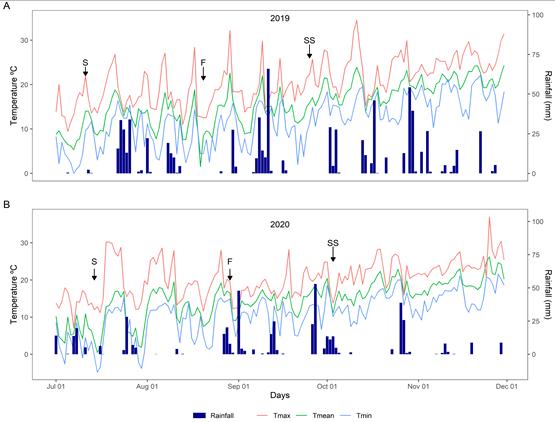
Weather conditions varied between the years in terms of temperature, rainfall frequency, and amount. In 2019, higher temperatures were recorded in late July and early August compared to the same period in 2020 (Figure 1A and B). Consequently, diseases appeared earlier in 2019 growing season than in 2020 growing season. The primary difference between these growing seasons was the rainfall amount and distribution. In 2019 growing season, rainfall was frequent, with October being the wettest month. Tan spot was the main leaf spot observed during tillering, with greater intensity after the flag leaf stage in 2019 growing season. However, in 2020 growing season, tan spot was only observed just before the flag leaf stage and with lower intensity. In 2020, rainfall was 35% lower than in 2019 growing season, with August being particularly dry, although precipitation increased in September. As a result, tan spot development was only observed after the flag leaf stage and during flowering (ZGS60). Powdery mildew appeared simultaneously with tan spot and showed greater intensity during tillering in 2019 growing season compared to 2020 growing season. Leaf rust was observed during flowering in 2019 growing season, while it began at the flag leaf stage (ZGS39) in 2020, likely due to a slight decrease in temperature in 2020 compared to 2019 growing season. This effect was most pronounced in the susceptible cultivar (TBIO Tibagi). The FHB occurred in both growing seasons, but in 2020 growing season, high amounts of rainfall during anthesis increased the disease severity in the plants from the susceptible cultivar.

Climatic conditions of Capão de Leão municipality, Rio Grande do Sul State, Brazil. Rainfall (mm) and mean (Tmean), maximum (Tmax), and minimum (Tmin) temperatures during the wheat plant growing stages of wheat in the two growing seasons (2019 (A) and 2020 (B)). S = date of sowing; FF = date of the first fungicide spray on the flag leaf (ZGS39); SF = date of the second fungicide spray at flowering (ZGS65).
Effect of cultivar, fungicide, and N rate on the area under the disease progress curve
The diseases recorded in this study included tan spot, powdery mildew, leaf rust, and FHB. The cultivar factor was significant (p < 0.05) for all AUDPCs, regardless of crop season. Fungicide application was significant (p < 0.05) for the AUDPC of tan spot in 2019 growing season and all AUDPCs in 2020 growing season, except powdery mildew. The N level was significant (p < 0.05) for tan spot and powdery mildew AUDPCs (Table 1). Some interactions among factors were also significant, particularly in the 2020 growing season.
The cultivar TBIO Audaz showed lower AUDPCs for tan spot, powdery mildew, leaf rust, and FHB by 56, 52, 83, and 47%, respectively, in 2019 and 34, 38, 73, and 66%, respectively, in 2020 growing seasons compared to TBIO Tibagi, (Table 2). The AUDPC for tan spot was reduced by 20 and 25% with the recommended and high N rates, respectively, compared to the low N rate (Table 2). However, the higher N rate had a similar effect on the AUDPC for tan spot as the recommended N rate. However, the AUDPC of powdery mildew increased by 15 and 22% with the higher and recommended N rates, respectively, compared to the lower N rate (Table 2). Fungicide application significantly influenced the AUDPCs for all diseases evaluated. In the 2019 growing season, fungicide application reduced the AUDPC for tan spot by 33% in 2019 and in the 2020 growing season by 29%. The AUDPC for powdery mildew was reduced by 33% due to fungicide application only in the 2020 growing season. The AUDPCs for leaf rust and FHB decreased by 76 and 74%, respectively, in the 2019 growing season and by 47 and 35%, respectively, in the 2020 growing season, due to fungicide application (Table 2).
The most significant interactions observed were for cultivar × fungicide and cultivar × N, which varied depending on the variables analyzed (Table 1; Figures 2 and 3). The cultivar × fungicide interaction was significant for the AUDPCs from tan spot and leaf rust. For TBIO Audaz, fungicide application decreased the AUDPC for tan spot by 27%. A similar result was observed for TBIO Tibagi, in which the AUDPC for tan spot in the fungicide-treated plots was 34% lower than in non-treated plots. In the case of the AUDPC for leaf rust, fungicide application reduced it by 40% in TBIO Audaz cultivar. A similar trend was observed for TBIO Tibagi cultivar, where fungicide application resulted in an 80% reduction in the AUDPC for leaf rust compared to the non-treated control. In contrast, the AUDPC for FHB was not affected by any interaction regardless of the growing season.
The fungicide × N interaction was significant for the AUDPC of tan spot (p < 0.05) in the 2019 growing season, while the cultivar × N rate interaction was significant for the AUDPC of tan spot in both growing seasons (Table 1). For TBIO Audaz cultivar, higher N application reduced the AUDPC of tan spot by 20% relative to lower N application, while the AUDPC of tan spot was 23% lower under higher N than at the lower N for TBIO Tibagi cultivar (Table 2).
Effect of cultivar, fungicide, and N rate on grain yield and yield components
There were significant differences (p < 0.05) in the grain yield and quality variables for the fixed factors (fungicide, cultivar, and N rate) as well as for the interaction between cultivar × fungicide and cultivar × N (Table 3). The factors cultivar and fungicide were significant factors (p < 0.05) affecting TKW, TW, and yield in both 2019 and 2020 growing seasons (Table 3).
Summary statistics from linear mixed model analyses of the effects of fungicide (FU), cultivar (C), nitrogen rate (NR), and their interactions on 1000-kernel weight (TKW), test weight (TW), yield, healthy area duration (HAD), plant nitrogen level (PNL), and total nitrogen in grain (TNG) in 2019 and 2020.
The cultivar TBIO Audaz outperformed the cultivar TBIO Tibagi regarding the yield components evaluated such as TKW, TW, and yield, with increases of 14, 4, and 40%, respectively in the 2019 growing season and 29, 7, and 74%, respectively, in the 2020 growing season (Table 4). Compared to the non-treated control, fungicide application increased TKW, TW, and yield by 25, 8, and 27%, respectively, in 2019 growing season and 37, 6, and 44%, respectively, in 2020 growing season (Table 4). The recommended N rate produced a higher yield of 29 and 36% in the 2019 and 2020 growing season, respectively, compared to the lower N rate.
There were significant effects (p < 0.05) of cultivar and N rate on HAD, PNL, and TNG in the 2019 and 2020 growing seasons (Table 3). However, for HAD, the N rates showed significant differences, but this effect was not consistent between the growing seasons. The HAD was higher for TBIO Audaz by 88% in the 2019 growing season and 23% in the 2020 growing season compared to TBIO Tibagi, and corresponded to an increase of 8-15 days (Table 4). Higher N increased HAD by 9% relative to the lower N in 2019 growing season. The PNL was 9% higher for TBIO Audaz in the 2020 growing season, but no differences were observed in the 2019 growing season. Conversely, in TBIO Tibagi, increases of 15% in the 2019 growing season and 9% in the 2020 growing season for TNG compared to TBIO Audaz. The N rates also influenced the PNL, with higher N increasing PNL by 21% in the 2019 growing season and 8% in the 2020 growing season, compared to lower N (Table 4). Furthermore, increases of 15 and 12% in TNG were observed in the 2019 and 2020 growing seasons, respectively, for higher N rate compared to lower N rate.

Effect of the cultivar × fungicide interaction for the area under disease progress curve (AUDPC) of tan spot (A), and leaf rust (B), as well as 1000-kernel weight (TKW) (C), test weight (TW) (D), yield (E), and healthy area duration (HAD) (F). The horizontal line inside the box represents the median, the limits of the box represent the lower and upper quartiles, and the circles represent the observation of each treatment. Data points (♦) are the mean, and error bars represent standard deviation of means. Different lowercase letters indicate statistical differences according to the Tukey test at p < 0.05.
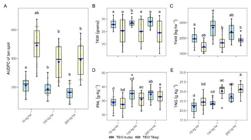
Effect of the cultivar × nitrogen interaction for area under disease progress curve (AUDPC) of tan spot (A), as well as 1000-kernel weight (TKW) (B), yield (C), plant nitrogen content (PNL) (D), and total nitrogen in grain (TNG) (E). The horizontal line inside the box represents the median, the limits of the box represent the lower and upper quartiles, and the circles represent the observations for each treatment. Data points (♦) are the mean, and error bars represent the standard deviation of the mean. Different lowercase letters indicate statistical differences according to the Tukey test at p < 0.05.
The interaction between cultivar and fungicide was significant (p < 0.05) for TKW, TW, and HAD in 2019 and 2020 growing seasons (Table 3). There were no differences in TKW between fungicide-treated and untreated treatments for TBIO Audaz. However, for TBIO Tibagi, fungicide application increased TKW by 37% (Figure 2C). Plant for TBIO Audaz treated with fungicide showed an increase of 4% increase in TW compared to non-treated plants, while plants from TBIO Tibagi showed a 12% increase in TW with fungicide application (Figure 2D). Yields for TBIO Audaz increased by 54% in response to fungicide application (Figure 2E). For HAD, TBIO Audaz showed a 76% increase with fungicide treatment compared to TBIO Tibagi (Figure 2F).
The interaction between cultivar and N was significant (p < 0.05) for TKW, yield, PNL, and TNG in 2019 and 2020 growing seasons (Figure 3). For TKW, there were no significant differences among N rates for TBIO Audaz, while TBIO Tibagi showed a 4% reduction in TKW at the recommended N rate compared to the lower N (Figure 3B). In terms of yield, TBIO Audaz treated with the recommended N rate achieved a 37% higher yield compared to low N and an 11% higher in yield compared to the higher N. For TBIO Tibagi, the yield increased by 30% at the recommended N rate compared to the lower N rate (Figure 3C). Regarding PNL, higher N rate resulted in increases of 21 and 20% for TBIO Audaz and TBIO Tibagi, respectively, compared to the lower N rate. There were no significant differences between cultivars at the higher and recommended N rates for PNL (Figure 3D). Higher N rate also increased the TNG for TBIO Audaz and TBIO Tibagi by 13 and 16%, respectively, compared to the lower N, although no significant differences were observed between cultivars at the higher and recommended N rates for TNG (Figure 3E).
Economic analysis
According to the partial budget analysis (Table S1−Supplementary Material), plants from TBIO Tibagi treatment without fungicide and with lower N rate input had the lowest variable cost (USD 633.41), whereas the highest variable cost was observed for plants from TBIO Audaz treated with fungicide and supplied with the higher N rate (USD 726.30). Plants from TBIO Audaz sprayed with fungicide and supplied with the recommended N rate showed the highest net profit (USD 271.04), while plants from the TBIO Tibagi without fungicide application and supplied with the lower N rate showed a negative performance with a net loss (−USD 337.77).
According to dominance analysis, the treatments of TBIO Audaz without fungicide application and supplied with recommended N rate, TBIO Audaz with fungicide application and supplied with the lower N rate, and TBIO Audaz sprayed with fungicide and supplied with recommended N rate were not dominated (Table S2−Supplementary Material). The remaining treatments dominated and were excluded from further analyses.
The economic analysis of the marginal net benefits showed that TBIO Audaz, supplied with recommended N rate (130 kg ha−1) and sprayed with fungicide had the highest net marginal benefit (USD 193.74) compared to TBIO Audaz without fungicide application and supplied with the lower N rate (Table 5).
Nitrogen use efficiency and cost-efficiency index
In this study, treatments with lower and recommended N rates showed a higher NUE valued compared to higher N treatments. TBIO Audaz had a higher NUE than TBIO Tibagi. Furthermore, the non-sprayed treatments showed a higher NUE valued compared to treatments with fungicide application (Table 6). The dominance analysis of NUE and variable cost showed that the treatments TBIO Audaz no sprayed with fungicide and with lower N rate, TBIO Audaz no sprayed with fungicide and with lower N rate, and TBIO Audaz no sprayed with fungicide and with recommended N rate were not dominated (ND) (Table S3−Supplementary Material). The remaining treatments were dominated (D) and excluded from further analyses. Therefore, the cost-efficiency analysis showed that the TBIO Audaz no sprayed with fungicide and with lower N rate had the lowest cost-efficiency index (Table 6).
Discussion
In this study, four diseases (tan spot, powdery mildew, leaf rust, and FHB) were observed during the development of wheat plants, each exhibiting different levels of intensity. Weather conditions strongly influence diseases progress. Tan spot was the most prevalent disease, consistent with observations reported by Pazdiora et al. (2021). In 2019 growing season, higher winter temperatures contributed greatly for powdery mildew intensity compared to the 2020 growing season. Conversely, leaf rust was more intense in the 2020 growing season than to the 2019 growing season. Although early maturing wheat cultivars are recommended to avoid diseases such as FHB (Gilbert & Haber, 2013), their use in the current study did not reduce its damage, likely due to the increased rainfall during anthesis favoring FHB severity. The final intensity of all four diseases studied was influenced by the level of susceptibility of each cultivar and their interaction with fungicide application and the N rate.
The results of this study clearly demonstrated the effects of treatment interactions on disease development during wheat growth. Tan spot appeared in the early stages of wheat development, while leaf rust emerged just before flowering. Both diseases were more severe in plants from the cultivar TBIO Tibagi compared to the cultivar TBIO Audaz. The cultivar × fungicide interaction showed that two fungicide applications on plants from the susceptible cultivar reduced the disease-related damage. However, for TBIO Audaz, even without fungicide application, AUDPCs were obtained than TBIO Tibagi sprayed with fungicide. The cultivar TBIO Audaz was less susceptible to diseases, regardless of fungicide use, indicating that its level of basal resistance can be adequate for disease management under high inoculum pressure. These Tbio Audaz findings highlight that selecting wheat cultivars suited to specific growing regions, along with appropriate management practices, can improve wheat production, including in successive crops.
The fertilization with recommended and higher N rates, particularly using a moderately resistant cultivar, decreased the AUDPC values for tan spot. These findings align with previous studies that also reported a reduction in tan spot severity with higher N rates (Fleitas et al., 2018; Román Ramos et al., 2024). Similarly, this study supports previous research indicating that higher N rates can modify the crop canopy, increasing, therefore, the green leaf area index (GLAI), and delaying senescence due to enhanced radiation interception and radiation use efficiency (RUE) (Fleitas et al., 2018; Hawkesford, 2014; Schierenbeck et al., 2016). This, in turn, reduces the severity of diseases caused by necrotrophic pathogens.
However, the effect of the N rate will depend on the host-pathogens interaction. While higher N rate reduced the AUDPC valued for tan spot, it increased the AUDPC values for powdery mildew in plants from cultivars Tbio Tibagi and Tbio Audaz. Leaf rust and FHB were not affected by the N rate. Increased susceptibility of plants to biotrophic pathogens, such as B. graminis f. sp. tritici, due to higher N supply is well-documented in the literature and may be linked to an increased availability of low-molecular-weight N compounds, that may be favor the nutrition of the pathogens (Datnoff et al., 2023; Mur et al., 2017). Additionally, higher N rate is often associated with a decrease in the activities of key enzymes in the phenylpropanoid pathway that will reduce the synthesis of defense-related phenolics (Dixon et al., 2002), which could explain the increased severity of powdery mildew. In contrast, the accumulation of phenylpropanoid derivatives at the infection sites of the necrotrophic pathogen P. tritici-repentis has been reported to reduce the disease severity (Dorneles et al., 2017; 2018). These contrasting effects suggest that higher N rate may not be the primary factor influencing the progress of wheat diseases. The source of N could be associated with the activation of different signaling pathways in the plant tissue (Hawkesford, 2014; Huber & Thompson, 2007). Further studies are needed to clarify these effects on the wheat-P. tritici-repentis interaction.
The effects of the fungicide application and N rate on HAD varied between growing seasons, but the effect of cultivar was the most significant factor in reducing disease severity, especially on plants from TBIO Audaz which showed increasing HAD. The interaction between cultivar × fungicide demonstrated that a pre-mix of fungicides (bixafen + prothioconazole + trifloxystrobin) was associated with increased HAD. These findings are consistent with other studies where a triple fungicide mixture (epoxiconazole + pyraclostrobin + fluxapyroxad) contributed to a higher HAD values (Fleitas et al., 2018; Schierenbeck et al., 2019a). Fungicide application increased the GLAI and HAD values in wheat delaying senescence and reducing disease severity (Fleitas et al., 2018; Hawkesford, 2014; Schierenbeck et al., 2016). The fungicide effect may be related to the maintenance of the photosynthetic area of leaves, improvement in CO2 assimilation, and enhancing the concentration of N, chlorophyll, and protein (Ruske et al., 2003).
Fungicide application also affected TKW, TW, yield, and TNG, while N influenced TKW, yield, and TNG. Two fungicide applications during the growing stages of the flag leaf and anthesis stages resulted in increased valued for TKW, TW, and yield. Similarly, Kutcher et al. (2018) found that the fungicide mixture reduced the leaf spot severity and increased yield, TKW, and TW. However, the findings in the present study indicate that increasing the N rate by 50% regarding its the recommended N rate (130 kg ha−1) did not result in higher yields. This suggests that only 30-40% of the applied N can be utilized by the plants, with over 60% were lost through leaching, denitrification, and volatilization (Malhi et al., 2001). Therefore, exceeding the recommended N rate is not cost effective as it increases expenses without improving the NUE.
Additionally, foliar N concentration was influenced by the wheat genotype and management practices under field conditions. For example, in this study, plants from TBIO Tibagi displayed the highest TNG valued but had lower yields compared to plants from TBIO Audaz, which exhibited high PNL and yield. Some studies suggest that the increased yield may be related to N remobilization before leaf senescence possibly from storage proteins rather than those involved in the plant metabolism, at least up to a point that does not affect the essential physiological processes (Kong et al., 2016). These results align with findings by Maillard et al. (2015) and Thomas and Howarth (2000), who reported that N remobilization delays leaf senescence and increases GLAI resulting, therefore, in higher yields.
The findings of the present study indicated that the recommended N rate (130 kg ha−1) for Rio Grande do Sul State, Brazil (Silva et al., 2017), had an effect similar to the higher N rate (200 kg ha−1) in reducing tan spot progress. The recommended N rate used in this study was comparable to the higher N rate (140 kg ha−1) previously reported by Fleitas et al. (2018). Therefore, fertilization with the recommended N rate reduced tan spot without promoting the progress of other leaf diseases and allowing higher yield. Economic analysis showed that plants from TBIO Audaz supplied with lower N rate (70 kg ha−1) and recommended N rate (130 kg ha−1) and sprayed with fungicide produced the best marginal returns. The cost-benefit analysis revealed that plants from TBIO Audaz fertilized with 70 kg N ha−1 was the most efficient in terms of NUE. These findings are consistent with other studies suggesting that using wheat cultivars with a higher NUE allow to reduce the use of N rate without compromising grain yield (Gaju et al., 2014).
Warmer winters with continuous rainfall favor the occurrence of leaf and spike diseases. For the susceptible cultivar, fungicide application combined with the recommended N rate reduced the AUDPCs of leaf diseases. In contrast, the AUDPCs of leaf disease were reduced even without fungicide application for the moderately resistant cultivar, but fungicide spray improved yields due to a higher HAD. The moderately resistant cultivar, combined with fungicide application also increased TW and TKW by reducing disease damage. Economic analysis of marginal net benefits showed that TBIO Audaz supplied with the recommended N rate (130 kg ha−1) and sprayed with fungicide (pre-mix) resulted in greater economic gains.
In summary, increasing the N rate to wheat plants beyond the recommended rate of 130 kg ha−1 raises costs without improving efficiency considering that the use of N by plants does not exceed 40%. Therefore, using a moderately resistant cultivar with the recommended N rate and proper fungicide application will have a positive effect on disease control and wheat yield in considering the NUE.
Conclusion
This study demonstrates that applying the recommended nitrogen (N) rate of 130 kg ha⁻¹ is as effective as higher N rates in controlling tan spot in wheat, without promoting the development of other leaf diseases. Economic and agronomic evaluations confirmed that this rate, especially when combined with fungicide application, offers optimal disease suppression, yield stability, and improved nitrogen use efficiency (NUE). Notably, the moderately resistant cultivar TBIO Audaz, when fertilized with the recommended N rate and treated with fungicide, showed reduced disease severity, increased harvest index, and higher yield components such as test weight (TW) and thousand-kernel weight (TKW). Furthermore, marginal net return analysis highlighted that increasing N beyond 130 kg ha⁻¹ does not provide additional benefits and increases production costs. Overall, adopting cultivars with moderate resistance and managing them with the recommended N rate and targeted fungicide use represents a cost-effective and sustainable strategy for maximizing wheat productivity under disease-prone conditions.
Data availability
The data that support the findings of this study are openly available as a compendium at https://osf.io/wds4f/?view_only=5dd31d76891047b5b6f8885ff34a587c
Acknowledgements
The authors are thankful to the Brazilian National Council for Scientific and Technological Development (CNPq) for the fellowship (Grant number 305247/2021-2). This study was financially supported by the Coordenação de Aperfeiçoamento de Pessoal de Nível Superior-Brasil (CAPES) - Finance Code 001. We are thankful to BIOTRIGO for providing wheat seeds for the experiments.
References
-
AGROLINK. (2021a). Cotações de grãos. https://www.agrolink.com.br/cotacoes/graos/trigo/
» https://www.agrolink.com.br/cotacoes/graos/trigo/ -
AGROLINK. (2021b). Trigo em grão nacional Sc 60 kg. https://www.agrolink.com.br/cotacoes/historico/rs/trigo-em-grao-nacional-sc-60kg
» https://www.agrolink.com.br/cotacoes/historico/rs/trigo-em-grao-nacional-sc-60kg -
American Association of Cereal Chemists. (2010). Approved Methods of Analysis (11th ed.). Cereals & Grains Association. http://methods.aaccnet.org/toc.aspx
» http://methods.aaccnet.org/toc.aspx -
Barro, J., Santana, F. M., Duffeck, M. R., Machado, F. J., Lau, D., Sbalcheiro, C. C., Schipanski, C., Chagas, D. F., Venancio, W. S., Dallagnol, L. J. G, Kuhnem, P., Feksa, H. R. & Del Ponte, E. M.. (2021). Are DMI+ QoI fungicide premixes during flowering worthwhile for fusarium head blight control in wheat? A Meta-analysis. Plant Disease, 105(9), 2680-2687. https://doi.org/10.1094/PDIS-09-20-2096-RE.
» https://doi.org/https://doi.org/10.1094/PDIS-09-20-2096-RE. -
Bertagnolli, V. V., Ferreira, J. R., Liu, Z., Rosa, A. C. & Deuner, C. C.. (2019). Phenotypical and genotypical characterization of Pyrenophora tritici-repentis races in Brazil. European Journal of Plant Pathology, 154, 995-1007. https://doi.org/10.1007/s10658-019-01720-3
» https://doi.org/https://doi.org/10.1007/s10658-019-01720-3 -
Blandino, M. & Reyneri, A.. (2009). Effect of fungicide and foliar fertilizer application to winter wheat at anthesis on flag leaf senescence, grain yield, flour bread-making quality and DON contamination. European Journal of Agronomy, 30(4), 275-282. https://doi.org/10.1016/j.eja.2008.12.005
» https://doi.org/https://doi.org/10.1016/j.eja.2008.12.005 - Bremner, J. M. & Mulvaney, C. S.. (1982). Nitrogen—total. Methods of soil analysis: part 2 chemical and microbiological properties, 9, 595-624.
-
Castro, A. C., Fleitas, M. C., Schierenbeck, M., Gerard, G. S. & Simón, M. R.. (2018). Evaluation of different fungicides and nitrogen rates on grain yield and bread-making quality in wheat affected by Septoria tritici blotch and yellow spot. Journal of Cereal Science, 83, 49-57. https://doi.org/10.1016/j.jcs.2018.07.014
» https://doi.org/https://doi.org/10.1016/j.jcs.2018.07.014 - Companhia Nacional de Abastecimento (2021a). Acompanhamento da Safra Brasileira de Grãos, v. 8, safra 2020/21, n. 5, quinto levantamento, fev. 2021. CONAB.
-
Companhia Nacional de Abastecimento. (2021b). Série histórica-custos-trigo-1998 a 2021. CONAB. https://www.conab.gov.br/info-agro/custos-de-producao/planilhas-de-custo-de-producao/itemlist/category/828-trigo
» https://www.conab.gov.br/info-agro/custos-de-producao/planilhas-de-custo-de-producao/itemlist/category/828-trigo -
Cruz, M. F. A., Silva, L. A. F., Rios, J. A., Debona, D. & Rodrigues, F.. (2015). Microscopic aspects of the colonization of Pyricularia oryzae on the rachis of wheat plants supplied with silicon. Bragantia, 74(2), 207-214. https://doi.org/10.1590/1678-4499.0023
» https://doi.org/https://doi.org/10.1590/1678-4499.0023 - Datnoff, L. E., Elmer, W. H. & Rodrigues, F. A. (2023). Mineral nutrition and plant disease. APS Press.
-
Debona, D., Rodrigues, F., Rios, J. A. & Nascimento, K. J. T.. (2012). Biochemical changes in the leaves of wheat plants infected by Pyricularia oryzae. Phytopathology, 102(12), 1121-1129. https://doi.org/10.1094/PHYTO-06-12-0125-R
» https://doi.org/https://doi.org/10.1094/PHYTO-06-12-0125-R -
Del Ponte, E. M., Fernandes, J. M. C. & Bergstrom, G. C.. (2007). Influence of growth stage on Fusarium head blight and deoxynivalenol production in wheat. Journal of Phytopathology, 155(10), 577-581. https://doi.org/10.1111/j.1439-0434.2007.01281.x
» https://doi.org/https://doi.org/10.1111/j.1439-0434.2007.01281.x -
Del Ponte, E. M., Fernandes, J. M. C., Pavan, W. & Baethgen, W. E. (2009). A model‐based assessment of the impacts of climate variability on fusarium head blight seasonal risk in Southern Brazil. Journal of Phytopathology, 157(11‐12), 675-681. https://doi.org/10.1111/j.1439-0434.2009.01559.x
» https://doi.org/https://doi.org/10.1111/j.1439-0434.2009.01559.x -
Dixon, R. A., Achnine, L., Kota, P., Liu, C., Reddy, M. S. S. & Wang, L.. (2002). The phenylpropanoid pathway and plant defence—a genomics perspective. Molecular Plant Pathology, 3(5), 371-390. https://doi.org/10.1046/j.1364-3703.2002.00131.x
» https://doi.org/https://doi.org/10.1046/j.1364-3703.2002.00131.x -
Dorneles, K. R., Dallagnol, L. J., Pazdiora, P. C., Rodrigues, F. A. & Deuner, S.. (2017). Silicon potentiates biochemical defense responses of wheat against tan spot. Physiological and Molecular Plant Pathology, 97, 69-78. https://doi.org/10.1016/j.pmpp.2017.01.001
» https://doi.org/https://doi.org/10.1016/j.pmpp.2017.01.001 -
Dorneles, K. R., Pazdiora, P. C., Hoffmann, J. F., Chaves, F. C., Monte, L. G., Rodrigues, F. A. & Dallagnol, L. J.. (2018). Wheat leaf resistance to Pyrenophora tritici-repentis induced by silicon activation of phenylpropanoid metabolism. Plant Pathology, 67(8), 1713-1724. https://doi.org/10.1111/ppa.12876
» https://doi.org/https://doi.org/10.1111/ppa.12876 -
Faris, J. D., Abeysekara, N. S., McClean, P. E., Xu, S. S. & Friesen, T. L.. (2012). Tan spot susceptibility governed by the Tsn1 locus and race-nonspecific resistance quantitative trait loci in a population derived from the wheat lines Salamouni and Katepwa. Molecular Breeding, 30, 1669-1678. https://doi.org/10.1007/s11032-012-9750-7
» https://doi.org/https://doi.org/10.1007/s11032-012-9750-7 -
Fernandez, M. R., Wang, H., Cutforth, H. & Lemke, R.. (2016). Climatic and agronomic effects on leaf spots of spring wheat in the western Canadian prairies. Canadian Journal of Plant Science, 96(5), 895-907. https://doi.org/10.1139/cjps-2015-0266
» https://doi.org/https://doi.org/10.1139/cjps-2015-0266 -
Fleitas, M. C., Schierenbeck, M., Gerard, G. S., Dietz, J. I., Golik, S. I. & Simón, M. R.. (2018). Breadmaking quality and yield response to the green leaf area duration caused by fluxapyroxad under three nitrogen rates in wheat affected with tan spot. Crop Protection, 106, 201-209. https://doi.org/10.1016/j.cropro.2018.01.004
» https://doi.org/https://doi.org/10.1016/j.cropro.2018.01.004 -
Gaju, O., Allard, V., Martre, P., Le Gouis, J., Moreau, D., Bogard, M., Hubbart, S. & Foulkes, M. J.. (2014). Nitrogen partitioning and remobilization in relation to leaf senescence, grain yield and grain nitrogen concentration in wheat cultivars. Field Crops Research, 155, 213-223. https://doi.org/10.1016/j.fcr.2013.09.003
» https://doi.org/https://doi.org/10.1016/j.fcr.2013.09.003 -
Gilbert, J. & Haber, S.. (2013). Overview of some recent research developments in Fusarium head blight of wheat. Canadian Journal of Plant Pathology, 35(2), 149-174. https://doi.org/10.1080/07060661.2013.772921
» https://doi.org/https://doi.org/10.1080/07060661.2013.772921 -
Hawkesford, M. J.. (2014). Reducing the reliance on nitrogen fertilizer for wheat production. Journal of Cereal Science, 59(3), 276-283. https://doi.org/10.1016/j.jcs.2013.12.001
» https://doi.org/https://doi.org/10.1016/j.jcs.2013.12.001 - Horsfall, J. G. & Barratt, R. W. (1945). An improved grading system for measuring plant diseases. Phytopathology, 35, 655-656.
- Huber, D. & Thompson, I. (2007). Nitrogen and plant disease. In L. Datnoff, W. Elmer & D. Huber (Eds.), Mineral nutrition and plant disease. (pp. 31-44). APS Press.
-
Kong, L., Xie, Y., Hu, L., Feng, B. & Li, S.. (2016). Remobilization of vegetative nitrogen to developing grain in wheat (Triticum aestivum L. ). Field Crops Research, 196, 134-144. https://doi.org/10.1016/j.fcr.2016.06.015
» https://doi.org/https://doi.org/10.1016/j.fcr.2016.06.015 -
Kutcher, H. R., Turkington, T. K., McLaren, D. L., Irvine, R. B. & Brar, G. S.. (2018). Fungicide and cultivar management of leaf spot diseases of winter wheat in western Canada. Plant Disease, 102(9), 1828-1833. https://doi.org/10.1094/PDIS-12-17-1920-RE
» https://doi.org/https://doi.org/10.1094/PDIS-12-17-1920-RE -
Machado, F. J., Santana, F. M., Lau, D. & Del Ponte, E. M. (2017). Quantitative review of the effects of triazole and benzimidazole fungicides on Fusarium head blight and wheat yield in Brazil. Plant Disease, 101(9), 1633-1641. https://doi.org/10.1094/PDIS-03-17-0340-RE.
» https://doi.org/https://doi.org/10.1094/PDIS-03-17-0340-RE -
MacLean, D. E., Lobo, J. M., Coles, K., Harding, M. W., May, W. E., Peng, G., Turkington, T. K. & Kutcher, H. R.. (2018). Fungicide application at anthesis of wheat provides effective control of leaf spotting diseases in western Canada. Crop Protection, 112, 343-349. https://doi.org/10.1016/j.cropro.2018.06.019
» https://doi.org/https://doi.org/10.1016/j.cropro.2018.06.019 -
Maillard, A., Diquélou, S., Billard, V., Laîné, P., Garnica, M., Prudent, M., Garcia-Mina, J., Yvin, J. & Ourry, A.. (2015). Leaf mineral nutrient remobilization during leaf senescence and modulation by nutrient deficiency. Frontiers in Plant Science, 6(317), 1-15. https://doi.org/10.3389/fpls.2015.00317
» https://doi.org/https://doi.org/10.3389/fpls.2015.00317 -
Malhi, S. S., Grant, C. A., Johnston, A. M. & Gill, K. S.. (2001). Nitrogen fertilization management for no-till cereal production in the Canadian Great Plains: a review. Soil and Tillage Research, 60(3-4), 101-122. https://doi.org/10.1016/S0167-1987(01)00176-3
» https://doi.org/https://doi.org/10.1016/S0167-1987(01)00176-3 - Meena, S. K., Rakshit, A. & Meena, V. S. (2016). Effect of seed bio-priming and N doses under varied soil type on nitrogen use efficiency (NUE) of wheat (Triticum aestivum L.) under greenhouse conditions. Biocatalysis and Agricultural Biotechnology, 6, 68-75.
- Miralles, D. J. & Slafer, G. A. (1990). Estimación del área foliar en trigo: Generación y validación de un modelo. In 11º Congreso Nacional de Trigo (Cap. I, pp. 76-85). Pergamino.
-
Mur, L. A. J., Simpson, C., Kumari, A., Gupta, A. K. & Gupta, K. J.. (2017). Moving nitrogen to the centre of plant defence against pathogens. Annals of Botany, 119(5), 703-709. https://doi.org/https://doi.org/10.1093/aob/mcw179
» https://doi.org/https://doi.org/https://doi.org/10.1093/aob/mcw179 -
Pazdiora, P. C., Dorneles, K. R., Forcelini, C. A., Del Ponte, E. M. & Dallagnol, L. J.. (2018). Silicon suppresses tan spot development on wheat infected by Pyrenophora tritici-repentis. European Journal of Plant Pathology, 150(1), 49-56. https://doi.org/https://doi.org/10.1007/s10658-017-1251-4
» https://doi.org/https://doi.org/https://doi.org/10.1007/s10658-017-1251-4 -
Pazdiora, P. C., Dorneles, K. R., Morello, T. N., Nicholson, P. & Dallagnol, L. J.. (2021). Silicon soil amendment as a complement to manage tan spot and Fusarium head blight in wheat. Agronomy for Sustainable Development, 41(2), 1-13. https://doi.org/10.1007/s13593-021-00677-0
» https://doi.org/https://doi.org/10.1007/s13593-021-00677-0 - Perrin, R. K., Winkelmann, D. L., Moscardi, E. R. & Anderson, J. R. (1979). From agronomic data to farmer recommendations: An economics training manual (Information Bulletin No. 27). CIMMYT.
-
Peterson, R. F., Campbell, A. B. & Hannah, A. E. (1948). A diagrammatic scale for estimating rust intensity on leaves and stems of cereals. Canadian Journal of Research, 26C(5), 496-500. https://doi.org/10.1139/cjr48c-033
» https://doi.org/https://doi.org/10.1139/cjr48c-033 - Reis, E. M., Blum, M. M. C. & Casa, R. T.. (1996). Controle químico de Gibberella zeae em trigo, um problema de deposição de fungicidas em anteras. Summa Phytopathologica, 22, 39-42.
-
Reunião da Comissão Brasileira de Pesquisa de Trigo e Triticale. (2018). Informações técnicas para trigo e triticale - safra 2019. XII Reunião da Comissão Brasileira de Pesquisa de Trigo e Triticale. https://www.embrapa.br/busca-de-publicacoes/-/publicacao/1108443/informacoes-tecnicas-para-trigo-e-triticale---safra-2019.
» https://www.embrapa.br/busca-de-publicacoes/-/publicacao/1108443/informacoes-tecnicas-para-trigo-e-triticale---safra-2019. -
Román Ramos, A. E., Aucique-Perez, C. E., Debona, D. & Dallagnol, L. J.. (2024). Nitrogen and Silicon Contribute to wheat defense’s to Pyrenophora tritici-repentis, but in an independent manner. Plants, 13(11), 1-14. https://doi.org/10.3390/plants13111426
» https://doi.org/https://doi.org/10.3390/plants13111426 -
RStudio. (2021). RStudio: Integrated development environment for R. RStudio, PBC. http://www.rstudio.com/
» http://www.rstudio.com/ -
Ruske, R. E., Gooding, M. J. & Jones, S. A.. (2003). The effects of adding picoxystrobin, azoxystrobin and nitrogen to a triazole programme on disease control, flag leaf senescence, yield and grain quality of winter wheat. Crop Protection, 22(7), 975-987. https://doi.org/10.1016/S0261-2194(03)00113-3
» https://doi.org/https://doi.org/10.1016/S0261-2194(03)00113-3 -
Savary, S., Willocquet, L., Pethybridge, S. J., Esker, P., McRoberts, N. & Nelson, A.. (2019). The global burden of pathogens and pests on major food crops. Nature Ecology & Evolution, 3(3), 430-439. https://doi.org/10.1038/s41559-018-0793-y
» https://doi.org/https://doi.org/10.1038/s41559-018-0793-y -
Schierenbeck, M., Fleitas, M. C. & Simón, M. R.. (2019b). Nitrogen fertilization and fungicide mixtures in wheat: how do they affect the severity, yield and dynamics of nitrogen under leaf rust infections?. European Journal of Plant Pathology, 155(4), 1061-1075. https://doi.org/10.1007/s10658-019-01832-w
» https://doi.org/https://doi.org/10.1007/s10658-019-01832-w -
Schierenbeck, M., Fleitas, M. C., Gerard, G. S., Dietz, J. I. & Simón, M. R.. (2019a). Combinations of fungicide molecules and nitrogen fertilization revert nitrogen yield reductions generated by Pyrenophora tritici-repentis infections in bread wheat. Crop Protection, 121, 173-181. https://doi.org/10.1016/j.cropro.2019.04.004
» https://doi.org/https://doi.org/10.1016/j.cropro.2019.04.004 -
Schierenbeck, M., Fleitas, M. C., Miralles, D. J. & Simón, M. R. (2016). Does radiation interception or radiation use efficiency limit the growth of wheat inoculated with tan spot or leaf rust? Field Crops Research, 199, 65-76. https://doi.org/10.1016/j.fcr.2016.09.017
» https://doi.org/https://doi.org/10.1016/j.fcr.2016.09.017 -
Sermeño, J., Rivas, A. & Menjívar, R. (2001). Manual tecnico manejo integrado de plagas. MAG-OIRSA-UES. http://usi.earth.ac.cr/glas/sp/Oirsa/50000083.pdf
» http://usi.earth.ac.cr/glas/sp/Oirsa/50000083.pdf - Shaner, G. & Finney, R. E.. (1977). The effect of nitrogen fertilization on the expression of slow-mildewing resistance in Knox wheat. Phytopathology, 67(8), 1051-1056.
-
Silva, S. R., Bassoi, M. C. & Foloni, J. S. S. (2017). Informações técnicas para trigo e tricale- safra 2017. Embrapa. http://ainfo.cnptia.embrapa.br/digital/bitstream/item/155787/1/Informacoes-Tecnicas-para-Trigo-e-Triticale-Safra-2017-OL.pdf
» http://ainfo.cnptia.embrapa.br/digital/bitstream/item/155787/1/Informacoes-Tecnicas-para-Trigo-e-Triticale-Safra-2017-OL.pdf -
Simón, M. R., Fleitas, M. C., Castro, A. C. & Schierenbeck, M.. (2020). How foliar fungal diseases affect nitrogen dynamics, milling and end-use quality of wheat. Frontiers in Plant Science, 11(1568), 1-23. https://doi.org/10.3389/fpls.2020.569401
» https://doi.org/https://doi.org/10.3389/fpls.2020.569401 -
Stack, R. W., & McMullen, M. P. (2011). A visual scale to estimate severity of Fusarium head blight in wheat [Technical report]. North Dakota State University. https://www.ag.ndsu.edu/ndipm/publications/wheat/documents/pp1095.pdf
» https://www.ag.ndsu.edu/ndipm/publications/wheat/documents/pp1095.pdf -
Thomas, H. & Howarth, C. J. (2000). Five ways to stay green. Journal of Experimental Botany, 51(Suppl. 1), 329-337. https://doi.org/10.1093/jexbot/51.suppl_1.329
» https://doi.org/https://doi.org/10.1093/jexbot/51.suppl_1.329 -
Waggoner, P. E. & Berger, R. D. (1987). Defoliation, disease, and growth. Phytopathology, 77(3), 393-398. https://doi.org/10.1094/Phyto-77-393
» https://doi.org/https://doi.org/10.1094/Phyto-77-393 -
Zadoks, J. C., Chang, T. T. & Konzak, C. F.. (1974). A decimal code for the growth stages of cereals. Weed Research, 14(6), 415-421. https://doi.org/10.1111/j.1365-3180.1974.tb01084.x
» https://doi.org/https://doi.org/10.1111/j.1365-3180.1974.tb01084.x
Edited by
-
Associate Editor in charge:
Alessandro Lucca BracciniCarlos Alberto Scapim