 Correction of distortions in image analysis for improved phenotyping of tomato fruit
ABSTRACT.
With technological advancements, particularly in image analysis, phenotyping can now be conducted more accurately, impartially, and non-destructively. However, distortions caused by different camera angles as well as environmental factors, such as lighting, lead to inaccurate results in image analysis. Therefore, a method for correcting these distortions is necessary to achieve more precise outcomes. The objective of this study was to develop an algorithm that corrects image distortion and improves tomato fruit phenotyping and to determine its efficiency. A photographic studio and a smartphone were used to capture the images. To test the developed algorithm, twelve 4 × 4 cm black squares were printed on A4 sheets, with four of these sheets placed inside the studio. Additionally, eight 3 × 3 cm yellow square sheets were used as reference objects to correct distortions. A total of 40 images were obtained with different camera angles. A multiple regression model was then adjusted and tested for each image to obtain a correction factor for distortions caused by varying camera angles. In the test images, higher estimates for the coefficient of variation and mean squared error were observed at the edges and lower ones at the center. After correcting the images using the adjusted regression model, uniformity in the estimates was achieved. The same behavior was observed when validating the model with images of tomato fruit. The coefficient of determination of the adjusted model was over 80%, indicating a high fit for the selected model. Therefore, the image distortion correction methodology ensures more accurate results in tomato fruit phenotyping.
Keywords:
phenomics; tomato; image distortions; pixels
Introduction
Digital images are visual information stored in computer systems that allow information to be shared and accessed quickly, efficiently, and accurately. These data are used in agriculture to identify cultivars, assess the development of vegetative and reproductive plant parts, identify nutrient deficiencies, and detect weeds (Dell’ Aquila, 2009). Each digital image is composed of small points called pixels, and each pixel contains color information, with the combination of these forming the complete image. The number of pixels in an image is determined by the number of photosensitive units present in the camera sensor (Guerrero et al., 2012). Data acquisition and information processing have made advancements, resulting in an approach known as high-precision phenotyping, which involves data collection in controlled or field environments (Sousa et al., 2015).
However, these evaluations can yield inaccurate results due to image distortions. A major problem encountered when capturing images with digital cameras is the measurement of the object’s size, as distortions related to different camera positions and angles as well as environmental factors, such as lighting, affect the accuracy of the results (Olas et al., 2020). Distortion correction is an important step in image analysis, especially in high-precision and -accuracy applications. Therefore, the distortion correction method should be used to minimize or eliminate negative effects and to improve the quality and precision of image analysis. This correction is crucial in various fields, such as computer vision, robotics, and pattern recognition, and has a direct impact on the reliability and accuracy of the results obtained from images. It also presents a viable possibility in the agricultural production sector. The use of digital imagery enables a more precise and efficient evaluation of fruit, representing a viable alternative for the production sector and research (Chen et al., 2002).
The method proposed in this study enables the correction of object dimensions in images, resulting in a better estimation of size, weight, and crop productivity. The image correction method can be applied to the phenotyping of various agricultural species, such as tomato plants, which are considered model plants due to their rapid development and high economic and social value. With the high demand for and consumption of this vegetable, efforts have been made to develop cultivation methodologies and breeding programs aimed at expanding and promoting large-scale production at low cost. For this purpose, research is needed that can employ image analysis-based phenotyping to improve the precision of experiments and reduce the necessary time, financial resources, and labor. Therefore, the objective of this study was to develop an algorithm that corrects image distortion and improves fruit phenotyping using the tomato plant as a model and to determine its efficiency.
Material and methods
Experiment setup with the tomato crop
This study was conducted at the Professor Hamilton de Abreu Navarro Experimental Farm (FEHAN) of the Institute of Agricultural Sciences (ICA), Minas Gerais Federal University (UFMG), located at the Montes Claros Regional Campus (coordinates: 16°40'58.16" S and 43°50'20.15" W). The experiment took place between 2021 and 2022.
Seeds from five parent lines (‘San Marzano’ - from Isla® company, ‘Santa Clara’ - from Top Seed® company, ‘Gaúcho’ - from Top Seed® company, ‘Santa Cruz Kada Gigante’ - from Feltrin® company, and ‘Gaúcho Melhorado Nova Seleção’ - from Feltrin®) and 10 hybrid combinations were sown in 128-cell Styrofoam trays filled with commercial substrates for vegetables. The seedlings were grown until transplantation, as recommended by Antônio and Almeida (2018), with three seeds sown per cell. Thinning was performed 15 days after germination, leaving 1 seedling per cell and selecting the one with the best physiological and nutritional conditions. When the seedlings developed 4 true leaves after approximately 45 days, they were transplanted into the field.
The experiment was conducted in a randomized block design with 4 replications, 15 treatments (5 parent lines and 10 hybrids), and 5 plants per plot, totaling 300 plants. The vegetables were arranged in 10 planting rows (beds), with a spacing of 2 m between rows, 0.70 m between plants within each plot, and 1 m between plots.
The plants were staked and trained with two stems, with all lateral shoots removed weekly. Fertilization was carried out according to soil analysis and recommendations for tomato cultivation, using Furlani and Bataglia (2018) as a reference. Irrigation was performed daily via drip irrigation, and phytosanitary monitoring was conducted as needed using products registered for the crop. Weed removal and insecticide and fungicide application were performed to control potential pathogens.
Manual harvesting began 90 days after planting. Tomato fruit was evaluated over 12 harvests. Fruit at the ripening stage and with a red color were harvested twice per week. Evaluations were conducted in the laboratory, in which the weight, diameter, and length of the tomato fruit were measured using a precision scale and caliper.
Image acquisition and model creation
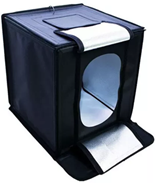
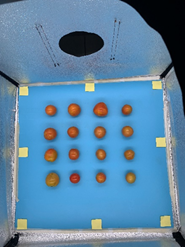
To obtain the images, a photographic studio with dimensions of 60 × 60 × 60 cm and the camera of an iPhone® XR smartphone were used. Initially, twelve 4 × 4 cm black squares were printed on A4 sheets (21 × 29.7 cm). Four of these sheets were placed inside the studio (Figure 1). Additionally, eight 3 × 3 cm yellow square sheets were used as reference objects to correct the image distortion.
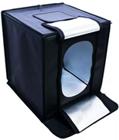
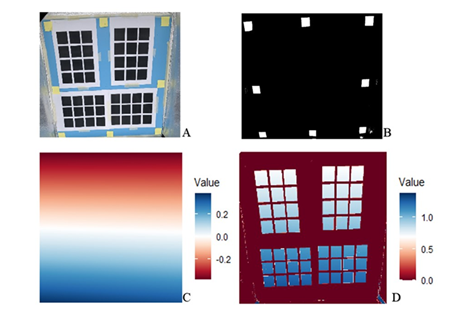
After setting up the studio and preparing the objects to be photographed, 40 images were captured at different camera angles. The angle of each image was recorded using a gyroscope with the aid of the Bubble Level® app. As a result, various distortions in the area of the objects were obtained. For image analysis, the ExpImage package from R software was used. The original images (Figure 2A) were segmented using the segmentation logit function.
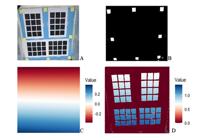
Image obtained in the studio before (A) and after (B) segmentation, and the area correction coefficient obtained per pixel for the entire studio (C) and for objects of interest (D).
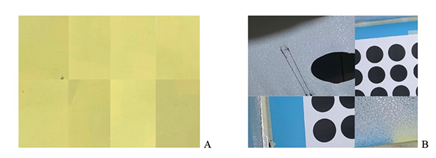
This methodology was used to identify the pixels in the image corresponding to the reference object (Figure 3A) and those not corresponding to the reference object (Figure 3B). After segmentation, images, such as the one shown in Figure 2B, were obtained, and the pixel sizes and their coordinates were extracted.
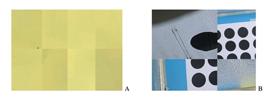
Color palette to identify the pixels in the image corresponding to the reference object (A) and the remainder of the image (B).
Thus, after determining the size of the objects and their positions, a multiple regression model was employed to adjust each image. The aim was to obtain a correction factor based on the coordinates. The model considered was:
Zi = a + bxi + cyi + dxiyi + ei
Where Zi is the deviation between the actual and observed area in the reference object; a is the intercept; b is the linear coefficient corresponding to the row of the object’s center; xi is the row number corresponding to the object’s center; c is the linear coefficient associated with the column corresponding to the object’s center; yi is the column corresponding to the object’s center; d is the interaction coefficient between the row and column of the object’s center; and ei is the experimental error.
After adjusting the model, the value to be used as a correction coefficient for each pixel corresponding to Figure 2C was estimated, which is simply the predicted value by the regression for each pixel in the image (Figure 2D). For each object, these values were summed and used as corrections for estimating the area of each object. This made it possible to adjust the regression model, establish the correction coefficient for the reference object (yellow objects), and obtain the corrected area of the black objects. From the actual and corrected pixel counts, the coefficient of variation (CV) and the mean squared error (MSE) were estimated to verify the methodology’s efficiency.
Adjustment for estimating fruit weight from the image
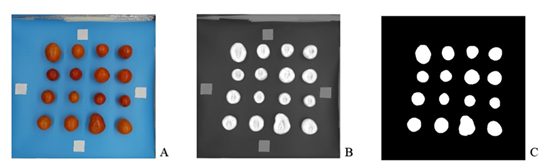
To adjust the weight of the fruit from the image, the previously described studio and camera were used. Thus, images (Figure 4A) of 200 fruits collected randomly from the 5 parent lines and 10 hybrids were obtained. Each of these images was segmented (Figure 4B) using the grayscale function, considering the index Hl = (2*R-G-B)/(G-B). Segmentation was performed using the segmentation function with a threshold of 0.7 (Figure 4C).
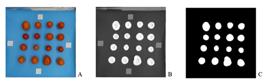
Original image (A) in grayscale (B), and segmented (C) to adjust the regression model to estimate fruit weight based on the number of pixels.
From the segmented image, it became possible to obtain the number of pixels for each fruit. The pixel count of each fruit was then used as an explanatory variable in a first-degree polynomial regression model, with the fruit weight considered the response variable. The quality of the fit was assessed through the coefficient of determination and the significance of the regression coefficients.
Validation of the correction model for tomato fruit
To validate the methodology, 10 images of 16 fruits at different angles were obtained (Figure 5). Thus, the observed pixel area of the fruit was acquired using the previously described methodology, along with the corrected area using reference objects. The pixel areas were used to estimate the fruit weight based on the previously adjusted regression model. By obtaining the actual fruit weight using a precision scale, the estimated and corrected weights were also determined. From these measurements, the coefficient of determination and the mean squared error were calculated to assess the quality of the fit.
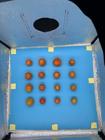
Example of an image obtained with tomato fruit to validate the methodology for correcting image distortion caused by camera tilt.
Results and discussion
Adjustment of the distortion correction method in images
Phenotyping refers to the measurement and quantitative description of the phenotypic characteristics of plant species. With the advancement of studies and research applications focused on image analysis, this evaluation has become possible, making the systems precise and impartial as well as allowing non-destructive assessment of the plant (Fernandes et al., 2022). Furthermore, it enables future analyses by allowing for the storage of images containing relevant information in databases (Eliceiri et al., 2012).
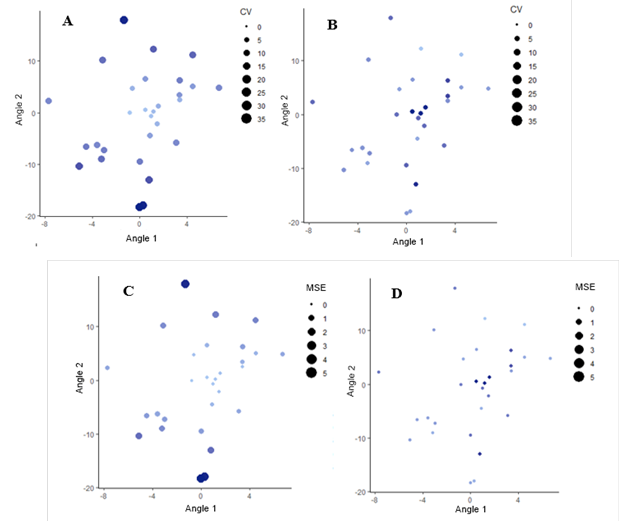
In Figure 6A, a significant variation in the CV is observed, with higher estimates at the edges and lower ones at the center. This variation occurred due to the camera angle, as the measured objects were of the same size. However, after correcting the image using the adjusted regression model, uniformity in the CV estimates was achieved (Figure 6B). This indicates the efficiency of the correction methodology used. Image distortion problems have also been reported in the detection of strawberry flowers and fruit (Chen et al., 2019), in evaluating the emergence of cotton plants (Feng et al., 2020), and in estimating crowd density in drone images (Liu et al., 2019).
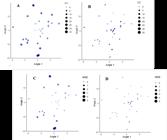
Estimation of the coefficient of variation (CV) of the area of objects obtained through image analysis before (A) and after correction (B) and mean squared error (MSE) before (C) and after (D) correction as a function of different camera angles.
CV is a statistical measure used to evaluate the relative variability concerning the mean of a dataset. The MSE (Figure 6B and C) quantifies the average of the squares of the errors or residuals, which are the differences between the estimated values and the actual values. In Figure 6C, the same pattern observed for the CV is evident, with higher estimates at the edges and lower ones at the center. After applying the correction algorithm, there was a convergence of the MSE values (Figure 6D). Distortion correction has also been employed to evaluate cotton emergence (Feng et al., 2020) and strawberry productivity (Oliveira et al., 2023) in images obtained from drones. In these cases, correction was achieved using the maximum likelihood criterion and radiometric normalization.
According to Casagrande et al. (2022), the image acquisition process can experience distortions caused by various factors such as lighting, cloud cover, and shading, leading to alterations and inaccuracies in the results obtained from phenotypic analyses. Therefore, studies developing methodologies that allow for distortion correction are of utmost importance for the phenotypic evaluation of populations.
Regression analysis to estimate fruit weight based on the observed area
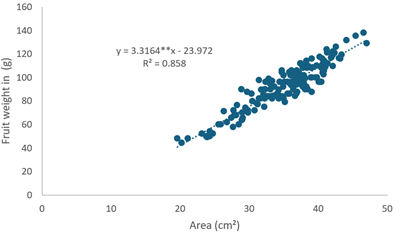
Regression analysis showed that the values found for fruit weight can be explained by the area in cm² occupied by the fruit in the image (Figure 7). The coefficient of determination (R²) was 0.858. The R² indicates the quality of the fit, with values closer to 1, indicating a better fit. This predictive capability of weight based on image analysis is based on the principle that an image consists of a set of pixels representing a matrix of values (x, y) (Pelt & Sethian, 2018). In this sense, the area occupied by the fruit corresponds to a specific number of pixels, making it possible to predict its weight.
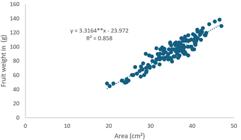
Regression for estimating the weight of tomato fruit based on their area estimated through computational image analysis.
A similar result was obtained by Fernandes et al. (2022) when estimating the weight of sweet potato roots using image analysis. Other research has been conducted using image analysis in agriculture, such as assessing the vigor of sunflower seeds (Rocha et al., 2015) and the growth of rice seedlings (Silva & Dotto, 2017), with positive outcomes reported in these studies.
Estimation of the mean squared error for the estimated fruit weight before and after correction
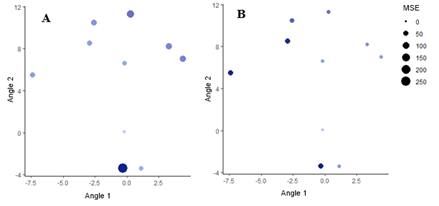
Figure 8 shows the efficiency of the adjustment for estimating the weight of the fruit. In the original images (Figure 8A), there were high estimates of MSE at the extremes, but after applying the correction, a lower MSE was achieved in estimating the fruit weight, regardless of the distortion caused by the camera angle.
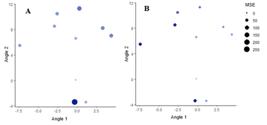
Estimation of the mean squared error (MSE) before (A) and after (B) correction in the weight of tomato fruit based on different camera angles.
Image analysis in plants has been conducted across all plant organs and at various scales, both micro and macro, in diverse environments and situations (Barbosa et al., 2016), employing various methods and algorithms (Bhargava & Bansal, 2021). Thus, the use of high-efficiency phenotyping through image analysis, which incorporates a distortion correction method, ensures greater effectiveness and precision in obtaining estimated values for crop production and productivity in various application areas. This broadens the use of image analysis, as it enables image capture in the field and the correction of distortions caused by camera angles.
Conclusion
The application of image analysis is valuable for estimating tomato fruit weight. The methodology for correcting image distortions ensures more accurate results in estimating fruit area and weight.
Data availability
The algorithm created and the dataset used in this study are available from the corresponding author upon request.
Acknowledgements
Our thanks to CAPES (Coordination for the Improvement of Higher Education Personnel - Finance code 001) , to FAPEMIG (Research Support Foundation of the State of Minas Gerais) and CNPq (National Council for Scientific and Technological Development) for their support for this study
References
- Antônio, A. C. & Almeida, V. S. (2018). Produção de mudas, preparo do solo e plantio. In C. Nick, D. Silva & A. Borém (Eds.), Tomate: do plantio à colheita. (pp. 33-46). UFV.
-
Barbosa, J. Z., Consalter, R., Pauletti, V. & Motta, A. C. V.. (2016). Uso de imagens digitais obtidas com câmeras para analisar plantas. Revista de Ciências Agrárias, 39(1), 15-24. https://doi.org/10.19084/RCA15006
» https://doi.org/https://doi.org/10.19084/RCA15006 -
Bhargava, A. & Bansal, A.. (2021). Fruits and vegetables quality evaluation using computer vision: a review. Journal of King Saud University - Computer and Information Sciences, 33(3), 243-257. https://doi.org/10.1016/j.jksuci.2018.06.002
» https://doi.org/https://doi.org/10.1016/j.jksuci.2018.06.002 -
Casagrande, C. R., Meda, A. R., Garcia, A., Carneiro, P. C. S., Nardino, M. & Borem, A.. (2022). Association between unmanned aerial vehicle high‐throughput canopy phenotyping and soybean yield. Agronomy Journal, 114(3), 1581-1598. https://doi.org/10.1002/agj2.21047
» https://doi.org/https://doi.org/10.1002/agj2.21047 -
Chen, Y, Chao, K. & Kim, M. S.. (2002). Machine vision technology for agricultural applications. Computers and Electronics in Agriculture, 36(2-3), 173-191. https://doi.org/10.1016/S0168-1699(02)00100-X
» https://doi.org/https://doi.org/10.1016/S0168-1699(02)00100-X -
Chen, Y., Gan, H., Peres, N., Fraisse, C., Zhang, Y. & He, Y.. (2019). Strawberry yield prediction based on a deep neural network using high-resolution aerial orthoimages. Remote Sensing, 11(13), 1-21. https://doi.org/10.3390/RS11131584
» https://doi.org/https://doi.org/10.3390/RS11131584 -
Aquila, A.. (2009). Digital imaging information technology applied to seed germination testing. A review. Agronomy for Sustainable Development, 29(1), 213-221. https://doi.org/10.1051/agro:2008039
» https://doi.org/https://doi.org/10.1051/agro:2008039 -
Eliceiri, K. W., Berthold, M. R., Goldberg, I. G., Ibáñez, L., Manjunath, B. S., Martone, M. E., Murphy, R. F., Peng, H., Plant, A. L., Roysam, B., Stuurman, N., Swedlow, J. R., Tomancak, P. & Carpenter, A. E.. (2012). Biological imaging software tools. Nature Methods, 9(7), 697-710. https://doi.org/10.1038/nmeth.2084
» https://doi.org/https://doi.org/10.1038/nmeth.2084 -
Feng, A., Zhou, J., Vories, E. D., Sudduth, K. A. & Zhang, M.. (2020). Yield estimation in cotton using UAV-based multi-sensor imagery. Biosystems Engineering, 193, 101-114. https://doi.org/10.1016/j.biosystemseng.2020.02.014
» https://doi.org/https://doi.org/10.1016/j.biosystemseng.2020.02.014 -
Fernandes, A. C. G., Valadares, N. R., Rodrigues, C. H. O., Alves, R. A., Guedes, L. L. M., Magalhães, J. R., Silva, R. B., Gomes, L. S. P. & Azevedo, A. M.. (2022). Feasibility of computational vision in the genetic improvement of sweet potato root production. Horticultura Brasileira, 40(4), 378-383. https://doi.org/10.1590/s0102-0536-20220405
» https://doi.org/https://doi.org/10.1590/s0102-0536-20220405 - Furlani, P. R. & Bataglia, O. C (2018). Correção do solo e adubação. In C. Nick, D. Silva & A. Borém (Eds.), Tomate: do plantio à colheita. (pp. 47-84). UFV.
- Guerrero, N. R., Quintero, M. A. O. & Naranjo, J. C. P.. (2012). Determinación del área foliar en fotografías tomadas con una cámara web, un teléfono celular o una cámara semiprofesional. Revista Facultad Nacional de Agronomía, 65(1), 6399-6405.
-
Liu, X., He, P., Chen, W. & Gao, J.. (2019). Improving multi-task deep neural networks via knowledge distillation for natural language understanding. Computer Science -Computation and Language, 1, 1-8. https://doi.org/10.48550/arXiv.1904.09482
» https://doi.org/https://doi.org/10.48550/arXiv.1904.09482 -
Olas, J. J., Fichtner, F. & Apelt, F.. (2020). All roads lead to growth: imaging-based and biochemical methods to measure plant growth. Journal of Experimental Botany, 71(1), 11-21. https://doi.org/10.1093/jxb/erz406
» https://doi.org/https://doi.org/10.1093/jxb/erz406 -
Oliveira, L. S., Castoldi, R., Martins, G. D. & Medeiros, M. H.. (2023). Estimation of strawberry crop productivity by machine learning algorithms using data from multispectral images. Agronomy, 13(5), 1-18. http://dx.doi.org/10.3390/agronomy13051229
» https://doi.org/http://dx.doi.org/10.3390/agronomy13051229 -
Pelt, D. M. & Sethian, J. A.. (2018). A mixed-scale dense convolutional neural network for image analysis. Proceedings of the National Academy of Sciences, 115(2), 254-259. https://doi.org/10.1073/pnas.1715832114
» https://doi.org/https://doi.org/10.1073/pnas.1715832114 -
Rocha, C. R. M., Silva, V. N. & Cicero, S. M.. (2015). Avaliação do vigor de sementes de girassol por meio de análise de imagens de plântulas. Ciência Rural, 45(6), 970-976. https://doi.org/10.1590/0103-8478cr20131455
» https://doi.org/https://doi.org/10.1590/0103-8478cr20131455 -
Silva, V. N. & Dotto, L.. (2017). Análise de imagens para a avaliação do crescimento de plântulas de arroz. Agrarian Academy, 4(7), 37-48. https://doi.org/10.18677/Agrarian_Academy_2017a4
» https://doi.org/https://doi.org/10.18677/Agrarian_Academy_2017a4 -
Sousa, C. A. F., Cunha, B. A. D. B., Martins, P. K., Molinari, H. B. C., Kobayashi, A. & Souza Júnior, M. T.. (2015). New approach for plant phenotyping: concepts, current tools and perspectives. Revista Brasileira de Geografia Física, 8, 660-672. http://dx.doi.org/10.5935/1984-2295.20150022
» https://doi.org/http://dx.doi.org/10.5935/1984-2295.20150022
Edited by
-
Associate Editor in charge:
Alessandro Lucca BracciniCarlos Alberto Scapim