 Use of visibility graphs for analysis of computed tomography soil images
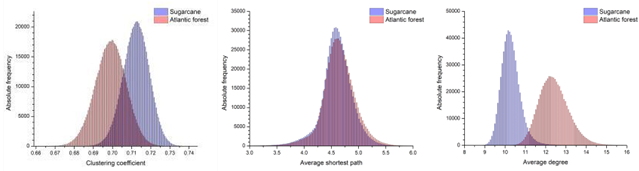
A complex network analysis of three-dimensional soil images obtained by X-ray computed tomography (CT) was employed to analyze the morphological properties of soil under different vegetation covers. This study quantitatively assessed changes in the three-dimensional soil structure due to disturbances caused by sugarcane management techniques. We used CT images of soil covered by the Atlantic Forest and sugarcane with 624,100 voxel columns each to examine topological indices of the networks generated from the vertical lines of the CT images using the visibility graph (VG) method. The VG method successfully described the changes in the structure of the soil samples by comparing the CT images and may be used to quantify soil degradation. The topological indices clustering coefficient, average shortest path, and average degree of the VG network described the communication between soil structural units, pore continuity, and the distribution of paths between pores. We found strong correlations between the phenomenological aspects and the topological descriptors of the generated network, especially for the average degree. This index best highlighted the difference between the samples, revealing greater heterogeneity in the Atlantic Forest sample compared to the sugarcane sample. These correlations indicate that the complexity of the networks of 3D soil images is related to physical properties, enabling quantification of the degradation of soil morphological properties.
Keywords:
visibility graph; computed tomography; soil
 Thumbnail
 Thumbnail
 Thumbnail
 Thumbnail