 Soybean canopy estimation using different image capture methods
ABSTRACT.
The determination of crop canopy characteristics (vegetation cover, leaf area, and leaf area index) is usually obtained through costly methods or methods that require training and time. Based on this, the aim of this work was to determine whether different methods and angles for capturing images using a smartphone camera and fisheye lenses can predict information about the soybean canopy in a practical, fast, and low-cost way. Different methods of capturing images were carried out throughout the soybean cycle using smartphones, attached fisheye lenses, manual normalized difference vegetation index (NDVI) reading equipment, and destructive plant evaluations. The captured images were analyzed in the Canopeo app to determine the green cover fraction. Pearson’s correlation and regression models were used to study the association between NDVI and leaf area index (LAI). The data were compared in the vegetative and reproductive stage segments and throughout the crop cycle to determine whether the image acquisition methods were capable of estimating the variations at each crop stage. With the exception of images captured during the soybean’s reproductive stage, all methods proved to be suitable for evaluations and comparisons using the Canopeo app. Capturing images 1 m above the canopy and video were the methods that best estimated the NDVI and LAI of soybeans.
Keywords:
Fractional Green Canopy Cover; NDVI; optical sensor; Glycine max
Introduction
Soybean (Glycine max (L.) Merrill) is a major global commodity that has been gaining prominence in Brazilian agribusiness. Thus, the technologies used in its cultivation are constantly being improved, as is the search for practical methods that make it easier to diagnose plant behavior and development in the field, such as determining the canopy cover and leaf area index (LAI).
The use of these variables in agriculture is extremely important since the plant canopy coverage directly interferes with the potential for solar radiation interception, photosynthesis, and photoassimilate production, affecting crop growth and development and, consequently, being decisive for estimating responses in yield and productivity (He et al., 2024; Schmitz & Kandel, 2021). In addition, assessing the crop’s canopy cover helps us to be more assertive about the different management methods that should be applied in the field, such as seeding rates, fertilization, biomass, and pesticide applications (Heinonen & Mattila, 2021).
Vegetation cover and LAI can be determined using a variety of methods and tools, either directly or indirectly. These differ in terms of acquisition and application costs, assertiveness, and practicality as well as whether or not they require specialized labor (Wei et al., 2020). Destructive or direct techniques, such as the leaf disk method, require plant removal, causing losses and limiting the representativeness of the evaluation, and require more time to execute and obtain information (Mattos et al., 2020; Tian et al., 2024). However, methods that use remote sensors or normalized difference vegetation index (NDVI) reading devices, which are increasingly common in agriculture, are a more practical and faster alternative for collecting and processing data in the field, but they also have disadvantages, such as higher costs for equipment acquisition and the need for training (Lykhovyd et al., 2022).
The process of collecting information can be made easier when researchers and farmers have access to easy-to-use, low-cost tools for constant, practical on-farm assessments. The free mobile application Canopeo (Oklahoma State University, Stillwater, OK, USA), used to measure the fractional green canopy cover (FGCC), has emerged as a simple and quick technique for verifying the percentage of green cover of soybeans by analyzing photographs captured by a smartphone camera (Patrignani & Ochsner, 2015). Based on these images, it is possible to estimate variables, such as the LAI and canopy cover. Another relevant alternative is a fisheye lens attachment for smartphones for later image analysis using the Canopeo app. These lenses are widely used to assess the vegetation canopy in forestry due to their wide capture angle, which increases the representativeness of the images and results in greater coverage with low operating costs (Tian et al., 2024; Wang et al., 2017).
Thus, the aim of this study was to (i) determine the relationship between the NDVI and the FGCC of soybean obtained using different methods and positions for capturing images with a smartphone camera and a fisheye lens; and (ii) identify the best method for capturing images using a smartphone camera to estimate the soybean leaf area index.
Material and methods
This study was conducted in the experimental area of the Federal University of Santa Maria - Frederico Westphalen Campus, Rio Grande do Sul State, Brazil, during the 2021/2022 crop-growing season. The area is characterized by clayey soil, and the environmental conditions (radiation, iPAR, temperature, and rainfall) during the experiment were collected from the automatic weather station located approximately 400 m distant (Figure 1).

Incident radiation and accumulated intercepted photosynthetically active radiation (accumulated iPAR) as a function of accumulated growing degree-days (A), and mean daily air temperature and daily rainfall (B) recorded during the experiment.
Soybean was planted after the black oat harvest, and glyphosate plus 2,4-dichlorophenoxy acetic acid (2,4-D) was applied to the area 7 days before sowing. The crop row spacing was 0.45 m, and the plant density was 211,111 plants ha−1. The NPK fertilizer used was 250 kg ha−1 of formulation 2-23-23. The plots were 2.25 × 5 m. Crop protection treatments were carried out periodically to prevent damage to plant growth.
The experimental design consisted of randomized blocks with four replications. Different methods of capturing the images and NDVI were carried out between the VE and R5 stages, alternating the height, type of lens, and position of the smartphone in relation to the soybean canopy. Thus, the methods consisted of capturing the image looking down with the lens of the smartphone at 1 m above the canopy (T1); and a fisheye lens attached to the smartphone at 1 and 0.43 m above the canopy (T2 and T3, respectively); image capture with the smartphone camera looking upwards (smartphone positioned on the ground surface) (T4) and fisheye attached (T5); and video traveling at a speed of 1 m/s with a smartphone positioned 0.80 m from the canopy (T6). The photos above the canopy were taken by a person with their arms outstretched or with the aid of a selfie stick at the pre-determined distances from the plant canopy, as parallel to the ground as possible, without any preparation for taking the images. The bottom-up photos were collected by positioning the smartphone between the crop rows using a selfie stick. Before capturing the images, weeds were manually removed from the plot to avoid confusion. NDVI readings were taken using GreenSeeker equipment positioned statically and parallel to the canopy at a distance of 0.90 m, with the equipment positioned in the center of the crop row. All images were captured in the same plot for each evaluation period.
The images and videos were captured with a Motorola Moto G8 Power smartphone camera between 10:00 and 12:00 on clear days. The camera’s focus and brightness settings were set to automatic mode. The images were saved in JPEG at 4128 × 3096 pixels (12 MP) and the videos in FHD at 1920 × 1080 pixels (2 MP) in a 16:9 aspect ratio. The field of view of the images and videos was 61° × 48°, with a capture area of 0.90 × 1.2 m, while the fisheye lens provided a field of view of 116° × 90° and a capture area similar to the previous one for a height of 0.43 m from the canopy and 2.0 × 3.2 m (6.4 m2) for the height of the smartphone at 1 m from the canopy. The images collected in the field were analyzed in the Canopeo app (Oklahoma State University, Stillwater, OK, USA) with the red/green and blue/green ratio color thresholds set to 1.0, generating the fractional green canopy cover (FGCC). NDVI readings with GreenSeeker equipment were taken instantaneously in the field.
After acquiring the images, we determined the soybean’s growth stage and leaf area in 0.45 m2. The disk method was used to determine the leaf area (LA) (m2), and LAI was estimated by the ratio of leaf area to the sample area (0.45 m²).
Pearson’s correlation and regression models were used to study the associations between the NDVI, LAI, and FGCC obtained by the Canopeo app. The data were compared in the vegetative and reproductive growth stage segments and throughout the crop cycle to determine whether the image acquisition methods were capable of estimating the variations in each crop growth stage. The performance of the equations was evaluated using the coefficient of determination (R²) and the root mean square error (RMSE). The FGCC data were submitted to analysis of variance (ANOVA), with different methods of capturing the images and soybean growth stages as factors. Means of FGCC were separated using the least significant difference (LSD) test (p ≤ 0.05). Rbio and Sigmaplot 15 software were used to carry out the analyses and graphical representations.
Results and discussion
Relationship between NDVI and FGCC
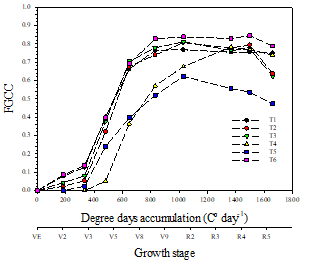
There was an interaction between the image capture methods to determine the canopy cover fraction and soybean growth stages (Figure 2). The images corresponding to the video (T6) and with the smartphone camera 1 m from the canopy (T1) showed the highest values in the early stages, and as the stages progressed, the differences were reduced. In the vegetative stages, the images taken from the top view (T4 and T5) showed low FGCC values, and from the R3 stage onwards, the images taken from the top view with the smartphone’s own lens (T4) were similar to the treatments with the bottom view. Top-view image captures are an alternative for assessing the plant canopy in weed-infested conditions, which is a limitation of using images in bottom-view image captures.

Fractional Green Canopy Cover (FGCC) measured by different methods of images capture by smartphone camera and fisheye coupled as a function of soybean growth stage or degree days accumulated. LSD = 0.056. Treatments: (T1) top view, smartphone camera, height 1 m; (T2) top view, fisheye lens, height 1 m; (T3) top view, fisheye lens, height 0.43 m; (T4) bottom view, smartphone camera; (T5) bottom view, fisheye lens; (T6) video tour of the plot.
As the vegetative stages progressed, the images with an upward view may have suffered greater interference from sunlight, such as shading and overlapping leaves, which consequently influences the color, brightness, or resolution of the images and thus the detection of the FGCC. According to Guo et al. (2017) and Shepherd et al. (2018), variations in lighting during the day cause variability in the images analyzed by the Canopeo app. However, Patrignani and Ochsner (2015) obtained good results in terms of the accuracy and ability of the Canopeo app to detect shaded leaves, indicating that despite interference from overlapping plants, the Canopeo app can still be considered a good analysis tool compared to other image analysis software for plants exposed to leaf shading (Büchi et al., 2018).
The best correlations between the image capture methods and NDVI for assessing cover were when the plants were in the vegetative stage or considering the entire crop cycle (Figure 3). In the reproductive stage, in general, the correlations were low or not significant between the NDVI and the FGCC.
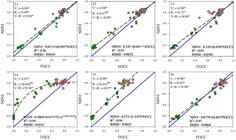
Relationship between NDVI and Fractional Green Canopy Cover (FGCC) obtained by different methods of capturing images with a smartphone camera and fisheye lens attached throughout the soybean cycle. Blue line indicates 1:1 ratio. Crop growing season 2021/2022. Green (●) and red points (●) indicate observations collected during the vegetative (V) and reproductive (R) stages, respectively. “r” indicates Pearson's correlation coefficient (p ≤ 0.05). Treatments: (T1) top view, smartphone camera, height 1 m; (T2) top view, fisheye lens, height 1 m; (T3) top view, fisheye lens, height 0.43 m; (T4) bottom view, smartphone camera; (T5) bottom view, fisheye lens; (T6) video touring the plot.
Although the correlation between the FGCC and NDVI was high in all methods of capturing images at the vegetative stage and throughout the cycle, the FGCC obtained by video capture (T6) and from above with a smartphone lens (T1) were the treatments in which the NDVI was best explained (Figure 3). This can be demonstrated by the visual analysis of the 1:1 line dispersion as well as the lower y-axis intersection and RMSE. These results indicate the high prediction ability of the equations for estimating the NDVI. Patrignani and Ochsner (2015) presented similar results, highlighting that coverage using the video tool through the Canopeo app can be very efficient when there is spatial variability in the area, since several photos are taken simultaneously in the plot, making the results more representative and reducing evaluation errors.
The NDVI was overestimated in the methods for capturing images from above (T4 and T5), showing greater dispersion of the 1:1 line and the highest RMSE values. This factor may be related to the impossibility of capturing the plant canopy with the smartphone camera in the early stages of crop development due to the low plant height. One way to optimize the use of upward-looking image capture and better estimate the NDVI is by tilting the smartphone to increase the capture area and quality of the images, especially in the early stages of the crop (Yin et al., 2022).
Several studies have pointed to the use of NDVI as a way of assessing plant canopy coverage, for example, in assessments of wheat and rice crops, with a rapid and accurate diagnosis of crop growth and yield (Nakano et al., 2023; Tenreiro et al., 2021). The NDVI measured using the Sentinel-2 remote sensor has also been shown to be related to comparative analyses between two smartphones (Motorola Moto G7 and Samsung Galaxy A6) used to assess canopy cover with the Canopeo app in cereals, legumes, and grasses, mainly to classify sites with high or low vegetation (Heinonen & Mattila, 2021).
The use of the NDVI measured by manual equipment (GreenSeeker) has already been shown to be correlated with the FGCC obtained using the Canopeo app in observations at different heights above the canopy for dry matter and leaf area index analyses in pastures (Campana et al., 2023). However, one of the advantages of the Canopeo app is its low cost compared to manual NDVI measurement equipment and its efficiency in calculating coverage.
The use of images captured with fisheye lenses has been an alternative to circumventing the effects of atmospheric conditions on canopy assessments in forests and has good results because of the larger image capture area due to the larger field of view than the smartphone or camera lenses (Smith & Ramsay, 2018). However, in our study, the use of the fisheye did not improve the NDVI estimation compared to the smartphone lens. The use of fisheye lenses in forests has been important in canopy assessment, and their use in annual crops requires further study in terms of the types of crops, positioning of the smartphone, characteristics of the vegetation, and time of assessment.
Canopy cover estimation methods are widely studied to increase the accuracy and speed of data acquisition. When comparing the application of two digital image assessment methods (Canopeo and Assess) with visual assessment in cover crops, Büchi et al. (2018) found underestimated values proposed by observers, especially for crops with narrow leaves and taller heights. This indicates that the type of evaluation is highly dependent on the proposed objective and the crop being evaluated. More precise methods require a higher level of technology and higher costs. However, when quick visualizations are expected in the field, there are tools, such as the Canopeo app, that can provide greater reliability compared to visual evaluation and less interference from atmospheric variations, thus estimating the canopy cover quite accurately.
The use of smartphones as a means of assessing the soybean canopy can be made unfeasible when different models are used in the same assessment, which can result in different FGCC values in the Canopeo app (Heinonen & Mattila, 2021). This is because the devices adjust to the variations in lighting that occur during the day, either automatically or due to the manufacturing characteristics of the cameras, such as their resolution. Another important factor is in relation to the assessment of coverage in crops that have higher levels of flowering, color, and inflorescence sizes, as this can result in underestimations of the FGCC by the Canopeo app, since the app is only able to detect the green color of the leaves (Büchi et al., 2018).
The relationship between the NDVI and FGCC was more precise in our study than in the study conducted by Lykhovyd et al. (2022), who fitted a quadratic model with correlation coefficients between 0.67 and 0.9 using the NDVI based on satellite images of various crops. In our study, however, we obtained high correlations and a better linear model fit (Figure 3). Tenreiro et al. (2021) found that the quadratic model was the model that best explained the relationship between the NDVI obtained by the satellite and the soybean canopy cover but with lower coefficients of determination than those found in our study. This indicates that in situ methods estimate coverage better than satellite data.
Equipment or sensors used to read the NDVI do not present the same restrictions as those observed for smartphone cameras. NDVI readings obtained by remote sensors have the advantage of collecting crop images over large areas, even in places that are difficult to access. They also provide valuable information for detecting environmental or nutritional stress in crops, leading to better management practices (Carneiro et al., 2020).
Despite being recognized for their greater precision, remote sensors can also present limitations or points of attention, such as the occurrence of interference from the ‘noise effect’ caused by vegetation and soil when using satellite images for NDVI analysis (Tenreiro et al., 2021). As the resolution of the sensors is much greater than that present on the surface (vegetation, crop, soil), the devices measure the grouping of these components as well as their interactions with each other, for example, reflectance and shade between plants and soil. In addition, all of these factors are affected by the atmosphere, for example, by moisture content or radiation, requiring adjustments to the measurements to ensure their accuracy and to obtain plant coverage in isolation.
Estimating soybean LAI using image-capture methods
The highest LAI values obtained using the destructive method were recorded at stage R3 of the soybean, with a subsequent reduction in the following stages (Figure 4). The LAI and FGCC data showed a high positive and significant correlation in all image-capture methods. The correlations were more homogeneous (0.94‒0.95) when considering the points in the vegetative stage, but when considering the vegetative + reproductive stages of soybean, the correlations varied between 0.79 and 0.91 (Figure 5). This result can be considered promising since images captured by smartphones are a low-cost method and an alternative to other assessment methods using visual estimation, destructive methods, or others that require expensive equipment (Büchi et al., 2018; Kim et al., 2022).
The LAI and FGCC showed no correlation when evaluated only at the reproductive stage of soybean. This factor may be related to greater self-shading since a high canopy volume can cause leaf senescence, especially of those close to the ground (Srinivasan et al., 2017). In addition to leaf senescence, shading may have interfered with the images, causing changes according to the position of the smartphone when capturing the images-a fact that does not occur when using the destructive method of analysis.

Evolution of the leaf area index (LAI) of soybeans as a function of the degree day accumulation and growth stage. Crop growing season 2021/2022.
Due to the non-significant correlation between the LAI and FGCC in the reproductive stage, LAI estimates were constructed only for the vegetative and vegetative + reproductive stages. The image capture methods showed a linear response in estimating the LAI, with the exception of T1 considering vegetative + reproductive stages and T4 considering the vegetative stage, which showed quadratic and exponential models, respectively (Figure 5). The generation of non-linear functions can occur due to leaf overlap, mainly at later stages of canopy development (Xiong et al., 2019). In general, LAI estimation in the vegetative stage showed the highest coefficients of determination and lowest RMSE compared to the evaluation throughout the cycle, with T1 and T3 performing best in estimating the LAI. However, considering the entire crop cycle, T4 obtained the highest coefficient of determination and lowest RMSE, indicating that it is the method with the best performance for estimating LAI (Figure 5).
With the exception of T5, the slope coefficients of the linear regressions applied to the vegetative stage were very similar, varying between 3.41 and 3.76, values consistent with those observed in the estimate of the LAI between the V9 and R2 stages, which were estimated at 3.18 and 3.81, respectively, adjusted to the Gaussian model (Figures 4 and 5). Linear regression with a smaller number of parameters makes the estimation less complex, and top-view image capture methods perform better for estimating the LAI during the growing season.
The use of the fisheye lens improved the estimation of LAI in soybean using the downward view capture methods, as indicated by the lower regression complexity and lower RMSE observed in T2 and T3 compared to T1, considering the entire crop cycle (Figure 5). However, considering only the vegetative stage, the response to the use of the fisheye lens in T3 was very similar to T1 (smartphone lens). Fisheye lenses are commonly used for image capture in forestry and offer a practical method for comparing canopy changes in forests (Smith & Ramsay, 2018).

Comparison between Fractional Green Canopy Cover (FGCC) and leaf area index (LAI) values. Dashed line represents regression for vegetative stage, solid line represents regression for entire soybean cycle. Green (●) and red points (●) indicate observations collected during the vegetative (V) and reproductive (R) stages, respectively. “r” indicates Pearson's correlation coefficient (p ≤ 0.05). Treatments: (T1) top view, smartphone camera, height 1 m; (T2) top view, fisheye lens, height 1 m; (T3) top view, fisheye lens, height 0.43 m; (T4) bottom view, smartphone camera; (T5) bottom view, fisheye lens; (T6) video tour of the plot. Crop growing season 2021/2022.
Soybeans showed the highest LAI at stage R3, which was estimated by the Gaussian model at 4.13 (Figure 4). Thus, the adjusted equations in which the linear slope coefficients were closest to this value were for video image captures (T6) and image captures looking upwards with a smartphone lens (T4) (Figure 5). The method of capturing images with an upward view and using a fisheye lens (T5) can overestimate soybean LAI values.
Methods for estimating the LAI are important for assessing various effects on the crop, such as productivity, environmental effects, growth stages, and other biotic and abiotic effects (Kim et al., 2022). Therefore, accurate, fast, and inexpensive methods without the use of sophisticated equipment are important to give agility and confidence to the results. The comparison between leaf disk and digital photography methods for estimating the LAI in soybean has shown a high correlation, with the leaf disk method showing less variation in error (Pierozan & Kawakami, 2013). However, the disadvantage is that the method is based on the destructive evaluation of plants and the need to dry the plants (leaf disk method).
Visual assessments of plant cover show a high positive correlation with images using the Canopeo app to determine vegetation cover (Büchi et al., 2018). Other studies also mention comparisons between more costly methods and digital image analysis for defining LAI. For example, Qu et al. (2021) reported that the use of images captured with a digital camera to estimate LAI in corn showed a correlation (R2) of 0.83 with the LAI obtained using a LAI-2200C instrument (Li-Cor, Inc., Lincoln, NE, USA).
When comparing the use of hemispherical lenses on a smartphone (Samsung Galaxy Grand Prime) with Nikon camera models (Nikon Coolpix 4500 or Nikon Coolpix 990), Bianchi et al. (2017) found good results for determining the canopy’s structural parameters in different tree species. The authors mentioned that the use of smartphones can present acceptable quality and be a faster and cheaper option for evaluation. Another positive result regarding the use of hemispherical lenses in determining the LAI was obtained by Rody et al. (2014), who evaluated hemispherical photographs compared with another canopy analyzer model (LAI-2000 (LI-COR) in eucalyptus cultivation.
The method of capture and the use of lenses attached to the smartphone interfere with the correlations between the FGCC and NDVI and the estimation of soybean LAI. However, the use of digital and analyzed images to generate ground cover is a fast, accurate, non-destructive, and low-cost method of assessing the soybean canopy.
Conclusion
Capturing images via video and a smartphone camera at 1 m from the crop canopy stood out as the most effective methods for estimating the NDVI using FGCC. As for LAI estimation compared to the destructive method, the correlations were higher when the fisheye lens was used for the captures as well as for the photographs taken 1 m from the canopy with a normal smartphone camera. In general, all the photography methods proved to be adequate when the assessments were carried out during the soybean’s growth stages, showing that the use of simpler, low-cost tools can be implemented to quickly obtain biophysical parameters in the field, depending on the purpose of the assessment.
Data availability
The data supporting the findings of this study are subject to privacy and confidentiality restrictions. They may be accessed upon request and with approval from the corresponding author.
References
-
Bianchi, S., Cahalan, C., Hale, S. & Gibbons, J. M.. (2017). Rapid assessment of forest canopy and light regime using smartphone hemispherical photography. Ecology and Evolution, 7(24), 10556-10566. https://doi.org/10.1002/ece3.3567
» https://doi.org/https://doi.org/10.1002/ece3.3567 -
Büchi, L., Wendling, M., Mouly, P. & Charles, R.. (2018). Comparison of visual assessment and digital image analysis for canopy cover estimation. Agronomy Journal, 110(4), 1289-1295. https://doi.org/10.2134/agronj2017.11.0679
» https://doi.org/https://doi.org/10.2134/agronj2017.11.0679 -
Campana, M., Del Valle, T. A., Fernandes, L. S., Pereira, F. R. S., Garcia, T. M., Osório, J. A. C., Facco, F. B. & Morais, J. P. G.. (2023). Canopeo and GreenSeeker applications as tools to support tropical pasture management. Ciência Rural, 53(6), 1-10. https://doi.org/10.1590/0103-8478cr20220167
» https://doi.org/https://doi.org/10.1590/0103-8478cr20220167 -
Carneiro, F. M., Furlani, C. E. A., Zerbato, C., Menezes, P. C., Gírio, L. A. S. & Oliveira, M. F.. (2020). Comparação entre índices de vegetação para detecção de variabilidades espaciais e temporais na cultura da soja utilizando sensores de dossel. Agricultura de Precisão, 21, 979-1007. https://doi.org/10.1007/s11119-019-09704-3
» https://doi.org/https://doi.org/10.1007/s11119-019-09704-3 -
Guo, W., Zheng, B., Duan, T., Fukatsu, T., Chapman, S. & Ninomiya, S.. (2017). EasyPCC: Benchmark datasets and tools for high-throughput measurement of the plant canopy coverage ratio under field conditions. Sensors, 17(4), 1-13. https://doi.org/10.3390/s17040798
» https://doi.org/https://doi.org/10.3390/s17040798 -
He, S., Li, X., Chen, M., Xu, X., Zhang, W., Chi, H., Shao, P., Tang, F., Gong, T., Guo, M., Xu, M., Yang, W. & Liu, W.. (2024). Excellent canopy structure in soybeans can improve their photosynthetic performance and increase yield. Agriculture, 14(10), 1-25. https://doi.org/10.3390/agriculture14101783
» https://doi.org/https://doi.org/10.3390/agriculture14101783 -
Heinonen, R. & Mattila, T. J.. (2021). Smartphone based estimation of green cover depends on the camera used. Agronomy Journal, 113(6), 5597-5601. https://doi.org/10.1002/agj2.20752
» https://doi.org/https://doi.org/10.1002/agj2.20752 -
Kim, J., Yu, J., Rodrogues, R., Kim, Y., Park, J. E., Jung, J., Kang, S., Kim, K., Baek, J., Lee, E & Chung, Y.. (2022). Case study: cost-effective image analysis method to study drought stress of soybean in early vegetative stage. Journal of Crop Science and Biotechnology, 25, 33-37. https://doi.org/10.1007/s12892-021-00110-8
» https://doi.org/https://doi.org/10.1007/s12892-021-00110-8 -
Lykhovyd, P. V., Vozhehova, R. A., Lavrenko, S. O. & Lavrenko, N. M.. (2022). The study on the relationship between normalized difference vegetation index and fractional green canopy cover in five selected crops. The Scientific World Journal, 2022(1), 1-6. https://doi.org/10.1155/2022/8479424
» https://doi.org/https://doi.org/10.1155/2022/8479424 -
Mattos, E. M., Binkley, D., Campoe, O. C., Alvares, C. A. & Stape, J. L.. (2020). Variation in canopy structure, leaf area, light interception and light use efficiency among Eucalyptus clones. Forest Ecology and Management, 463, 118038. https://doi.org/10.1016/j.foreco.2020.118038
» https://doi.org/https://doi.org/10.1016/j.foreco.2020.118038 -
Nakano, H., Tanaka, R., Guan, S. & Ohdan, H.. (2023). Predicting rice grain yield using normalized difference vegetation index from UAV and GreenSeeker. Crop and Environment, 2(2), 59-65. https://doi.org/10.1016/j.crope.2023.03.001
» https://doi.org/https://doi.org/10.1016/j.crope.2023.03.001 -
Patrignani, A. & Ochsner, T. E.. (2015). Canopeo: A powerful new tool for measuring fractional green canopy cover. Agronomy Journal, 107(6), 2312-2320. https://doi.org/10.2134/agronj15.0150
» https://doi.org/https://doi.org/10.2134/agronj15.0150 -
Pierozan Junior, C. & Kawakami, J.. (2013). Efficiency of the leaf disc method for estimating the leaf area index of soybean plants. Acta Scientiarum. Agronomy, 35(4), 487-493. https://doi.org/10.4025/actasciagron.v35i4.16290
» https://doi.org/https://doi.org/10.4025/actasciagron.v35i4.16290 -
Qu, Y., Gao, Z., Shang, J., Liu, J. & Casa, R.. (2021). Simultaneous measurements of corn leaf area index and mean tilt angle from multi-directional sunlit and shaded fractions using downward-looking photography. Computers and Electronics in Agriculture, 180, 105881. https://doi.org/10.1016/j.compag.2020.105881
» https://doi.org/https://doi.org/10.1016/j.compag.2020.105881 -
Rody, Y. P., Ribeiro, A., Pezzopane, J. E. M., Gleriani, J. M., Almeida, A. Q. & Leite, F. P.. (2014). Estimativas do índice de área foliar (IAF) utilizando LAI-2000 e fotos hemisféricas em plantações de eucalipto. Ciência Florestal, 24(4), 925-934. https://doi.org/10.5902/1980509816604
» https://doi.org/https://doi.org/10.5902/1980509816604 -
Schmitz, P. K. & Kandel, H. J.. (2021). Using canopy measurements to predict soybean seed yield. Remote Sensing, 13(16), 1-9. https://doi.org/10.3390/rs13163260
» https://doi.org/https://doi.org/10.3390/rs13163260 -
Shepherd, M. J., Lindsey, L. E. & Lindsey, A. J.. (2018). Soybean canopy cover measured with Canopeo compared with light interception. Agricultural & Environmental Letters, 3(1), 1-3. https://doi.org/10.2134/ael2018.06.0031
» https://doi.org/https://doi.org/10.2134/ael2018.06.0031 -
Smith, A. M. & Ramsay, P. M.. (2018). A comparison of ground-based methods for estimating canopy closure for use in phenology research. Agricultural and Forest Meteorology, 252, 18-26. https://doi.org/10.1016/j.agrformet.2018.01.002
» https://doi.org/https://doi.org/10.1016/j.agrformet.2018.01.002 -
Srinivasan, V., Kumar, P. & Long, S. P.. (2017). Decreasing, not increasing, leaf area index will raise crop yields under global atmospheric change. Global Change Biology, 23(4), 1626-1635. https://doi.org/10.1111/gcb.13526
» https://doi.org/https://doi.org/10.1111/gcb.13526 -
Tenreiro, T. R., García-Vila, M., Gómez, J. A., Jiménez-Berni, J. A. & Fereres, E.. (2021). Using NDVI for the assessment of canopy cover in agricultural crops within modelling research. Computers and Electronics in Agriculture, 182(C), 1-12. https://doi.org/10.1016/j.compag.2021.106038
» https://doi.org/https://doi.org/10.1016/j.compag.2021.106038 -
Tian, J., Liu, X., Zheng, Y., Xu, L., Huang, Q. & Hu, X.. (2024). Improving Otsu method parameters for accurate and efficient in LAI measurement using fisheye lens. Forests, 15(7), 1-17. https://doi.org/10.3390/f15071121
» https://doi.org/https://doi.org/10.3390/f15071121 -
Wang, J., Xiong, Q., Lin, Q. & Huang, H.. (2017). Feasibility of using mobile phone to estimate forest Leaf Area Index: A case study in Yunnan Pine. Remote Sensing Letters, 9(2), 180-188. https://doi.org/10.1080/2150704X.2017.1399470
» https://doi.org/https://doi.org/10.1080/2150704X.2017.1399470 -
Wei, S., Yin, T., Dissegna, M. A., Whittle, A. J., Ow, G. L. F., Yusof, M. L. M., Lauret, N. & Gastellu-Etchegorry, J. (2020). An assessment study of three indirect methods for estimating leaf area density and leaf area index of individual trees. Agricultural and Forest Meteorology, 292-293, 108101. https://doi.org/10.1016/j.agrformet.2020.108101
» https://doi.org/https://doi.org/10.1016/j.agrformet.2020.108101 -
Xiong, Y., West, C. P., Brown, C. P. & Green, P. E.. (2019). Digital image analysis of Old World Bluestem cover to estimate canopy development. Agronomy Journal, 111(3), 1247-1253. https://doi.org/10.2134/agronj2018.08.0502
» https://doi.org/https://doi.org/10.2134/agronj2018.08.0502 -
Yin, G., Yonghua, Q., Verger, A., Li, J., Kun, J., Qiaoyun, X. & Guoxiang, L.. (2022). Smartphone digital photography for fractional vegetation cover estimation. Photogrammetric Engineering & Remote Sensing, 88(5), 303-310. https://doi.org/10.14358/PERS.21-00038R2
» https://doi.org/https://doi.org/10.14358/PERS.21-00038R2
Edited by
-
Associate Editor in charge:
Alessandro Lucca BracciniCarlos Alberto Scapim