Severe cytotoxic edema after CAR-T cell therapy for acute lymphoblastic leukemia
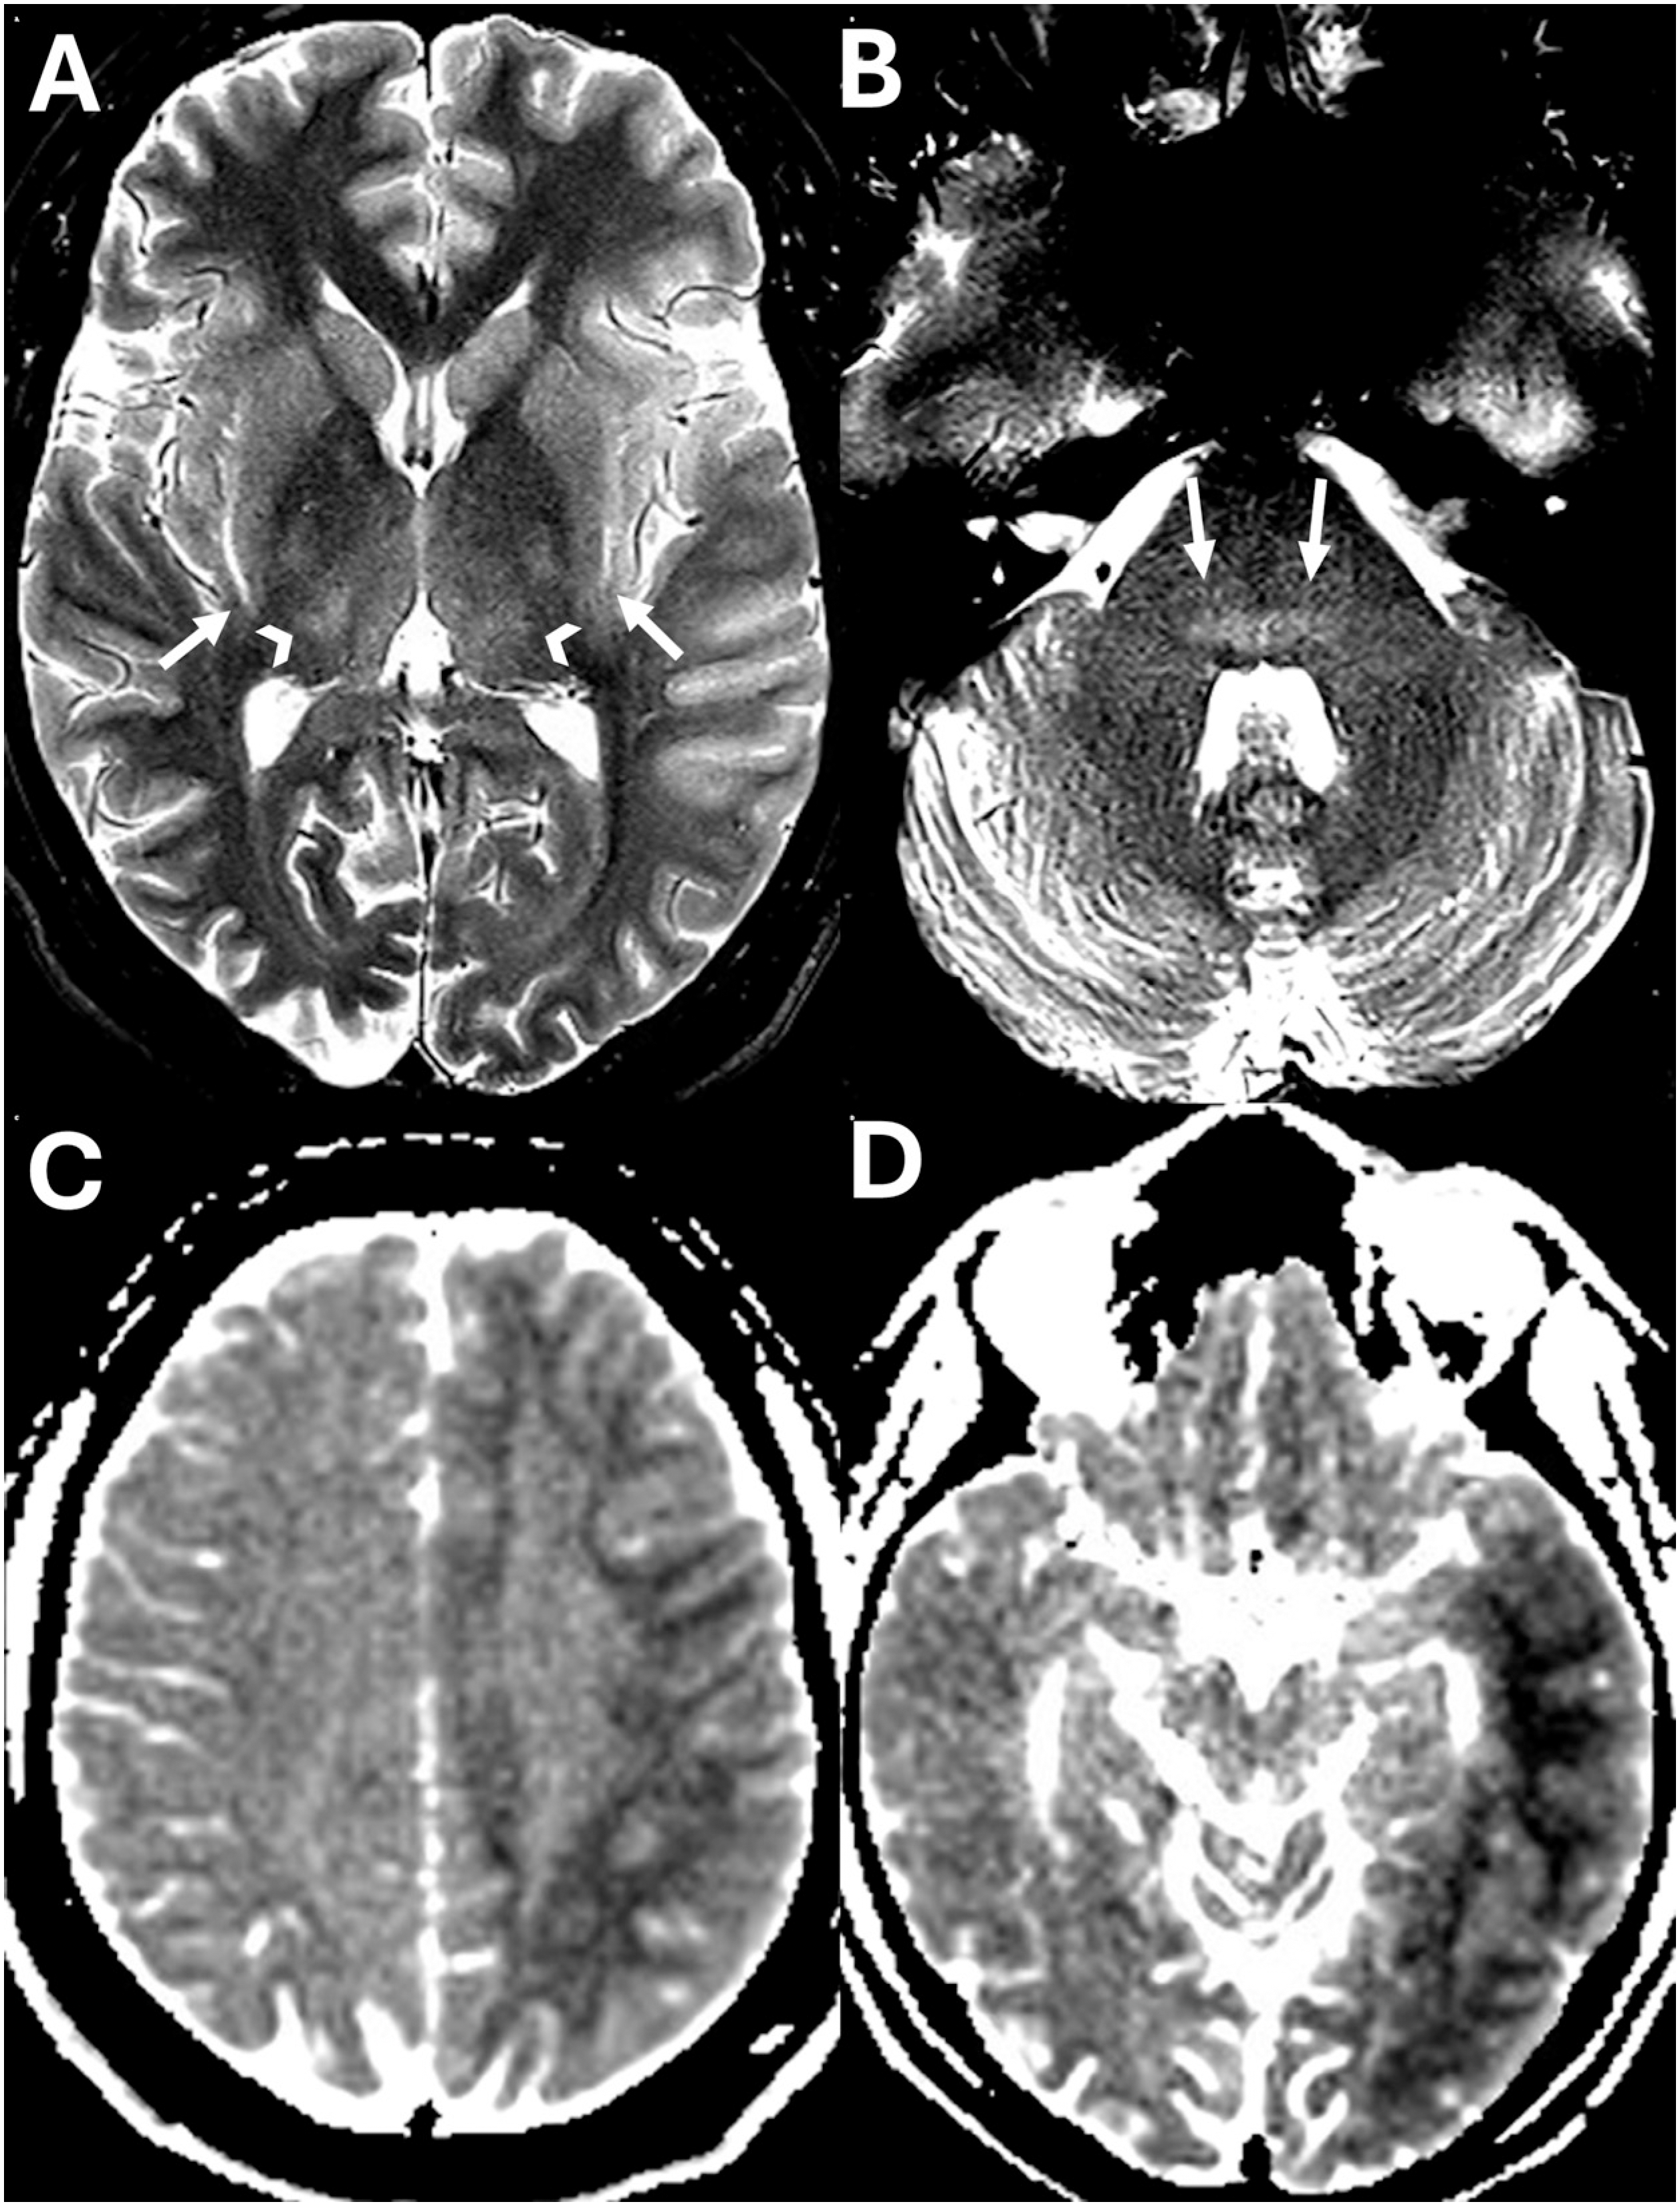
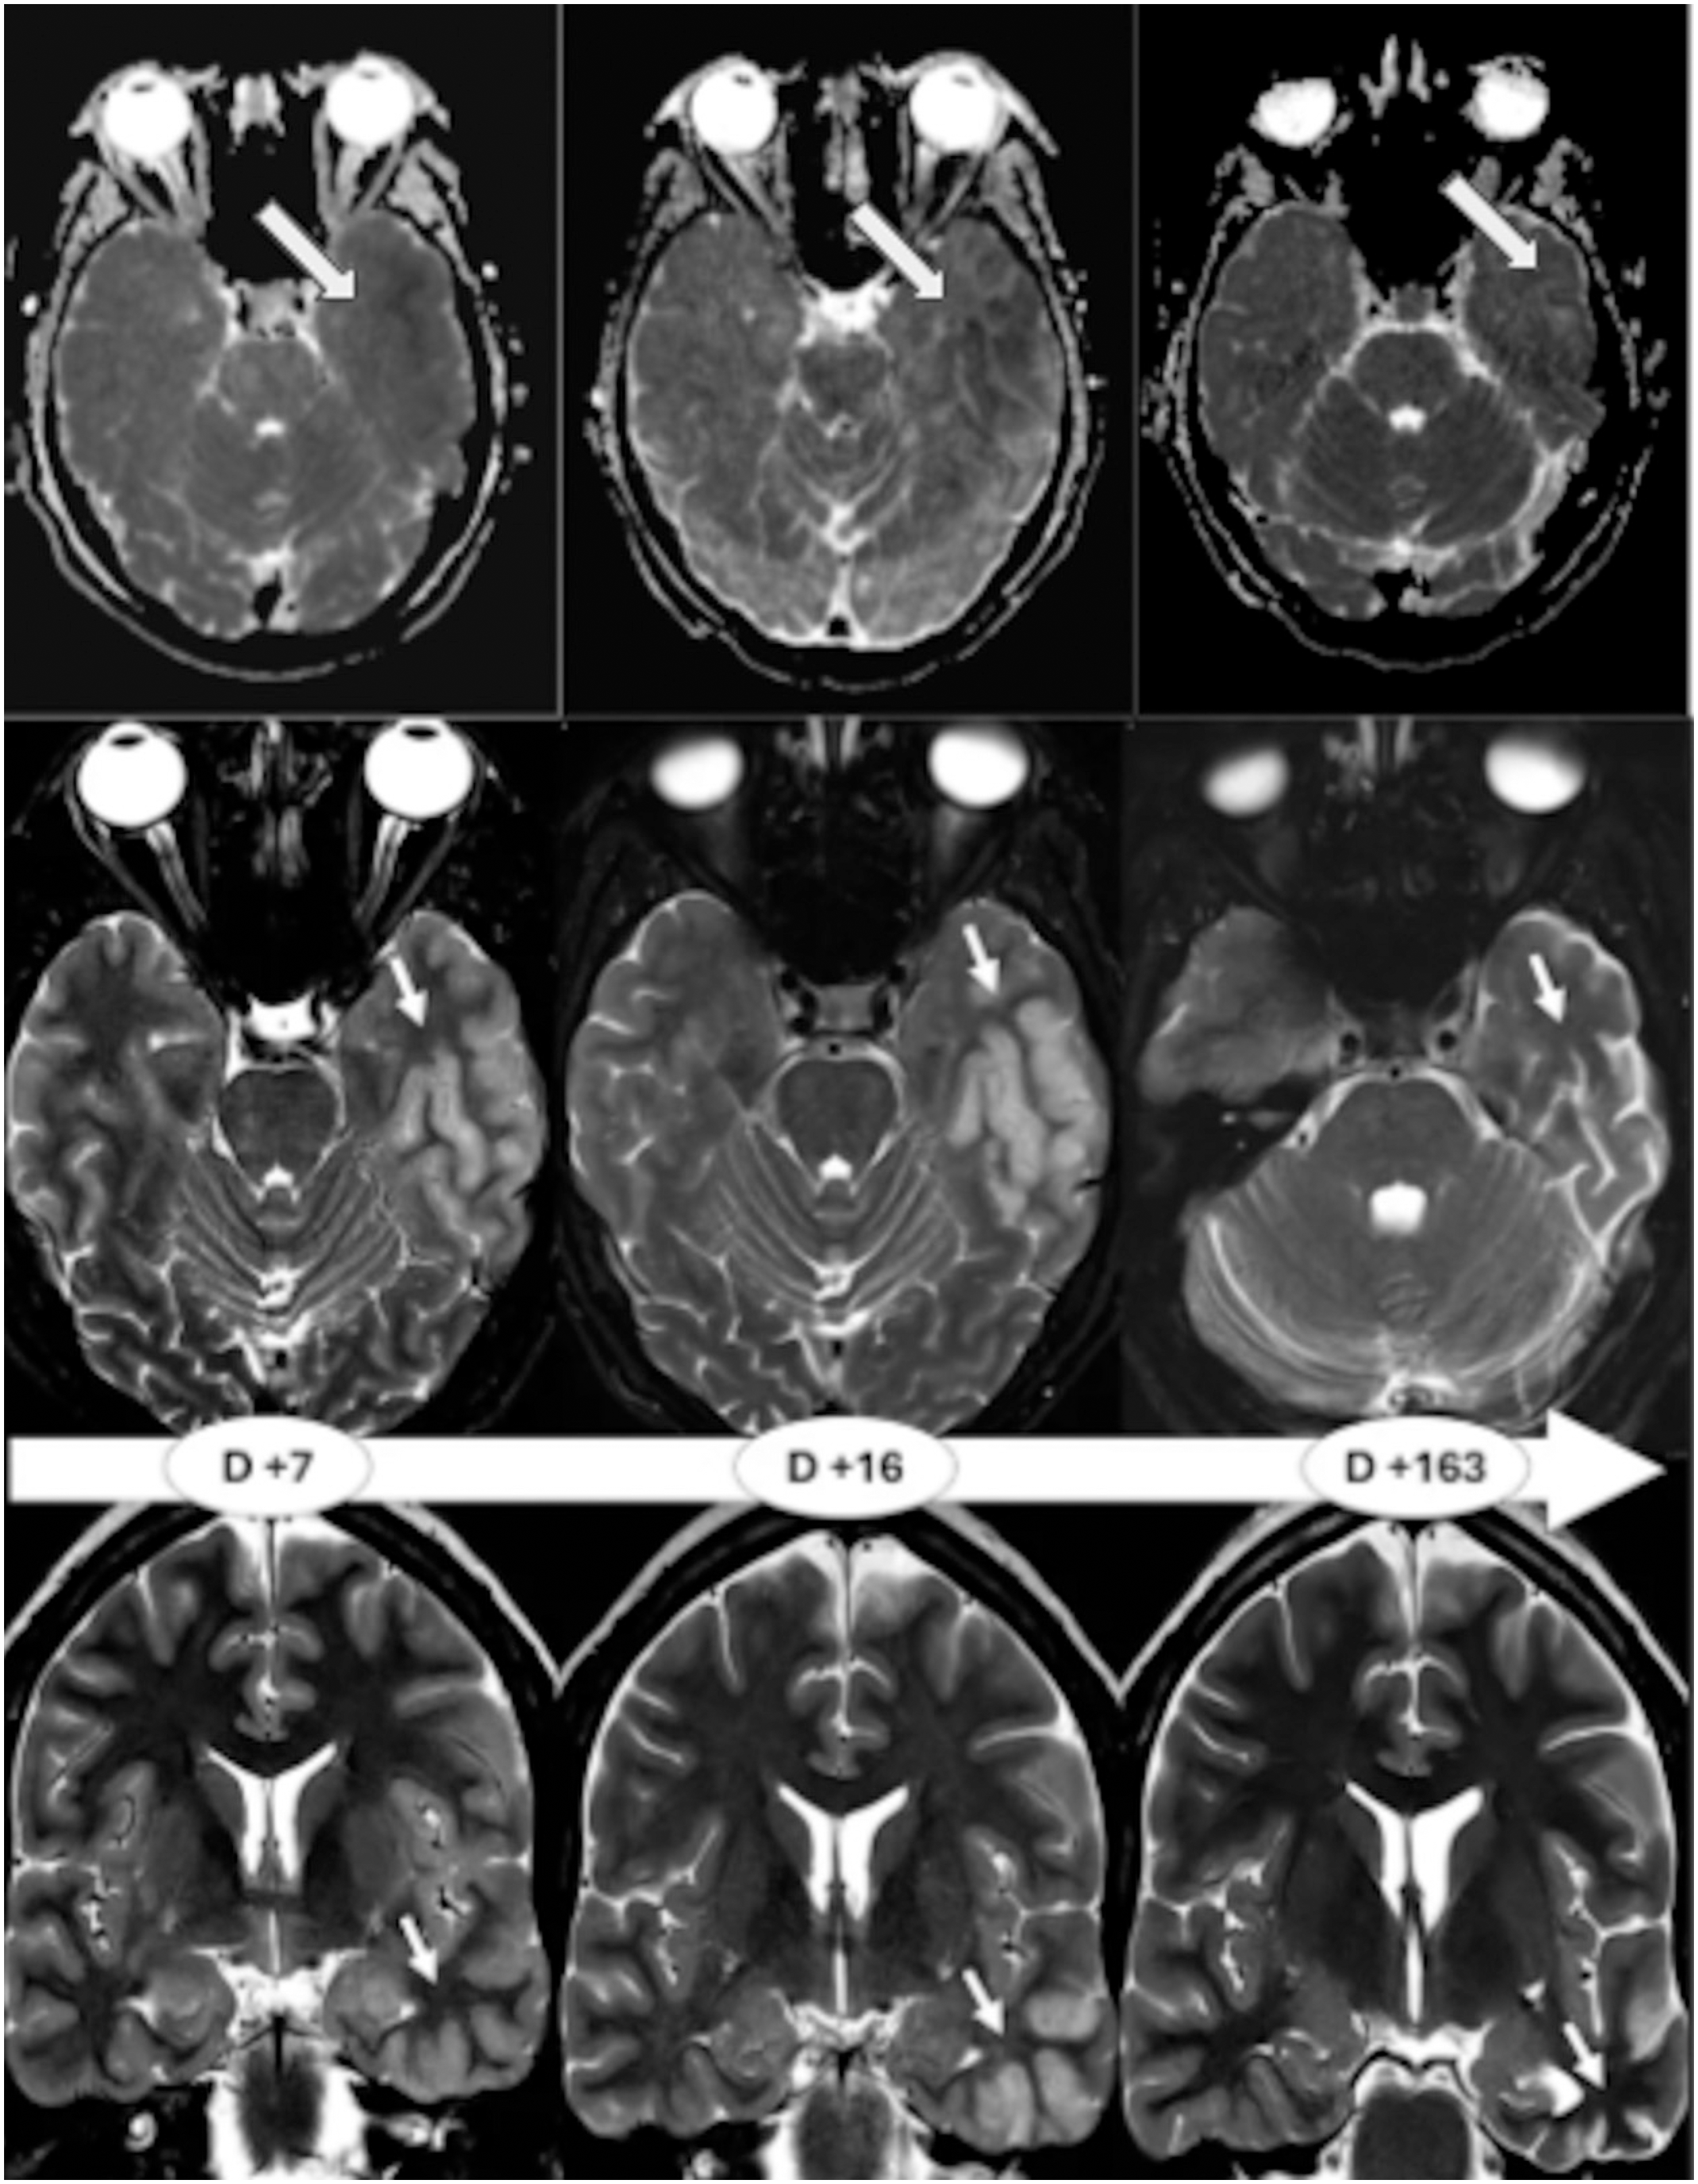
A 23-year-old man with relapsed acute lymphoblastic leukemia underwent CD19 chimeric antigen receptor modified T (CAR-T) cell therapy. He developed grade 1 cytokine release syndrome on day 1 and progressed to grade 4 immune effector cell-associated neurotoxicity syndrome (ICANS) by day 6, presenting with headache, somnolence, right hemiparesis, generalized seizures, and coma. Baseline magnetic resonance imaging (MRI) was normal. Follow-up scans (Figures 1-2) on days 7, 16, and 163 showed severe hemispheric cytotoxic edema and multifocal T2/fluid-attenuated inversion recovery (FLAIR) hyperintensities, gradually resolving after tocilizumab, anakinra, and methylprednisolone. Acute deficits resolved completely, though the patient developed epilepsy, which was controlled with levetiracetam. Consistent with recent literature,1 this case highlights the dynamic evolution of ICANS-related MRI abnormalities after CAR-T therapy.

First T2 images, after immune effector cell-associated neurotoxicity syndrome (ICANS) symptoms developed. (A,B) Show hyperintensities in both thalami (arrowheads), external capsules, predominantly right-sided (arrows in A), and pons tegmentum (arrows in B). Apparent diffusion coefficient (ADC) maps (C,D) demonstrate extensive restricted diffusion, manifested as low signal intensity consistent with cytotoxic edema, predominantly affecting the subcortical white matter of the left hemisphere, with associated cortical involvement. The imaging pattern is not specific for ICANS and should be interpreted in conjunction with the appropriate clinical findings.
Follow-up magnetic resonance imaging (MRI) scans obtained at days 7, 16, and 163 demonstrates evolving cortical hyperintensities (arrows), which increase between days 7 and 16 and subsequently regress, with reexpansion of cortical sulci, parenchymal signal normalization, and residual temporal lobe atrophy. The middle and lower rows correspond to axial and coronal T2-weighted images, respectively. The upper row shows ADC maps demonstrating restricted diffusion, appearing as low signal intensity consistent with cytotoxic edema on days 7 and 16, with resolution of diffusion restriction by day 163, a pattern that may be observed following seizure activity.
-
Funding
The authors declare that they did not receive funding from agencies in the public, private or non-profit sectors to conduct the present study.
-
Ethical Considerations
This study was approved by the Ethics Institution at Hospital Israelita Albert Einstein, number 30173220.5.0000.0071. Patients' signed consent forms were obtained. We confirm that we have read the Journal's position on issues involving ethical publication and affirm that this work is consistent with those guidelines.
Data Availability Statement
Data will be available upon request to the corresponding author.
Acknowledgments
The authors would like to thank Dr. Nelson Hamerschlak, Chief of Hematology at Einstein Hospital Israelita for his leadership in the hematologic management and CAR-T program oversight. We also thank Dr. Roberto Naun FrancoMorgulis, Neurologist at Einstein Hospital Israelita, for his clinical expertise in the neurological evaluation and follow-up of the patient included in this study.
Reference
-
1 Vichare A, Lee JS, Duong TQ. Neuroimaging Findings of CAR T-Cell-Associated Neurotoxicity: A Review. Neurol Clin Pract 2025;15(04):e200488. Doi: 10.1212/CPJ.0000000000200488
» https://doi.org/10.1212/CPJ.0000000000200488
Edited by
-
Editor-in-Chief:
Ayrton Roberto Massaro.https://orcid.org/0000-0002-0487-5299
-
Associate Editor:
Leandro Tavares Lucato.https://orcid.org/0000-0001-9181-5245