Agricultural water footprint and sustainability in Cerrado and Cerrado-Amazon irrigation hubs, Brazil
Abstract
Brazil's agricultural sector consumes substantial freshwater resources, particularly in Mato Grosso state, which hosts one of the nation's largest irrigation complexes within the Cerrado and Amazon biomes. Given the finite nature of these resources and their intensive agricultural use, quantifying water consumption patterns can inform policy development for sustainable resource management. This study estimated the water footprint of rainfed soybeans, off-season corn, and winter beans across the Cerrado biome and Cerrado-Amazon transition zone in Mato Grosso state. Green and blue water footprints were determined through crop evapotranspiration calculations to assess water demand, whereas gray water footprint estimation incorporated nitrogen fertilizer application rates and soil leaching parameters. Results showed average water footprints in the Cerrado region of 1,486 m³ ton⁻¹ for soybeans, 1,016 m³ ton⁻¹ for corn, and 2,084 m³ ton⁻¹ for beans. The Cerrado-Amazon transition zone exhibited values of 1,476 m³ ton⁻¹ for soybeans, 1,052 m³ ton⁻¹ for corn, and 1,898 m³ ton⁻¹ for beans. These water footprint indicators reveal patterns of water appropriation in crop cultivation, providing quantitative metrics for evaluating agricultural water use sustainability.
Keywords:
environmental indicators; evapotranspiration; sustainability
Resumo
O setor agrícola do Brasil consome consideráveis recursos de água doce, particularmente no estado de Mato Grosso, que abriga um dos maiores complexos de irrigação do país, localizado nos biomas Cerrado e Amazônia. Dada a natureza finita desses recursos e seu uso intensivo na agricultura, a quantificação dos padrões de consumo de água pode subsidiar o desenvolvimento de políticas para a gestão sustentável dos recursos. Este estudo teve como objetivo estimar a pegada hídrica da soja de sequeiro, do milho safrinha e do feijão de inverno ao longo do bioma Cerrado e da zona de transição Cerrado-Amazônia no estado de Mato Grosso. As pegadas hídricas verde e azul foram determinadas por meio de cálculos de evapotranspiração das culturas para avaliar a demanda hídrica, enquanto a estimativa da pegada hídrica cinza incorporou taxas de aplicação de fertilizantes nitrogenados e parâmetros de lixiviação do solo. Os resultados mostraram pegadas hídricas médias na região do Cerrado de 1.486 m³ ton⁻¹ para a soja, 1.016 m³ ton⁻¹ para o milho e 2.084 m³ ton⁻¹ para o feijão. A zona de transição Cerrado-Amazônia apresentou valores de 1.476 m³ ton⁻¹ para a soja, 1.052 m³ ton⁻¹ para o milho e 1.898 m³ ton⁻¹ para o feijão. Esses indicadores de pegada hídrica revelam padrões de apropriação da água no cultivo agrícola, fornecendo métricas quantitativas para avaliar a sustentabilidade do uso da água na agricultura.
Palavras-chave:
evapotranspiração; indicadores ambientais; sustentabilidade
1. INTRODUCTION
According to the United Nations World Water Development Report 2024 (UNESCO, 2024), agriculture is responsible for approximately 70% of global freshwater withdrawals, followed by the industrial and public water supply sectors. In the river basins of the state of Mato Grosso, a similar pattern is observed, as the state is recognized nationally as a major producer of agricultural commodities. According to the Brazilian Institute of Geography and Statistics (IBGE, 2024), Mato Grosso is among the leading Brazilian states in the production of soybeans, corn, and cotton, and possesses a cattle herd of approximately 33 million head.
In Mato Grosso, the agricultural calendar is highly dynamic and strongly dependent on water availability. In much of the state, soybean cultivation commences between October and November, during the spring, and is succeeded, after harvest, by the planting of off-season corn in January and February or by cotton cultivation. Additionally, during the winter period, characterized by dry conditions, irrigated bean cultivation is commonly practiced. Although most of the cultivated area remains under rainfed conditions, this scenario may change in the coming years due to observed shifts in the climate regime and the trend toward the expansion of irrigated agriculture.
Commar et al. (2024), based on analyses of historical series over the past four decades, demonstrated a concerning trend of declining rainfall volumes, delayed onset of the rainy season, and a shortening of the rainy period throughout nearly the entire state of Mato Grosso. According to the authors, climate modeling suggests that these trends are likely to intensify as a consequence of deforestation and global climate change. Among the principal projected impacts is a substantial reduction in the probability of an early onset of the rainy season (i.e., before September 30), with a greater concentration of rainy season onset in late October in several regions. Furthermore, projections indicate that by mid-century, the duration of the rainy season will be less than 200 days across much of the state, with a probability greater than 80% in critical areas such as Sorriso and Primavera do Leste.
In Brazil, Federal Law No. 12,787, enacted on January 11, 2013 (BRASIL, 2013), established the National Irrigation Policy, whose objectives include promoting the expansion of irrigated areas and increasing agricultural productivity in an environmentally sustainable manner. The instruments provided by this policy comprise irrigation plans and projects, tax incentives, rural credit, and rural insurance, among other mechanisms supporting sectoral development. Within this context, strategic irrigation hubs were established in the country, among which the Alto Rio das Mortes and Alto Teles Pires hubs, located in the state of Mato Grosso, are nationally significant. According to the National Water Resources Information System (ANA, 2023), these regions have estimated central pivot irrigated areas of 44,810 ha and 62,848 ha, respectively.
Given this scenario of high demand for water resources and increasing climate risk, expanding knowledge regarding the water requirements for grain production in irrigation hubs, prevailing water use patterns in these areas, and the effects of agricultural management on the volume of water demanded by production systems becomes essential. In this context, the water footprint emerges as a strategic approach, as it enables the quantification of water consumed and appropriated in agricultural production, as well as an understanding of the relationship between production systems and the pressure exerted on local water resources.
The water footprint (WF) has been established as a significant environmental indicator because it allows for the quantification of the volume of freshwater utilized throughout the entire production chain, distinguishing among green water (derived from precipitation), blue water (originating from surface and groundwater sources), and gray water (the volume required to dilute the pollutant load generated during production). As highlighted by Hoekstra and Hung (2002), this classification is based on the fact that the total volume of water used in the production of a good has different origins and functions within the production system. In the case of grain production, Hoekstra et al. (2011) emphasizes that the water footprint constitutes a fundamental measure of the volume of water used, providing an essential informational basis for assessing the sustainability of water consumption and the environmental impacts associated with production.
According to Mizyed et al. (2024), the water footprint is an internationally recognized sustainability indicator of major relevance for the sustainable management of water resources, particularly in the agricultural sector. The authors assert that its quantification enables the assessment of the sustainability of agricultural activities under different management regimes and production contexts, providing technical support for the formulation of public policies and management strategies aimed at ensuring the long-term conservation of water resources. Moreover, the water footprint allows for the estimation of the effective water cost of production at a given location, rendering it an important tool for analyzing water use efficiency in agriculture.
The bibliometric analysis conducted by Dimas et al. (2025) underscores the strong relationship between the water footprint and the Sustainable Development Goals (SDGs), particularly SDG 6 (clean water and sanitation) and SDG 12 (responsible consumption and production). According to the authors, the application of the water footprint methodology enables the identification of consumption and production patterns that exert greater pressure on freshwater availability and, therefore, constitutes a relevant tool for promoting water sustainability.
Furthermore, the results of this bibliometric analysis indicated that countries such as China, the United States, and Italy lead scientific production on the water footprint. This context highlights the need to advance research in Brazil, particularly regarding the quantification of the water footprint in agricultural production. Despite the importance of this topic for planning and the sustainable management of water resources, considerable progress remains to be made in Brazil, both in terms of expanding applied studies and developing and refining methodologies suited to national production conditions.
Assessing the water footprint in the Alto Rio das Mortes and Alto Teles Pires irrigation hubs is relevant not only for quantifying the intensity of water use in agricultural production, but also for identifying potential risks to water sustainability, supporting public policies, guiding actions aimed at rational water use, and contributing to the harmonization of agricultural expansion, water security, and environmental conservation.
According to Mizyed et al. (2024), the water footprint has traditionally been assessed at national and global scales. However, the authors emphasize the importance of applying this methodology at subnational and urban scales, as these levels better reflect local consumption dynamics, territorial inequalities, and the specificities of each region’s water infrastructure. From this perspective, local-scale studies can support the refinement of parameterizations employed in broader spatial assessments, thereby contributing to more robust and less inconsistent national and global estimates.
Considering the importance of water use for agricultural production in Brazil, this study calculated the water footprint of soybean, off-season corn, and winter bean crops produced in irrigation hubs located in the Cerrado biome and the Cerrado-Amazon transition zone in the state of Mato Grosso, Brazil.
2. MATERIAL AND METHODS
The study was conducted in the areas of the Upper Rio Teles Pires and Rio das Mortes irrigation poles, characterized by the Cerrado biomes and the transition area of the Cerrado-Amazon biomes in the state of Mato Grosso, respectively (Figure 1).

Upper Rio Teles Pires and Rio das Mortes irrigation complexes, located in the state of Mato Grosso, Brazil according to the National Water and Sanitation Agency (ANA, 2020).
The Upper Rio Teles Pires irrigation complex contains 10 municipalities, with Sorriso having the greatest economic importance. According to Mapbiomas (2020), Sorriso has an area designated for soybean cultivation with 558,847 ha and 45,670 ha of other temporary crops that include maize and beans. The Rio das Mortes irrigation hub has seven municipalities, especially Primavera do Leste, which has 279,328 ha of soybeans and 37,460 ha of other temporary crops.
According to the PAM-Municipal Agricultural Survey, the municipality of Sorriso has the highest agricultural GDP in the country, which gives Mato Grosso a position of national prominence. Soybean and corn crops produced in the municipality of Sorriso totaled R$ 3.9 billion in 2019.
According to the Köppen climate classification, the climate of the study region is defined as AW (tropical savannah). For this type of climate, drought occurs during the winter season, and rain occurs in the summer season.
2.1. Hydrometeorological Data
The meteorological data regarding the minimum and maximum temperature (°C), relative humidity (%) and wind speed (m/s) of the study areas were obtained from stations of the National Institute of Meteorology (INMET), while the rainfall data were obtained from the Hydroweb portal, which belongs to the National Hydrometeorological Network of the National Agency for Water and Basic Sanitation (ANA, 2021).
Data from automatic stations located in the cities of Primavera do Leste and Sorriso were used; however, the meteorological station for Primavera do Leste had a historical series of only two years of data, which is why data was taken from the Santo Antônio do East, as shown in Table 1.
2.2. Soil and Crop Data
Table 2 presents the parameters and values used to calculate the crop water demand. The soil of the study area is characterized by medium texture oxisols. The crop management adopted in this study was no-tillage, which is a conservation technique where sowing is performed directly in the soil without turning it over and covered with straw from the previous crop.
Albuquerque and Coelho (2021) define the technical coefficients as the relationship between crop evapotranspiration (ETc) and reference evapotranspiration (ETo). The initial, average and final Kc of the cultures were altered according to each phenological stage. The distribution of days for each phase was estimated according to the coefficient curve for annual crops proposed by Allen (1998) by using the coefficients from the FAO guide 56 proposed by Allen et al. (2006).
The yield and planting and harvest dates of the soybean and corn crops were obtained from the weekly grain bulletins published by the Mato Grosso Institute of Agricultural Economics (IMEA), while the data for the common bean crop were obtained from historical series published by the National Supply Company (CONAB).
The IMEA divided the state of Mato Grosso into seven economic poles, Sorriso in the middle north and Primavera do Leste in the southeast. Based on this regional separation, the institute publishes weekly bulletins on agriculture and livestock in the state. The information from the bulletins helped to estimate the productivity of the water footprint calculation, dividing the amount of planted area in hectares by the productivity in tons of the region.
To estimate common bean yield, CONAB informs the yield of crops in historical series starting with the 1987/1988 harvest. However, the information contained in its reports is divided by state limits, with its total production in tons, area in hectares and productivity. Thus, the average productivity of the common bean crop for Sorriso and Primavera do Leste was the same (Figure 2).

Soybean, corn and common bean yields per crop hectare in the state of Mato Grosso used in the calculation of the water footprint.
2.3. Calculation of the Water Footprint
The water footprint was calculated using the parameters of productivity and crop water demand. According to Hoekstra et al. (2011), the green water footprint represents the precipitated water that was evapotranspired from the plant and soil. The green water footprint was calculated from the Equation 1:
Where: PH green: Green water footprint, in m3 ton-1; DHC green: Green water demand, in m3 ha-1; and Prtv: Crop yield, in ton-1 ha-1.
The blue water footprint, defined as the volume of surface and groundwater consumed during irrigation processes, was quantified in accordance with Equation 2.
Where: PH blue: Blue water footprint, in m3 ton-1; and DHC blue: Blue water demand, in m3 ha-1.
As defined by Hoekstra et al. (2011), the crop water demand (CHD) refers to the total plant evapotranspiration throughout its cycle and was calculated using the computer program CROPWAT 8.0. From the data entered in the program, it was possible to calculate the reference evapotranspiration by the Penman Monteith method in mm month-1 and the adjusted evapotranspiration and the effective precipitation in mm day-1.
Based on the adjusted evapotranspiration of the crop, CROPWAT 8.0 (FAO, 2023) estimated the daily deficits and irrigation depth for a season, as it was possible to identify the daily depth and total green and blue evapotranspiration based on the criteria described in Equations 3 and 4.
Where: ET blue: Blue evapotranspiration, in mm; min: Minimum value between the TIL and DRI variables, in mm; TIL: Total net irrigation, in mm; and DRI: Actual irrigation demand that is equal to the total net irrigation plus soil moisture on the day of harvest, in mm.
Where: ET green: Green evapotranspiration, in mm; and ET aj: Adjusted evapotranspiration, in mm.
Blue evapotranspiration is the minimum value between the total net irrigation and the actual irrigation demand (mm) (Hoekstra et al., 2011). Green evapotranspiration corresponds to total adjusted evapotranspiration minus blue ET. The resulting value is reported in millimeters (mm), but the water footprint calculation equation requires the DHC value to be in m3 ha-1; thus, it was necessary to perform the conversion of units according to Equation 5.
Where: DHC green or blue: Green or blue water demand, in m³ ha-1; Pdc: Period of crop development, in days; d: Days after planting, dimensionless; ET green or blue: Green or blue evapotranspiration, in mm; and 10: Conversion factor, dimensionless.
The gray water footprint was calculated from the nitrogen load. In agriculture, gray water arises due to the load of nutrients from fertilizers that are applied to crops. The calculation of the gray water footprint uses the variable of the fraction of the chemical that leaches into the soil multiplied by the rate of application of the chemical on the crop, which will represent the organic load.
Studies such as those by Rodriguez et al. (2015), Zhang et al. (2018), Scarpare et al. (2016) and Silva et al. (2020) calculated the gray water footprint for various crops based on nitrogen. In this study, nitrogen was used as the chemical substance to calculate the gray water footprint, as shown in Equation 6.
Where: PH gray: Gray water footprint, in m3 ton-1; A: Nitrogen leaching fraction equal to 10%; TAQ: Nitrogen application rate, in kg ha-1; Cmax: Maximum allowed concentration of nitrogen in class rivers 2 mg L-1 and then converted to kg m-3; and Cnat: Natural water body nitrogen concentration equal to 0 mg L-1.
According to Hoekstra et al. (2011), it is assumed that the fraction of nitrogen leached into water bodies corresponds to 10% of the value of the application rate of fertilizers in the field. The maximum acceptable concentration is defined by CONAMA Resolution no. 357/2005 (CONAMA, 2005), and the natural concentration in the river is the amount of nitrogen that occurs naturally in water bodies.
3. RESULTS AND DISCUSSION
3.1. Green, Blue, and Gray Water Footprints
Table 3 shows the green, blue, and gray water footprints for soybean, corn, and beans from the 2015/2016 to 2020/2021 harvests. These data characterize the water footprint dynamics of each crop in Mato Grosso’s Cerrado and Cerrado-Amazon transition areas. The water footprint values of the different crops were presented for descriptive purposes within the production systems evaluated. However, direct comparisons among crops should be interpreted with caution, since each crop has distinct agronomic, physiological, and management characteristics.
Green, blue and gray water footprints, in m3 ton-1, during crop seasons of crops produced in the Cerrado and Cerrado-Amazon transition biomes in the state of Mato Grosso, Brazil.
An increase in the green water footprint usually reduces irrigation needs, thereby lowering the blue water footprint. Fluctuations in productivity mainly cause differences in water footprint values among harvests. Sediyama et al. (2015) and Galvão et al. (2017) state that changes in productivity result from alterations in the crop environment.
For example, the 2015/2016 harvest exhibited elevated green, blue, and gray water footprint values. During this period, according to the Secretary of State for the Environment, Economic Development, Production and Family Agriculture (MS, 2015), an extreme drought resulted in delays in planting and reduced productivity. These findings align with productivity data obtained from IMEA and CONAB, which were utilized in the water footprint estimations of this study.
High blue and gray water footprint values were also observed in 2020/2021 for maize (Table 3), reinforcing the importance of climatic conditions in determining water consumption. In particular, Globo Rural magazine (Reuters, 2021) reported that the 2020 drought was severe enough to require soybean replanting at the beginning of the 2020/2021 season. This delay in soybean planting, in turn, affected the sowing calendar of off-season corn and winter beans. As a result, the water footprint values of these crops are directly influenced by the timing of the soybean cycle.
Lower green, blue, and gray water footprint values mean higher grain yield, as lower values (m3 ton-1) reflect greater productivity. Unusual weather that affects crop performance can also change the water footprint of grains.
3.2. Percentage of Blue, Gray, and Green Water
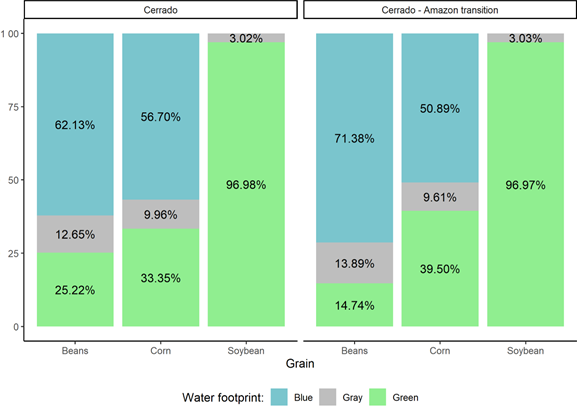
Figure 3 shows the percentage of green, blue, and gray water footprints. For soybeans, green water makes up most of the footprint because the crop grows under rainfed conditions throughout. If irrigation were needed, the proportion of green water would decrease.
Percentage (%) of water footprint in one ton of rainfed soybean, off-season corn and winter beans in the state of Mato Grosso, Brazil.
For maize, the blue water footprint made up a large share of the total. The green water footprint remained important, while the gray water footprint made up a smaller share (Figure 3).
For the common bean, the percentage distribution shows the crop's production conditions. During the dry season, irrigation is essential because precipitation adds little to the water supply. Thus, the green water component accounts for a smaller share of the total water footprint. The gray water footprint remains considerable due to fertilization rates used in the calculations (Figure 3).
Costa et al. (2021) estimated the water footprint of soybean, corn, and cotton in an agricultural hub in western Bahia. For soybeans, the authors found that the green water footprint was the main component, accounting for 77.7% of the total value. For maize, the percentage of green water footprint was 75.7%. These values differ from those obtained in the present study, which reflects the specific climatic and management conditions of the study region.
In the Cerrado and Cerrado-Amazon transition, corn follows soybeans as rainfall declines. Beans are planted on the day of the maize harvest and grow during the dry season. Because harvest is in September and October, at the start of the rains, the green water used in bean production is low.
3.3. Average Green, Blue, and Gray Water Footprints
Figure 4 shows the average green, blue, and gray water footprints over six harvests.

Average green, blue and gray water footprints of rainfed soybean, off-season corn and winter beans in the state of Mato Grosso-Brazil, considering the 2015 to 2021 harvests.
In the study areas, average water footprint values matched local climate, cropping schedules, fertilization rates, and crop productivity. For beans, the gray water footprint depended on nitrogen fertilizer rates and productivity. Soybeans’ gray water value reflected their low nitrogen use. Similar soybean productivity across both regions resulted in comparable graywater footprints.
The results related to the blue water footprint of soybeans were expected because, according to the planting and harvesting schedules of IMEA and CONAB, the crop is grown during the rainy season under rainfed conditions.
Dias et al. (2020), however, estimated the blue water footprint of irrigated soybean and obtained values of 1,471 m3 ton-1 in Primavera do Leste and 1,110 m3 ton-1 in Sorriso. These results differ from those of the present study, which considered soybeans cultivated under rainfed conditions. According to Sediyama et al. (2015), soybeans should be irrigated when planted in September, whereas crops established at the beginning of the rainy season may not require irrigation.
According to IMEA planting and harvesting reports, September planting accounts for a very small share of the cultivated area, as rainfall remains insufficient to meet crop water demand. Thus, planting generally occurs at the end of October and the beginning of November, when rainfall is more regular.
Producers who have irrigation equipment may still irrigate soybeans when necessary, even under predominantly rainfed conditions. According to Pertussatti (2013), during the rainy season, there may be a few consecutive days with rainfall below 10 mm, known as summer dry spells. However, irrigation is more commonly used during the third bean crop, when center pivot systems are adopted because cultivation occurs during the dry season.
The water footprint of grains depends heavily on a changing climate, which drives fluctuations in productivity. Without climate variation, water footprints would stay more stable, but even small climate shifts can have a big effect.
The gray water footprint is calculated from parameters different from those used for the green and blue water footprints. The equation accounts for the maximum permitted concentration, the natural concentration of pollutants in water bodies, the fertilizer application rate, and the fraction of pollutants that leach. In the case of beans, the gray water footprint was influenced by the nitrogen fertilizer application rate of 60 kg ha-1 and productivity of approximately 2 t ha-1. In corn, the same nitrogen application rate was adopted, but productivity affected the resulting gray water footprint. In soybeans, the lower gray water footprint was associated with the low nitrogen application rate (15 kg ha-1) used in the study. According to Souza and Lobato (2004), most producers in the region do not use nitrogen fertilizer in soybeans because inoculation practices promote biological nitrogen fixation.
3.4. Water Footprint
Table 4 presents the total water footprint, calculated as the sum of the green, blue, and gray components.
Water footprint, in m3 t-1, of rainfed soybean, off-season corn and winter beans in the Cerrado and Transition Cerrado-Amazon biomes of the state of Mato Grosso, Brazil.
The total water footprint depends on production conditions like cropping season, fertilizer use, irrigation, and yield. For common bean dry-season production, nitrogen fertilization, and chosen productivity, the estimate was shaped. Soybeans’ total footprint was driven by a lack of irrigation and low nitrogen use. For corn, the total footprint reflected yields during the study (Table 4).
The results indicate that higher productivity values, as estimated by CONAB and IMEA, are associated with lower water footprint values, signifying greater water use efficiency per unit of grain produced. Thus, the water footprint is strongly influenced by productivity and by the volume of water required under each production condition.
Soybean water footprints for Cerrado (1,486 m3/ton) and Cerrado-Amazon transition (1,476 m3/ton) were lower than Brazil’s estimate of 2,244 m3/ton by Hoekstra and Hung (2002), who used broad climate data.
Mekonnen and Hoekstra (2011) calculated a global mean water footprint of 2,145 m3 ton-1 for soybeans, which is higher than the values obtained in this study. This difference may be related to the fact that national or global estimates often do not fully capture local climatic and management conditions.
Silva et al. (2020) quantified the water footprint of soybean in the MATOPIBA region using FAO AquaCrop, reporting values ranging from 2,000 to 2,500 m3 ton-1. These values differ from those obtained here because the climatic conditions in MATOPIBA may require irrigation. In Mato Grosso, soybeans are cultivated under rainfed conditions during the rainy season.
Bleninger and Kotsuoka (2015), using CROPWAT, estimated a total water footprint of 2,210 m3 ton-1 for soybean in Maringá, Paraná. This higher estimate was mainly related to the gray component, since the nitrogen application rate considered by those authors was 50 kg ha-1. This result reinforces the importance of adopting local fertilization practices in water footprint estimates.
Mekonnen and Hoekstra (2011) estimated a global mean water footprint for maize of 1,222 m3 ton-1, considering green, blue, and gray components. The values obtained in the present study are of similar magnitude, especially in the Cerrado biome. Mekonnen and Hoekstra (2014) also estimated a global average water footprint of 1,028 m3 ton-1 for maize, considering green and blue components, which is also close to the present results.
Hoekstra et al. (2002) estimated a water footprint of 5,846 m3 ton-1 for common bean based on yields of 0.7 ton ha-1. This value is higher than those reported in this study, where the productivity adopted for the Cerrado and Cerrado-Amazon transition in Mato Grosso was approximately 2 t ha-1. This demonstrates the strong influence of yield on water footprint values.
In Mexico, Lopez and Capetillo (2015) calculated blue and green water footprints for beans and obtained totals of 2,745, 2,668, and 1,838 m3 ton-1 depending on the harvest. These values are similar to those estimated here, although the Mexican estimates did not include the gray water footprint.
Despite the substantial water requirements of grain production, these crops are essential for food security. Corn and soybeans are used in a wide range of products, while beans, according to Borém et al. (2015), are a major source of protein for the Brazilian population. Soybeans are also of exceptional importance to the economy due to their export relevance, which gives the state of Mato Grosso national prominence.
Because the cropping season and climate vary by region, water footprint estimates should always be calculated locally. Climate change is also a relevant factor, since it may increase crop water demand, reduce productivity, and even make some species unsuitable for cultivation in regions where agriculture plays a major economic role.
Climate change contributes to atypical events, such as intense rainfall and severe droughts, affecting water availability and field crop management. In this sense, the water footprint indicator should be used together with water resources policy and integrated with climate change policy.
The water footprint is a crucial indicator for water resource management because it broadens responsibilities and knowledge regarding water appropriation among both producers and consumers. It provides a basis for water sustainability analyses by identifying conflict points and helping to avoid environmental impacts, such as water scarcity.
4. CONCLUSIONS
In the Cerrado area of the state of Mato Grosso, the average water footprint was 1,486 m3 ton-1 for soybeans, 1,016 m3 ton-1 for corn, and 2,084 m3 ton-1 for beans. In the Cerrado-Amazon transition region, the averages were 1,476 m3 ton-1 for soybean, 1,052 m3 ton-1 for corn, and 1,898 m3 ton-1 for beans.
The study region provides suitable soil and climate conditions for soybean cultivation under rainfed conditions, as its cycle coincides with rainfall. For common bean, the estimates reflected cultivation during the dry season, when irrigation is required throughout the cycle, and water availability may be more vulnerable to drought. The results reinforce the importance of local water footprint estimation, since climatic conditions, agricultural calendar, irrigation requirement, fertilization practices, and productivity directly affect the final values.
5. DATA AVAILABILITY STATEMENT
Data availability not informed.
6. REFERENCES
- ALBUQUERQUE, P.; COELHO, E. Planilha para Obtenção de Coeficiente de Cultura para Culturas de Ciclo Anual Segundo Método FAO, para as Condições Climáticas Brasileiras. Sete Lagoas: EMBRAPA, 2021. 17 p.
- ALLEN, R. G.; PEREIRA, L. S.; RAES, D.; SMITH, M. Evapotranspiración del cultivo: Guías para la Determinación de los Requerimientos de Água de los Cultivos. Roma: FAO, 2006. 323 p.
- ALLEN, R. G. et al Crop evapotranspiration: guidelines for computing crop requirements. Roma: FAO, 1998. 328p. (Irrigation and drainage paper, 56).
- ANA (Brasil). Polos Nacionais de Agricultura Irrigada. Brasília, 2020. 46 p.
- ANA (Brasil). Levantamento da agricultura irrigada por pivôs centrais no Brasil: 1985-2022. Boletim do SNIRH, n. 4, nov. 2023.
-
ANA (Brasil). Capacidade de Água Disponível (CAD ou AWC dos Solos). 2021. Available: Disponível (CAD ou AWC dos Solos). 2021. Available: https://metadados.snirh.gov.br/geonetwork/srv/api/records/28fe4baa-66f3-4f6b-b0d2-890abf5910c4 . Accss: 01 fev. 2023.
» https://metadados.snirh.gov.br/geonetwork/srv/api/records/28fe4baa-66f3-4f6b-b0d2-890abf5910c4 -
BLENINGER, T.; KOTSUKA, L.K. Conceitos de Água Virtual e Pegada Hídrica: estudo de caso da soja e óleo de soja no Brasil. Revista Recursos Hídricos, n. 1, v. 36, p. 15-24, 2015. https://doi.org/10.5894/rh36n1-2
» https://doi.org/10.5894/rh36n1-2 - BORÉM, A. Feijão do Plantio a Colheita. Brasil: UFV, 2015. 384 p.
- BRASIL. Casa Civil. Lei n. 12.787, de 11 de janeiro de 2013. Dispõe sobre a Política Nacional de Irrigação; altera o art. 25 da Lei nº 10.438, de 26 de abril de 2002; revoga as Leis nºs 6.662, de 25 de junho de 1979, 8.657, de 21 de maio de 1993, e os Decretos-Lei nºs 2.032, de 9 de junho de 1983, e 2.369, de 11 de novembro de 1987; e dá outras providências. Diário Oficial [da] União: seção 1, Brasília, DF, n. 9, p. 4, 14 jan. 2013.
-
COMMAR, L. F. S.; LOUZADA, L.; COSTA, M. H.; BRUMATTI, L. M.; ABRAHÃO, G. M. Mato Grosso’s rainy season: past, present, and future trends justify immediate action. Environmental Research Letters, v. 19, 114065, 2024. https://doi.org/10.1088/1748-9326/ad8588
» https://doi.org/10.1088/1748-9326/ad8588 - CONAMA (Brasil). Resolução nº 357 de 17 de março de 2005. Dispõe sobre a classificação dos corpos de água e diretrizes ambientais para o seu enquadramento, bem como estabelece as condições e padrões de lançamento de efluentes, e dá outras providências. Diário Oficial [da] União: seção 1, Brasília, DF, n. 053, p. 58-63, 18 mar. 2005.
-
COSTA, M.; MOREIRA, M. C.; SILVA, D. D.; ALENCAR, K.; COELHO, C. Pegada Hídrica da soja, algodão e milho na região oeste do estado da Bahia. Engenharia Sanitária e Ambiental, v. 26, p. 971-978, 2021. https://doi.org/10.1590/S1413-41522020041
» https://doi.org/10.1590/S1413-41522020041 -
DIAS, G.; SILVA, E.; ANTOLIN, L.; VIEIRA, N.; MARIN, F. Simulação da Pegada Hídrica da soja no Mato Grosso baseada em projeções de mudanças climáticas. Agrometeoros, n. 1, v. 27, p. 155-163, 2020. https://doi.org/10.31062/agrom.v27i1.26567
» https://doi.org/10.31062/agrom.v27i1.26567 -
DIMAS, A. G.; TORRES, Y. S.; VEGA, R.; CRUZ, M. C. Water footprint and sustainable development goals: a bibliometric, semantic, and thematic analysis in economic-administrative sciences. Cleaner Environmental Systems, v. 18, p. 100316, 2025. https://doi.org/10.1016/j.cesys.2025.100316
» https://doi.org/10.1016/j.cesys.2025.100316 -
FAO. CropWat. Rome, 2023. Available at: Available at: https://www.fao.org/land-water/databases-and-software/cropwat/en/ Access: Jan. 10, 2023.
» https://www.fao.org/land-water/databases-and-software/cropwat/en/ - GALVÃO, J. C. C.; BORÉM, A.; PIMENTEL, M. A. (eds.). Milho: do plantio à colheita. Viçosa: Editora UFV, 2017.
- HOEKSTRA, A. Y.; CHAPAGAIN, A. K.; ALDAYA, M. M.; MEKONNEN, M. M. Manual de avaliação da pegada hídrica. London: Earthscan, 2011. 216 p.
- HOEKSTRA, A. Y.; HUNG, P. Q. Quantificação dos fluxos de água virtuais. Delft: IHE Delft, 2002. 120 p.
-
IBGE. Produção agropecuária: Mato Grosso. 2024. Available at: Available at: https://www.ibge.gov.br/explica/producao-agropecuaria/mt Access: Mar. 20, 2026.
» https://www.ibge.gov.br/explica/producao-agropecuaria/mt -
LOPEZ, L.; CAPETILLO, C. Green and blue water footprint accounting for dry beans (Phaseolus vulgaris) in primary region of Mexico. Sustainability, v. 7, p. 3001-3016, 2015. https://doi.org/10.3390/su7033001
» https://doi.org/10.3390/su7033001 -
MAPBIOMAS. Coleção da série anual de mapas de cobertura e uso da terra do Brasil, 2020. 2020. Available: Available: https://mapbiomas.org/ Access: Dec. 10, 2022.
» https://mapbiomas.org/ -
MATO GROSSO DO SUL. Secretaria de Estado de Meio Ambiente, Desenvolvimento Econômico, Produção e Agricultura Familiar. Safra 2015/16: Alerta máximo para Mato Grosso. Dec. 21, 2015. Available: Available: https://www.semadesc.ms.gov.br/safra-201516-alerta-maxmo-para-mato-grosso/ Access: Aug. 10, 2022.
» https://www.semadesc.ms.gov.br/safra-201516-alerta-maxmo-para-mato-grosso/ -
MEKONNEN, M. M.; HOEKSTRA, A. The green, blue and grey water footprint of crops and derived crop products. Hydrology and Earth System Sciences, v. 15, p. 1577-1600, 2011. https://doi.org/10.5194/hess-15-1577-2011
» https://doi.org/10.5194/hess-15-1577-2011 -
MEKONNEN, M. M.; HOEKSTRA, A. Y. Water footprint benchmarks for crop production: A first global assessment. Ecological Indicators, v. 46, p. 214-223, 2014. https://doi.org/10.1016/j.ecolind.2014.06.013
» https://doi.org/10.1016/j.ecolind.2014.06.013 -
MIZYED, A.; MOGHIER, Y.; HAMADA, M. Employing the agricultural water footprint concept to enhance the sustainable management of water resources: a review. Water Practice & Technology, v. 19, n. 11, p. 4435-4452, 2024. https://doi.org/10.2166/wpt.2024.274
» https://doi.org/10.2166/wpt.2024.274 - MORATELLI, F. Caracterização físico-hídrica do solo em duas sub-bacias hidrográficas do rio Teles Pires, sul da Amazônia brasileira. 2021. Dissertação (Mestrado em Ciências Ambientais) - Instituto de Ciências Naturais, Humanas e Sociais, Universidade Federal de Mato Grosso, Sinop, 2021.
- PERTUSSATTI, C. A. Veranicos no estado de Mato Grosso: análise da variabilidade espaço-temporal e modelagem estatística. 2013. Dissertação (Mestrado em Tecnologia Ambiental e Recursos Hídricos) - Departamento de Engenharia Civil e Ambiental, Universidade de Brasília, Brasília, 2013.
-
REUTERS. Apesar da seca, Mato Grosso tem parte do milho 'salvo'. Revista Globo Rural, 30 abr. 2021. Available: Available: https://globorural.globo.com/Noticias/Agricultura/Milho/noticia/2021/04/apesar-da-seca-mato-grosso-tem-parte-do-milho-salvo.html Access: Aug. 10, 2022.
» https://globorural.globo.com/Noticias/Agricultura/Milho/noticia/2021/04/apesar-da-seca-mato-grosso-tem-parte-do-milho-salvo.html -
RODRIGUEZ, C.; GALARRETA, V. A.; KRUSE, E. Analysis of water footprint of potato production in the pampean region of Argentina. Journal of Cleaner Production, v. 90, p. 91-96, 2015. https://doi.org/10.1016/j.jclepro.2014.11.075
» https://doi.org/10.1016/j.jclepro.2014.11.075 -
SCARPARE, F.; HERNANDES, T.; RUIZ-CORRÊA, S.; KOLLN, O.; GAVA, G.; SANTOS, L. et al Sugarcane water footprint under different management practices in Brazil: Tietê/Jacaré watershed assessment. Journal of Cleaner Production, v. 112, p. 4576-4584, 2016. https://doi.org/10.1016/j.jclepro.2015.05.107
» https://doi.org/10.1016/j.jclepro.2015.05.107 - SEDIYAMA, T. Soja do Plantio a Colheita. Brasil: UFV, 2015. 333. p.
-
SILVA, R. A.; SILVA, V. P. R.; NUNES, C.; SILVA, P. H.; NAOE, A. M.; MACIEL, G. Quantificação da Pegada Hídrica da soja na região de MATOPIBA: cenário atual e mudanças climáticas. Revista de Geografia, n. 3, v. 37, p. 26-46, 2020. https://doi.org/10.51359/2238-6211.2020.244280
» https://doi.org/10.51359/2238-6211.2020.244280 - SOUZA, D. M. G.; LOBATO, E. Cerrado: correção do solo e adubação. Brasília: Embrapa Cerrados, 2004. 416 p.
- UNESCO. UN World Water Development Report 2024: water for prosperity and peace. Paris, 2024.
-
ZHANG, G.; WANG, X.; ZHANG, L.; XIONG, K.; ZHENG, C.; LU, F. et al Carbon and water footprints of major cereal crops production in China. Journal of Cleaner Production, v. 194, p. 613-623, 2018. https://doi.org/10.1016/j.jclepro.2018.05.024
» https://doi.org/10.1016/j.jclepro.2018.05.024
Edited by
-
Editor-in-Chief:
Nelson Wellausen Dias https://orcid.org/0000-0002-9507-9211