 Evaluation of the Use of Amazônia-1 and CBERS-4 Images in LULC Mapping Combined with Machine Learning Classifiers
Abstract
Rapid changes in land use and land cover in many parts of the world have placed enormous pressure on the environmental conservation of river basins. In Brazil, continuous monitoring of these changes using national satellite images has become crucial and accessible for the management and monitoring of water resources. Several studies have employed remote sensing and data science tools to investigate changes in land use and land cover, using different machine learning classifiers due to their operational efficiency and high robustness. Therefore, it is critical to evaluate and compare the performance of different machine learning classifiers for accurate mapping of land use and land cover in environmentally unstable areas. The main objective of this study was to perform an accuracy analysis of land use and land cover mapping, integrating the performance of four different classifiers: K-means, Object Oriented Analysis (OBIA), Random Forest and Support Vector Machines (SVM), using images from the Amazônia-1 and CBERS-4 satellites in the diffuse hydrographic basin of the Boa Esperança Dam, in Piauí, Brazil. According to the results, SVM was the best performing classifier, achieving a maximum overall accuracy (IoU) of 89.38%, while K-means presented values below 70%. OBIA stood out for CBERS-4, while Amazônia-1 performed well in all supervised classifiers. The K-means algorithm showed the lowest performance, with emphasis on CBERS-4, with an estimate of 43.57% driven by the low values seen for the soybean and pasture classes.
Keywords:
Watershed; Machine Learning; Remote Sensing
Resumo
Mudanças rápidas no uso e cobertura da terra em muitas partes do mundo têm colocado enorme pressão sobre a conservação ambiental das bacias hidrográficas. No Brasil, o monitoramento contínuo dessas mudanças usando imagens de satélite nacionais tornou-se crucial e acessível para a gestão e monitoramento dos recursos hídricos. Vários estudos empregaram ferramentas de sensoriamento remoto e ciência de dados para investigar mudanças no uso e cobertura da terra, usando diferentes classificadores de aprendizado de máquina devido à sua eficiência operacional e alta robustez. Portanto, é fundamental avaliar e comparar o desempenho de diferentes classificadores de aprendizado de máquina para mapeamento preciso do uso e cobertura da terra em áreas ambientalmente instáveis. O principal objetivo deste estudo foi realizar uma análise de acurácia do mapeamento do uso e cobertura da terra, integrando o desempenho de quatro classificadores diferentes: K-means, Análise Orientada a Objetos (OBIA), Random Forest e Máquinas de Vetores de Suporte (SVM), usando imagens dos satélites Amazônia-1 e CBERS-4 na bacia hidrográfica difusa da Barragem de Boa Esperança, no Piauí, Brasil. De acordo com os resultados, o SVM foi o classificador com melhor desempenho, atingindo uma acurácia geral máxima (IoU) de 89,38%, enquanto o K-means apresentou valores abaixo de 70%. O OBIA se destacou para o CBERS-4, enquanto o Amazônia-1 apresentou bom desempenho em todos os classificadores supervisionados. O algoritmo K-means apresentou o menor desempenho, com destaque para o CBERS-4, com uma estimativa de 43,57%, impulsionada pelos baixos valores observados para as classes soja e pastagem.
Palavras-chave:
Bacia hidrográfica; Aprendizado de máquina; Sensoriamento remoto
1 Introduction
Land use and land cover are essential for understanding Earth’s surface and its dynamic changes. Land use refers to how land is utilized-such as for agriculture, industry, or housing-while land cover describes its physical characteristics, like forests, water bodies, or grasslands. Studying these elements helps analyze environmental processes including flooding, climate change, and erosion (Cunha et al. 2022). In the Cerrado biome, accurate data supports climate adaptation and conservation policies. Government agencies use this information for public planning and development (Wang et al. 2023). Land use and land cover mapping, obtained through remote sensing, is an essential tool for supporting agricultural monitoring, deforestation prevention, and the protection of endangered species. These products do not, by themselves, guarantee biodiversity conservation or ecological restoration, but they provide strategic information that can guide the formulation and implementation of public policies. Therefore, their relevance lies in supporting decision-making processes aimed at the sustainable management of natural resources and reducing impacts in areas vulnerable to disasters (Fonseca et al. 2021).
Remote sensing technology has transformed land use and land cover mapping by delivering high-resolution spatial data. Despite advances, accurate classification remains challenging due to spectral, temporal, and spatial variability, as well as terrain and atmospheric factors (Talukdar et al. 2020; Silva Junior & Pacheco, 2023). National satellites like Amazônia-1 and CBERS-4/4A provide frequent, wide-area coverage, supporting basin monitoring and research. These systems enable temporal analyses and are essential for managing deforestation, fires, water resources, agriculture, and urban growth (Oldoni et al. 2022).
Recent advancements in machine learning have further enhanced land use and land cover classification techniques. Image classification methods, which assign pixels to specific categories based on spectral signatures and other features, are widely employed in geospatial mapping (Bao, Huang & Wu 2023; Zafar et al. 2024). Over the past decade, machine learning classifiers have emerged as powerful tools for land cover analysis, demonstrating superior accuracy and performance compared to traditional classification methods. Machine learning algorithms can handle large and complex datasets efficiently, making them particularly valuable for land use mapping. Machine learning classification techniques can be divided into supervised and unsupervised methods. Supervised techniques include Support Vector Machine (SVM) (Zafar et al. 2024), Random Forest (RF) (Bao, Huang & Wu, 2023), K-Nearest Neighbor (KNN) (Pacheco et al. 2021), and Artificial Neural Networks (ANN) (Ahmad et al. 2023). Meanwhile, unsupervised techniques such as t-Distributed Stochastic Neighbor Embedding (t-SNE) (Tejasree & Agilandeeswari, 2024), Hierarchical Clustering (Sun et al. 2021), and Density-Based Spatial Clustering of Applications with Noise (DBSCAN) (Wang et al. 2023) are also used for land cover classification. Ongoing research seeks to determine the most effective algorithms for land use mapping, with sensor characteristics and image data factors influencing classification accuracy (Ahmad et al. 2023).
Considering the importance of accurate land use and land cover mapping in environmentally sensitive regions, as well as the need for efficient modern tools to enhance the process, this study aims to: (i) map and analyze the accuracy of land use and land cover classification in the Boa Esperança dam diffuse basin; (ii) evaluate the technical strengths and limitations of data from CBERS-4 and Amazônia-1 satellites for land use mapping; and (iii) identify the most effective machine learning algorithms for classification while assessing their hyperparameter training performance.
2 Methodology and Data
2.1 Study area
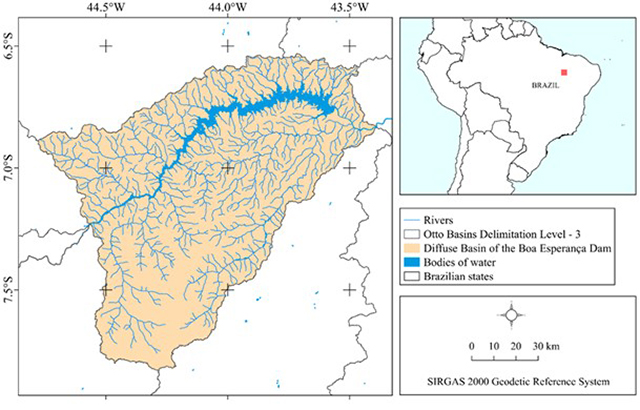
The study area covers the diffuse hydrographic basin of the Boa Esperança Dam, located in a transition zone between the states of Maranhão and Piauí (Figure 1). This basin is part of the Ottocoded Hydrographic Base (BHO), used by the National Water and Basic Sanitation Agency (ANA) for water resources management and derived from the digital mapping of the country's hydrography using Otto Pfafstetter's basin coding (ANA 2012).
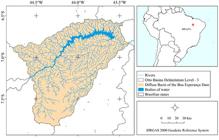
The basin has one of the largest surface water bodies in the Brazilian Northeast, the Boa Esperança hydroelectric plant. The plant's drainage area is 87,500 km² and is located on the Parnaíba River, whose watershed has an area of approximately 300,000 km² (Oliveira, Pereira & Parente 2017). This basin was chosen due to the frequent changes in its land use and coverage, which are driven by advanced large-scale agricultural and livestock development, with emphasis on soybean cultivation and cattle raising (ICMBIO 2022).
2.2 Amazônia-1/WFI and CBERS-4/WFI
The Amazônia-1/WFI and CBERS-4/WFI images, dated 01/09/2023 and 12/10/2023 respectively, were acquired from INPE's remote sensing data platform (INPE 2024). The images from both satellites have a radiometric resolution of 10 bits, are georeferenced in the UTM/WGS84 system and have a spatial resolution of 64 meters. The spectral coverage includes the blue (0.45-0.52 µm), green (0.52-0.59 µm), red (0.63-0.69 µm) and NIR (0.77-0.89 µm) bands (Vrabel et al. 2022). The images were converted from digital number (ND) scale to Top of Atmosphere (ToA) reflectance according to the model proposed by Pinto et al. (2016) and Oldoni et al. (2022), which considers the variables of Earth-Sun distance, solar zenith angle and exoatmospheric solar irradiance, parameters provided in the metadata file available when the images were acquired.
After preprocessing the WFI images, the NDVI and NGWI spectral indices were used as additional spectral features for land use and land cover classification. NDVI, a measure of healthy vegetation obtained from satellite images, is calculated by the ratio between the reflection and absorption signals of chlorophyll in the near infrared (NIR) and red (RED) bands, according to Equation 1. This index is useful for extracting and mapping vegetation (Huete 2002). NGWI, in turn, uses the spectral distance of each pixel to a reference spectral point, converging to areas of water bodies based on the reflectances of the green and near infrared bands, according to Equation 2 (Silva Junior 2024).
2.3 Classification Methods
The stratified random sampling technique was adopted to select pixels related to each land cover class. The training phase was performed manually, using the photointerpretation technique, where 200 relatively uniform vector polygons were collected for each class, totaling 800 polygons for each CBERS-4 and Amazon-1 scene. The classes were chosen based on the largest spatial proportions present in the basin, according to the 2022 MapBiomas data. The predominant classes were: Vegetation (76.2%), Soybean (9.34%), Pasture (8.18%), and Water (3.91%). Other classes were observed, but they accounted for approximately 2% of the total area of the basin and, therefore, were discarded and distributed among the classes chosen with the highest spectral affinity.
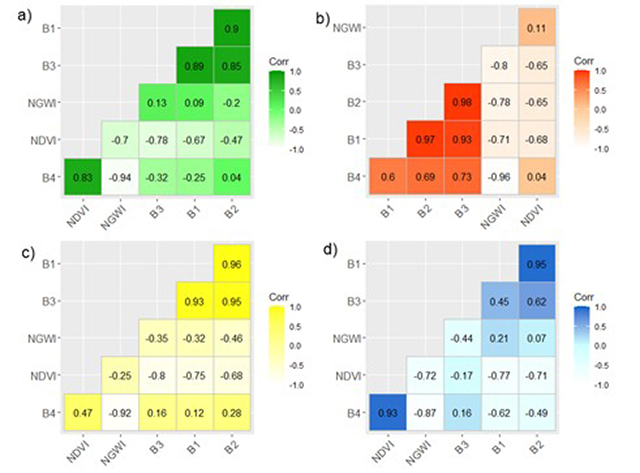
After sample selection, a Pearson correlogram was performed to verify the capacity of the sample set based on the similarity of the spectral information of the AMAZÔNIA-1 and CBERS-4 datasets. To perform a supervised classification on the images, the training samples assigned to the land cover classes and the following classifiers were used: Support Vector Machines (SVM), Ranfom Forest (RF), K-means, Object-Based Image Analysis (OBIA).
2.4 Accuracy Analysis
Land use and land cover data from the Mapbiomas project were used as spatial and thematic reference. MapBiomas is a scientific collaboration initiative focused on the updated mapping of land use and land cover in Brazil. This initiative carries out annual monitoring and provides georeferenced land use and land cover maps for the period 1985 to 2023 (version 9). The mapping is performed based on deep neural networks using Landsat scenes, resulting in data with a spatial resolution of 30 meters, through the Google Earth Engine platform (Souza et al. 2020).
The classification accuracy for the land use and land cover map produced by each classifier in the Amazônia-1 and CBERS-4 scenes was evaluated using the error matrix, which includes the Error of Omission (EO), Error of Commission (EC) and the F1-score calculated by Equations 3, 4 and 5 respectively (Feng et al. 2023).
In the contingency matrix, FN, FP, TP and TN are the number of false-negative, false-positive, true-positive and true-negative observations, respectively. A thematic analysis by accuracy metrics was performed through a precision assessment on a regional scale, using regression metrics. The proportion of 5 km resolution grid cells detected by the classified land use and land cover products of the Amazônia-1 and CBERS-4 images was compared to the proportion of area detected by the reference data (Mapbiomas). The correlation coefficient (r) was used as an indication of accuracy (Giglio 2018).
Intersection over Union (IoU) was used to evaluate the classifiers. IoU is a criterion for semantic segmentation and object localization, calculated as the ratio between the intersection and the union of the areas of the reference label and the model classification. Its value ranges from 0 to 100%, where 100% indicates perfect overlap and 0% means no correspondence (Fernandes Junior et al. 2021). In this study, IoU was applied to 5 km cell grids, allowing for more precise spatial detailing in the adequacy of the classifier products in relation to the reference data (Equation 6).
Where Y represents the reference map and Y is the classification predicted by the models.
3 Results
3.1 Spectral Similarity Analysis
To analyze the spectral similarity of the training samples obtained in the Amazônia-1 and CBERS-4 scenes, Figures 2 and 3 show the correlograms for each spectral resource in the Vegetation, Soybean, Pasture and Water classes. When examining Figures 2 and 3, it is observed that, in general, the correlograms exhibit a very similar pattern between the spectral resources of Amazônia-1 and CBERS-4 for all classes.
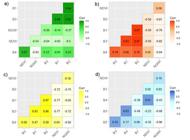
Correlograms between the Amazônia-1 bands as well as their spectral indices for each land use and cover class: A. Vegetation; B. Soybean; C. Pasture; D. Water.
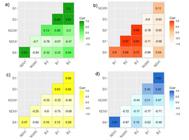
Correlograms between the CBERS-4 bands as well as their spectral indices for each land use and cover class: A. Vegetation; B. Soybean; C. Pasture; D. Water.
The visible bands showed high inter-correlations across all land cover classes, except for water, which exhibited distinct behavior in both sensors. This deviation likely results from spectral sensitivity to solar angle, scattering, and water impurities-especially in the blue and green bands-reducing inter-band correlation (Figure 2-3), but enhancing their effectiveness in water detection (Barbosa, Novo & Martins 2019). Classifiers using only visible bands are prone to misclassifications, particularly in vegetation, soybean, and pasture. Including the near-infrared band improves accuracy by increasing spectral differentiation, as it displays near-zero or negative correlations with visible bands (Figure 2). NDVI and NGWI also present unique correlation patterns per land cover type due to low spectral similarity among classes (Yuan, Tian & Reinartz 2023). NDVI showed strong correlations with vegetation and water, while NGWI had predominantly negative correlations, especially with visible and near-infrared bands, reinforcing sensor consistency.
3.2 Classification Analysis
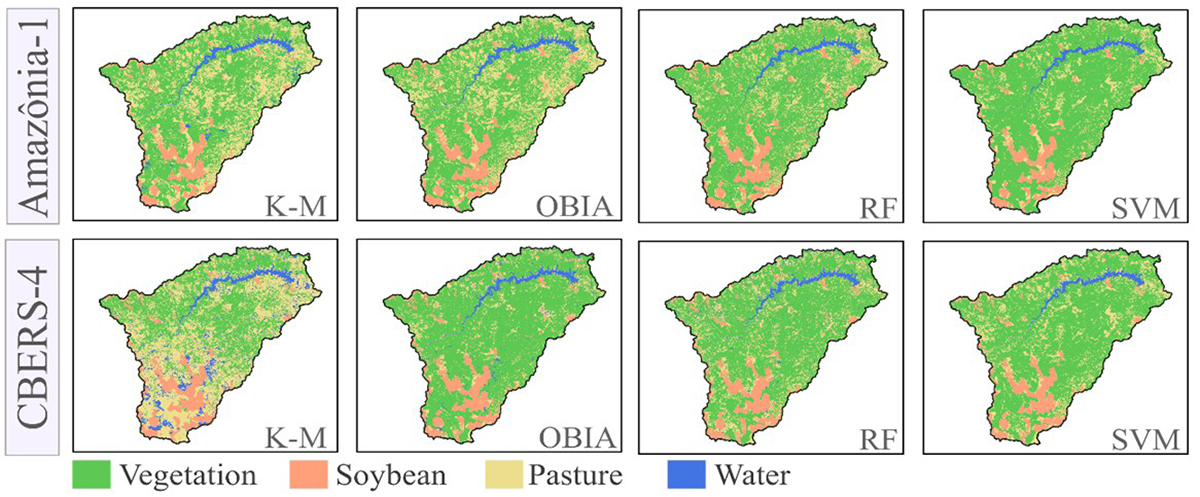
Figure 4 shows the land use and land cover maps in the study area, highlighting the changes in the distribution of classes for the different classifiers.
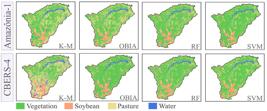
Spatial distribution of land use and land cover maps in the Boa Esperança Dam diffuse basin obtained by the Amazônia-1 and CBERS-4 scenes for the different classifiers.
In general, the maps generated by the Amazônia-1 and CBERS-4 systems showed similar behaviors: good delimitation of the dam's water body, high frequency of soybean pixels in the southern sector, widely distributed pasture pixels and predominance of the vegetation class (Figure 4). Visually, the maps did not show significant variations between the classifiers, especially in the more compact feature classes, with emphasis on the supervised classifiers (OBIA, RF and SVM). Although OBIA is typically used in high-resolution images, its application in lower spatial resolution images proved to be effective in distinguishing different types of objects, enhancing its ability to separate classes in the basin (Nasir et al. 2022; Cunha et al. 2020). Several studies report the high capacity of RF and SVM classifiers, which, because they are sample-based and capable of dealing with nonlinear relationships in the data, avoid overfitting.
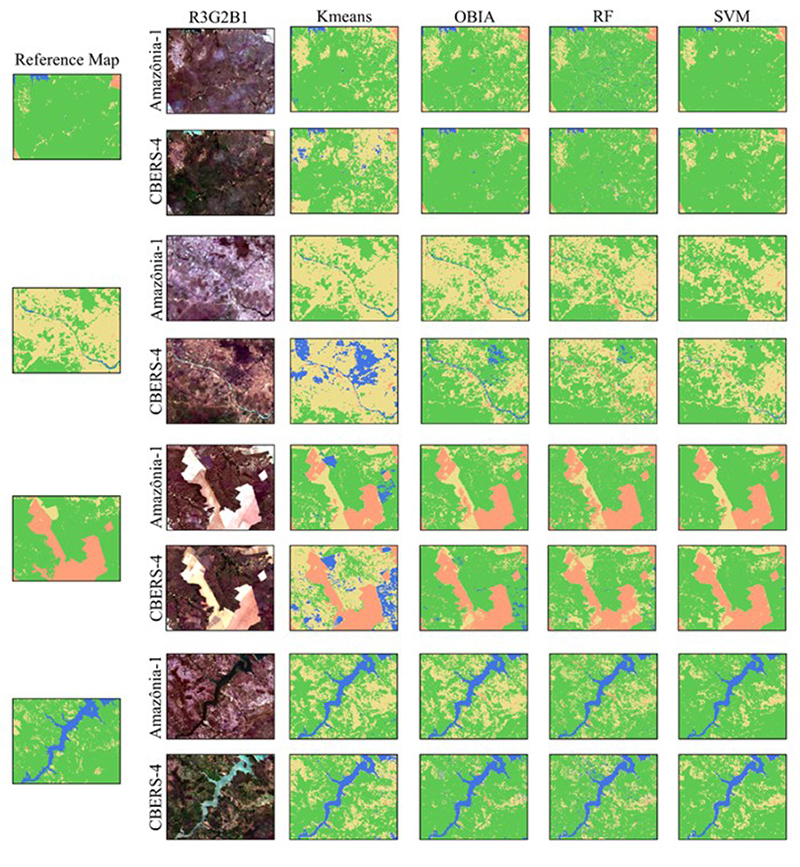
Still in Figure 5, it was possible to observe some inconsistencies in the comparison between the maps, such as water pixels in the southern sector in CBERS-4 in the K-Means classifier. On the other hand, although K-means is an unsupervised model that depends only on the average distance of the clusters to generate the classification, it was able to separate the classes according to the spatial distribution of the main uses of the basin. A more detailed breakdown of the spatial distribution for each classifier is visible in the map mosaic shown in Figure 6. This figure displays four example sectors that highlight the classifications compared to the reference map and also includes a composite of natural-color images from the CBERS-4 and Amazon-1 scenes.
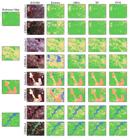
Comparison between classification results in example sectors. The first column refers to the reference map, the second column consists of a colored composite of the Amazon-1 and CBERS-4 scenes, and the third to sixth columns display a mosaic of maps for the K-means, OBIA, RF, and SVM classifiers.
In Example 1, most classifiers showed a similar spatial distribution for vegetation compared to the reference map. However, OBIA for Amazônia-1 and K-means for both satellites underestimated vegetation, misclassifying pixels as pasture and water. In Example 2, a similar pattern was observed, though Amazônia-1 had better visual performance, while CBERS-4 overestimated water, particularly in the K-means and OBIA classifiers.
Example 3 revealed classification inconsistencies, with pasture areas being misclassified as soybean. Two main limitations contribute to this issue. First, as Costa et al. (2017) noted, pasture and soybean have similar spectral signals in visible bands, causing confusion in classifiers. Second, MapBiomas maps may generalize agricultural classes due to their annual generalization method using Landsat images. This generalization can lead to spatiotemporal inconsistencies when compared to single images from specific planting or harvesting periods. Luciano et al. (2022) emphasized the need for generalized classification methods for large-scale crop mapping over time, showing that multi-year datasets improve temporal generalization. However, applying these methods to past years remains challenging and requires further methodological development. In this example, supervised classifiers (OBIA, RF, and SVM) showed similar distributions, while K-means overestimated the water class.
In Example 4, the dam water body was well classified by all classifiers, with no significant inconsistencies. Similar findings were reported by Rajendiran & Kumar (2022), who successfully extracted water bodies using machine learning classifiers on LISS-III and Landsat-8 images. The unique spectral properties of water aid in its classification, as seen in Figures 1, 2, 3, and 4. However, water overestimations in previous examples may be linked to burned areas, which confuse classifiers due to their low reflectance and spectral similarities to water. This phenomenon, reported by Pacheco et al. (2021) and Alcaras et al. (2022), highlights the challenges in distinguishing water from burned regions.
3.3 Accuracy Analysis
Table 1 shows the accuracy estimates for each land cover class. For Amazonia-1, in the omission error, each classifier stood out in the different classes, while for the commission error, the SVM stood out in the Pasture and Water classes, and in the F1 for all classes. In CBERS-4, the K-means and RF presented the worst results in EC, EO and F1 score, although with a small advantage in the omission error for the k-means, while the SVM stood out in the commission error and F1 score estimates for all classes, except Pasture.
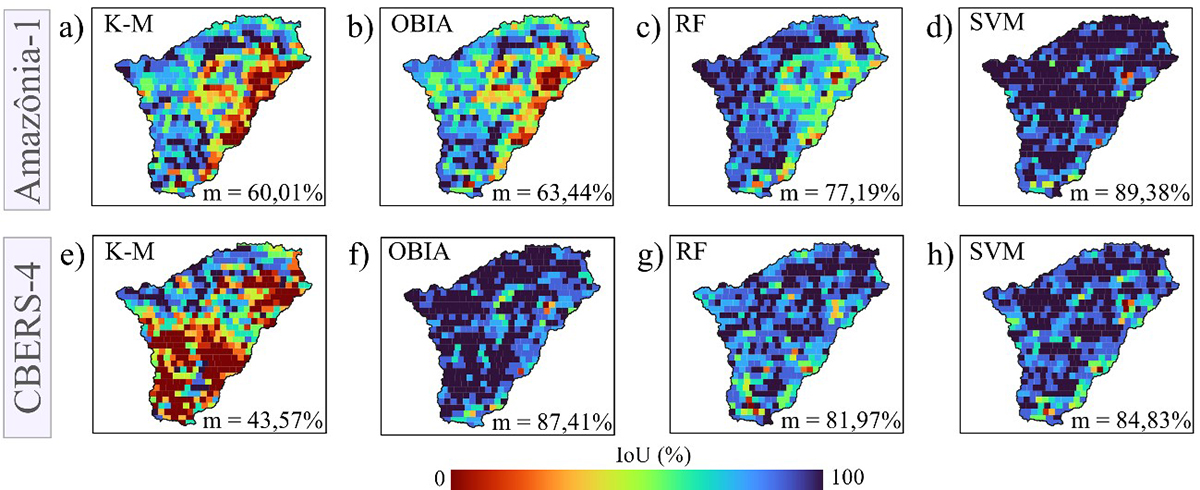
Amazônia-1 showed a slight advantage over CBERS-4 for the K-means classifier, achieving the best accuracy estimates. However, for the soybean class, CBERS-4 showed the lowest omission error value and an F1-Score equal to that of Amazônia-1. In the OBIA method, the Amazônia-1 data also showed an advantage, mainly in the F1-score estimates and for the precision estimates for the "Water" class, although, in the pasture class, CBERS-4 stood out in the commission error and F1-Score estimates. In the RF classifier, both sensors presented similar accuracy estimates, especially in the F1-score values. Similarly, the SVM did not show a consistent pattern in the accuracy estimates, with quite balanced results, since, overall, the Amazônia-1 stood out in the commission error, while the CBERS-4 stood out in the omission error estimates, while the F1-score values showed small variations between the sensors. This trade-off seen in the accuracy estimates in Table 1 can be summarized by the IoU value that is capable of estimating the overall accuracy ratio of the classifiers taking into account area and allocation disagreement. Therefore, due to its capacity, Figure 6 shows the overall IoU distribution by 5 km x 5 km cell grid. Table 2 shows the overall accuracy percentages for each classified product.
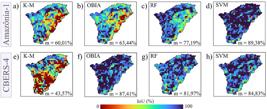
5km x 5km cell grid for the IoU values and the overall value: A,E. K-means; B,F. OBIA; C,G. RF; D,H. SVM.
For Amazônia-1, SVM had the best performance, with an average IoU of 89.38%, while RF and OBIA obtained moderate values and K-Means obtained the lowest performance, with an average of 60.01% (Figure 7). For CBERS-4, SVM and RF obtained close average Iou values, on the other hand, OBIA obtained a slight improvement in the comparison and K-Means again had slightly lower performance, with an average of 43.57%. The results show that the supervised classifiers (SVM and RF) outperformed the unsupervised ones (K-M), with consistently higher performances. Furthermore, the overall performance was better with the CBERS-4 satellite than with the Amazônia-1, especially for the OBIA and RF classifiers. The good performance of the SVM followed the same pattern as the CE, OE and F1-Score estimates shown in Table 1, indicating the good suitability of this algorithm for land use and land cover mapping, with no significant variations when implemented with different sensors. This is evidenced in Figure 6, where the IoU is concentrated above 80%. For both datasets.
3.4 Regression Analysis by 5km x 5km Proportion Grid
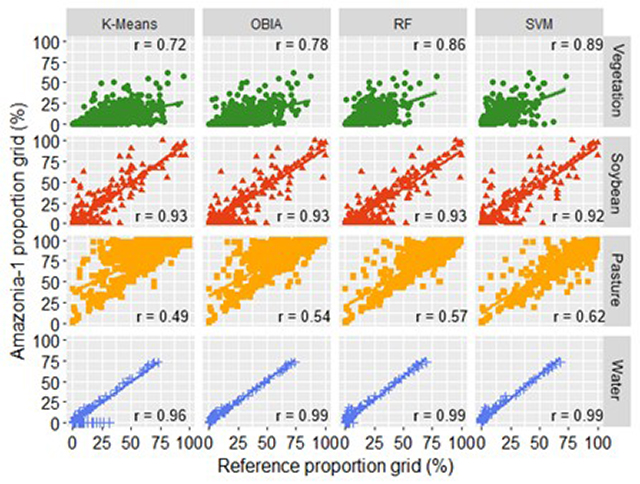
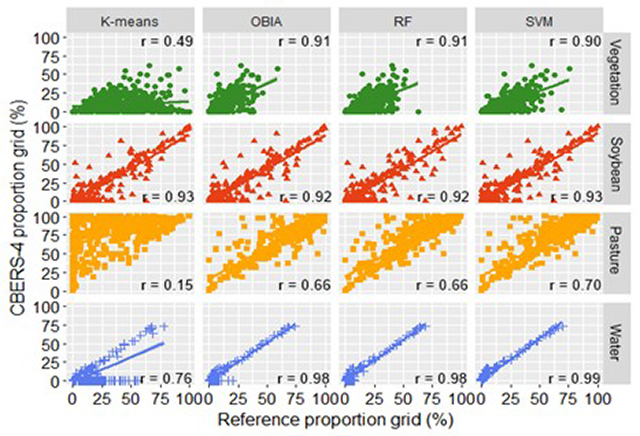
Figures 7 and 8 report the scatter plots obtained by the regression by proportion of 5km x 5km cells for each classifier obtained by the Amazon-1 and CBERS-4 scenes respectively. In addition, shows the general correlation coefficients.
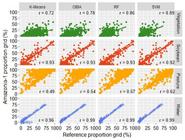
Regression by proportion of 5km x 5m cells for the Amazonia-1 data and the reference data as well as the coefficient of determination for land cover class.
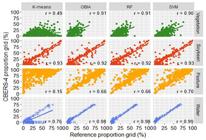
Regression by proportion of 5km x 5m cells for the CBERS-4 data and the reference data as well as the coefficient of determination for land cover class.
For Amazônia-1, K-means showed a specific correlation for the pasture class, while OBIA performed better in vegetation, pasture, and water classes. However, both had an overall correlation below 0.9 (Table 2). RF had a comparable correlation between classes, ranking second overall, while SVM exhibited a high correlation (above 0.9) for most classes, especially pasture (Figure 7). For CBERS-4, K-means had the lowest performance, particularly in vegetation, pasture, and water, leading to the lowest general correlation. OBIA showed consistent correlation values across all classes, while RF and SVM performed well, particularly in the water class (Figure 8). Across both satellite systems, except for K-means, classifiers demonstrated stable performance with minor variations, indicating effectiveness. SVM was particularly strong for Amazônia-1, achieving the highest overall correlation. Figure 1’s grid cell regressions show that the vegetation class exhibited unique behavior and good adherence to reference data. The basin’s landscape characteristics resulted in a more compact distribution, minimizing allocation issues. Cunha et al. (2020) reported a 98.5% accuracy for vegetation in the Rio da Prata Basin, attributing this to the Cerrado’s homogeneity and stable vegetation coverage, which facilitated classification and validation.
The evaluations revealed that the water class achieved the highest accuracy due to its strong spectral absorption properties, which minimize variability compared to terrestrial classes (Figure 1). This led to consistently high classification performance across most classifiers, a trend also observed in Liu et al. (2020). However, the pasture and soybean classes, despite yielding comparable results, demonstrated susceptibility to local land-use dynamics and exhibited spectral similarities, leading to misclassifications. This issue is particularly evident in images captured within the VIS-NIR range, such as those from the Amazônia-1 and CBERS-4 sensors. Employing sensors that operate in the NIR-SWIR range could help mitigate these classification errors (Chen et al. 2023). Additionally, both classes displayed a dispersed spatial distribution and small features, which further impacted classification accuracy by reducing the ability to distinguish between different land cover types, particularly when compared to higher-resolution imagery (Maxwell & Warner 2020).
Amazônia-1 showed higher accuracy than CBERS-4, but definitive conclusions are premature due to influences like sample selection, hyperparameter tuning, analyst expertise, and reference data quality (Zafar et al. 2024). Classification accuracy relies on input data representativeness, as biased samples can distort results (Maxwell & Warner 2020). Although k-means performed well in some classes, it tends to create non-existent classes, especially in high-resolution, multi-class contexts (Tejasree & Agilandeeswari, 2024). Its simplicity and efficiency are advantages, but spectral overlap between land cover types limits its precision.
In contrast, supervised classification models are better suited for land use and land cover mapping. While they require sample selection and remain sensitive to this process, supervised algorithms are highly effective for nonlinear classification problems and can adapt to data complexities. Their efficiency is particularly beneficial for detecting specific land cover classes and accommodating multitemporal variations in satellite imagery (Souza et al. 2020). However, as Aziz et al. (2024) emphasize, both supervised and unsupervised classification methods require prior knowledge of the study area to maximize accuracy.
4 Conclusion
This paper demonstrated the usability of different classification algorithms using images from Amazônia-1 and CBERS-4. The SVM and Random Forest methods proved to be the most effective for both sensors, with an overall correlation ranging from 0.98 to 0.96, indicating robustness in classifying different land use and land cover classes. OBIA performed well, especially for CBERS-4, while K-means performed the worst overall, although it was still able to identify the main land use classes of the basin. These results highlight the importance of choosing the appropriate classifier, considering the specific characteristics of satellite images and the adoption of good data pre-processing practices in all methodological stages, as they interfere in the final result.
Amazônia-1 outperformed CBERS-4 in terms of accuracy. On the other hand, despite the 20-day difference between the capture of the scenes, CBERS-4 presented images with interference in the natural landscape, which may have reduced the accuracy estimates. The classification of land use and land cover with national satellite images proved to be convenient and satisfactorily met the proposed methodology, especially when applied with several input spectral resources. Finally, the results obtained can significantly contribute to the development of sustainable watershed management strategies, allowing decision makers to better identify priority areas and plan their interventions more effectively.
5 References
- Ahmad, M., Peng, T., Awan, A. & Ahmed, Z. 2023, ‘Policy framework considering resource curse, renewable energy transition, and institutional issues: Fostering sustainable development and sustainable natural resource consumption practices’, Resources Policy, vol. 86, 104173, DOI: 10.1016/j.resourpol.2023.104173
- Alcaras, E., Costantino, D., Guastaferro, F., Parente, C. & Pepe, M. 2022, ‘Normalized Burn Ratio Plus (NBR+): A New Index for Sentinel-2 Imagery’, Remote Sensing, vol. 14, no. 7, 1727, DOI: 10.3390/rs14071727
-
ANA (Agência Nacional de Águas). 2012, Bacias Hidrográficas Ottocodificadas (Níveis Otto 1-7), Catálogo de Metadados da ANA, https://metadados.snirh.gov.br/geonetwork/srv/api/records/b228d007-6d68-46e5-b30d-a1e191b2b21f
» https://metadados.snirh.gov.br/geonetwork/srv/api/records/b228d007-6d68-46e5-b30d-a1e191b2b21f - Aziz, G., Minallah, N., Saeed, A., Frnda, J. & Khan, W. 2024, ‘Remote sensing based forest cover classification using machine learning’, Scientific Reports, vol. 14, no. 1, DOI: 10.1038/s41598-023-50863-1.
- Bao, F., Huang, K. & Wu, S. 2023, ‘The retrieval of aerosol optical properties based on a random forest machine learning approach: Exploration of geostationary satellite images’, Remote Sensing of Environment, vol. 286, 113426, DOI: 10.1016/j.rse.2022.113426
-
Barbosa, C., Novo, E. & Martins, V. 2019, Sensoriamento Remoto: Introdução ao Princípios e Aplicações de Sistemas Aquáticos, 1 ed, http://www.dpi.inpe.br/labisa/livro/res/conteudo.pdf
» http://www.dpi.inpe.br/labisa/livro/res/conteudo.pdf - Chen, H., Li, H., Liu, Z., Zhang, C., Zhang, S. & Atkinson, P.M. 2023, ‘A novel Greenness and Water Content Composite Index (GWCCI) for soybean mapping from single remotely sensed multispectral images’, Remote Sensing of Environment, vol. 295, 113679, DOI: 10.1016/j.rse.2023.113679
- Costa, O.B. da, Matricardi, E.A.T., Pedlowski, M.A., Cochrane, M.A. & Fernandes, L.C. 2017, ‘Spatiotemporal mapping of soybean plantations in Rondônia, Western Brazilian Amazon’, Acta Amazonica, vol. 47, no. 1, pp. 29-38, DOI: 10.1590/1809-4392201601544
- Cunha, A.C., Almeida, R., Tanaka, A.A., Goes, B.C. & Putti, F.F. 2020, ‘Influence of the estimated global solar radiation on the reference evapotranspiration obtained through the Penman-Monteith FAO 56 method’, Agricultural Water Management, vol. 243, 106491, DOI: 10.1016/j.agwat.2020.106491
- Feng, C., Zhang, W., Deng, H., Dong, L., Zhang, H., Tang, L., Zheng, Y. & Zhao, Z. 2023, ‘A Combination of OBIA and Random Forest Based on Visible UAV Remote Sensing for Accurately Extracted Information about Weeds in Areas with Different Weed Densities in Farmland’, Remote Sensing, vol. 15, no. 19, 4696, DOI: 10.3390/rs15194696
- Fernandes Junior, F.E., Nonato, L.G., Ranieri, C.M. & Ueyama, J. 2021, ‘Memory-Based Pruning of Deep Neural Networks for IoT Devices Applied to Flood Detection’, Sensors, vol. 21, no. 22, 7506, DOI: 10.3390/s21227506
- Fonseca, L.M.G., Körting, T.S., Bendini, H. do N., Girolamo-Neto, C.D., Neves, A.K., Soares, A.R., Taquary, E.C. & Maretto, R.V. 2021, ‘Pattern Recognition and Remote Sensing techniques applied to Land Use and Land Cover mapping in the Brazilian Savannah’, Pattern Recognition Letters, vol. 148, pp. 54-60, DOI: 10.1016/j.patrec.2021.04.028
- Giglio, L., Boschetti, L., Roy, D.P., Humber, M.L. & Justice, C.O. 2018, ‘The Collection 6 MODIS burned area mapping algorithm and product’, Remote Sensing of Environment, vol. 217, pp. 72-85, DOI: 10.1016/j.rse.2018.08.005
- Huete, A., Didan, K., Miura, T., Rodriguez, E.P., Gao, X. & Ferreira, L.G. 2002, ‘Overview of the radiometric and biophysical performance of the MODIS vegetation indices’, Remote Sensing of Environment, vol. 83, pp. 195-213, DOI: 10.1016/s0034-4257(02)00096-2
-
ICMBio (Instituto Chico Mendes de Conservação da Biodiversidade). 2022, http://www.icmbio.gov.br
» http://www.icmbio.gov.br -
INPE (Instituto Nacional de Pesquisas Espaciais). 2024, Catálogo de Imagens do INPE, Inpe.br, https://www.dgi.inpe.br/catalogo/explore
» https://www.dgi.inpe.br/catalogo/explore - Liu, Q., Huang, C., Shi, Z. & Zhang, S. 2020, ‘Probabilistic River Water Mapping from Landsat-8 Using the Support Vector Machine Method’, Remote Sensing, vol. 12, no. 9, 1374, DOI: 10.3390/rs12091374
- Luciano, A.C. dos S., Campagnuci, B.C.G. & le Maire, G. 2022, ‘Mapping 33 years of sugarcane evolution in São Paulo state, Brazil, using Landsat imagery and generalized space-time classifiers’, Remote Sensing Applications: Society and Environment, vol. 26, 100749, DOI: 10.1016/j.rsase.2022.100749
- Maxwell, A.E. & Warner, T.A. 2020, ‘Thematic Classification Accuracy Assessment with Inherently Uncertain Boundaries: An Argument for Center-Weighted Accuracy Assessment Metrics’, Remote Sensing, vol. 12, no. 12, 1905, DOI: 10.3390/rs12121905
- Nasir, S.M., Kamran, K.V., Blaschke, T. & Karimzadeh, S. 2022, ‘Change of land use / land cover in Kurdistan Region of Iraq: A semi-automated object-based approach’, Remote Sensing Applications: Society and Environment, vol. 26, 100713, DOI: 10.1016/j.rsase.2022.100713
- Oldoni, L.V., Sanches, I.D., Picoli, M.C.A., Hugo, V. & Adami, M. 2022, ‘Geometric accuracy assessment and a framework for automatic sub-pixel registration of WFI images from CBERS-4, CBERS-4A, and Amazonia-1 satellites over Brazil’, Remote Sensing Applications: Society and Environment, vol. 28, 100844, DOI: 10.1016/j.rsase.2022.100844
-
Oliveira, V.Q. de, Pereira, A.M.L. & Parente, R.R. 2017, ‘A piscicultura na hidrelétrica Boa Esperança’, http://www.infoteca.cnptia.embrapa.br/infoteca/handle/doc/1102127
» http://www.infoteca.cnptia.embrapa.br/infoteca/handle/doc/1102127 - Pacheco, A. da P., Junior, J.A. da S., Ruiz-Armenteros, A.M. & Henriques, R.F.F. 2021, ‘Assessment of k-Nearest Neighbor and Random Forest Classifiers for Mapping Forest Fire Areas in Central Portugal Using Landsat-8, Sentinel-2, and Terra Imagery’, Remote Sensing, vol. 13, no. 7, 1345, DOI: 10.3390/rs13071345
- Pinto, C., Ponzoni, F., Castro, R., Leigh, L., Mishra, N., Aaron, D. & Helder, D. 2016, ‘First in-Flight Radiometric Calibration of MUX and WFI on-Board CBERS-4’, Remote Sensing, vol. 8, no. 5, 405, DOI: 10.3390/rs8050405
- Rajendiran, N. & Kumar, L.S. 2022, ‘Pixel Level Feature Extraction and Machine Learning Classification for Water Body Extraction’, Arabian Journal for Science and Engineering, DOI: 10.1007/s13369-022-07389-x
- Silva Júnior, J.A. da. 2024, ‘Avaliação de Índices Espectrais da Água Utilizando uma Cena Landsat-9: um Estudo de Caso em uma Região Semiárida’, Revista Brasileira de Cartografia, vol. 76, DOI: 10.14393/rbcv76n0a-72559
- Silva Júnior, J.A. da & Pacheco, A. da P. 2023, ‘Uso do classificador Support Vector Machines para o mapeamento da cobertura do solo usando imagens de Sensoriamento Remoto’, Revista Brasileira de Geografia Física, vol. 16, no. 3, pp. 1304-1319, DOI: 10.26848/rbgf.v16.3.p1304-1319
- Souza, C.M., Shimbo, J.Z., Rosa, M.R., Parente, L.L., Alencar, A.A., Rudorff, B.F.T., Hasenack, H., Matsumoto, M., Ferreira, L.G., Souza-Filho, P.W.M., de Oliveira, S.W., Rocha, W.F., Fonseca, A.V., Marques, C.B., Diniz, C.G., Costa, D., Monteiro, D., Rosa, E.R., Vélez-Martin, E. & Weber, E.J. 2020, ‘Reconstructing Three Decades of Land Use and Land Cover Changes in Brazilian Biomes with Landsat Archive and Earth Engine’, Remote Sensing, vol. 12, no. 17, 2735, DOI: 10.3390/rs12172735
- Sun, Y., Xiao, K., Wang, S. & Lv, Q. 2021, ‘An evolutionary many-objective algorithm based on decomposition and hierarchical clustering selection’, Applied Intelligence, vol. 52, no. 8, pp. 8464-8509, DOI: 10.1007/s10489-021-02669-9
- Talukdar, S., Singha, P., Shahfahad, Mahato, S., Praveen, B. & Rahman, A. 2020, ‘Dynamics of ecosystem services (ESs) in response to land use land cover (LU/LC) changes in the lower Gangetic plain of India’, Ecological Indicators, vol. 112, 106121, DOI: 10.1016/j.ecolind.2020.106121
- Tejasree, G. & Agilandeeswari, L. 2024, ‘Land use/land cover (LULC) classification using deep-LSTM for hyperspectral images’, The Egyptian Journal of Remote Sensing and Space Science, vol. 27, no. 1, pp. 52-68, DOI: 10.1016/j.ejrs.2024.01.004
- Vrabel, J.C., Stensaas, G.L., Anderson, C., Christopherson, J., Kim, M. & Park, S. 2022, ‘System characterization report on the Amazônia-1 multispectral sensor’, Open-File Report, DOI: 10.3133/ofr20211030n
- Wang, Y., Sun, Y., Cao, X., Wang, Y., Zhang, W. & Cheng, X. 2023, ‘A review of regional and Global scale Land Use/Land Cover (LULC) mapping products generated from satellite remote sensing’, ISPRS Journal of Photogrammetry and Remote Sensing, vol. 206, pp. 311-334, DOI: 10.1016/j.isprsjprs.2023.11.014
- Yuan, X., Tian, J. & Reinartz, P. 2023, ‘Learning-Based Near-Infrared Band Simulation with Applications on Large-Scale Landcover Classification’, Sensors (Basel, Switzerland), vol. 23, no. 9, 4179, DOI: 10.3390/s23094179
- Zafar, Z., Zubair, M., Zha, Y., Mehmood, M.S., Rehman, A., Fahd, S. & Nadeem, A.A. 2024, ‘Predictive modeling of regional carbon storage dynamics in response to land use/land cover changes: An InVEST-based analysis’, Ecological Informatics, vol. 82, 102701, DOI: 10.1016/j.ecoinf.2024.102701
All data included in this study are publicly available in the literature.