 Integration of Remote Sensing Data (Sentinel-2 and Alos Palsar) for Geological Prospecting of Limestone in the Apiaí/SP Region
Abstract
The Digital Image Processing (DIP) of satellite data constitutes a fundamental tool for the extraction and analysis of geospatial information, with multidisciplinary applications in remote sensing, precision agriculture, geology, and environmental studies. Among the DIP techniques applied to geological mapping, Principal Component Analysis (PCA) and RGB composites stand out for their efficiency in distinguishing different lithological bodies. The main objective of this study was, therefore, to consolidate the results of advanced DIP by combining multispectral imagery from the MSI/Sentinel-2 sensor with radar data derived from Alos Palsar. The research area is located in the municipality of Apiaí, in the Ribeira Valley (Southwest of SP), within the Ribeira Meridional Belt. The adopted methodology integrated MSI/Sentinel-2 and Alos Palsar data, primarily processed in the QGIS digital image processing plugins. For spectral enhancement, PCA and RGB composites were applied, complemented by Hillshade analysis for morpho-structural extraction. The synthesis of these products was then finalized in a GIS environment (ArcGIS). The integration of these multi-sensor datasets resulted in the mapping of six principal lithological units. The Limestone areas were delimited with high precision, taking advantage of the spectral contrast generated by PCA2 and the RGB composites. Additionally, the rugosity and Hillshade analysis revealed a strong NE-SW structural control governing the distribution of these units. The final geological map and the limestone potential map, validated through field campaigns, demonstrated the efficacy of the methodology for the accurate identification of lithological targets in areas of high vegetation density.
Keywords:
Geological mapping; Remote sensing; Principal component analysis
Resumo
O Processamento Digital de Imagens (PDI) de satélite constitui uma ferramenta fundamental para a extração e análise de informações geoespaciais, com aplicações multidisciplinares em sensoriamento remoto, agricultura de precisão, geologia e estudos ambientais. Entre as técnicas de processamento digital de imagens aplicadas ao mapeamento geológico, a Análise de Componentes Principais (ACP) e as composições RGB destacam-se pela sua eficiência na distinção de diferentes corpos litológicos. O objetivo principal deste estudo foi, portanto, consolidar os resultados do PDI avançado, combinando imagens multiespectrais do sensor MSI/Sentinel-2 com dados de radar ALOS PALSAR. A área de investigação localiza-se no município de Apiaí, no Vale do Ribeira (Sudoeste de SP), inserida no Cinturão Ribeira Meridional. A metodologia adotada integrou dados MSI/Sentinel-2 e ALOS PALSAR, processados primariamente nos complementos de processamento digital de imagens de QGIS. Para o realce espectral, aplicou-se a ACP e composições RGB, complementadas pela análise de Hillshade para a extração morfo-estrutural. A síntese desses produtos foi então finalizada em ambiente SIG (ArcGIS). A integração desses dados multissensoriais resultou no mapeamento de seis unidades litológicas principais. As áreas de Calcário foram delimitadas com alta precisão, aproveitando o contraste espectral gerado pela PCA2 e pelas composições RGB. Adicionalmente, a análise de rugosidade e Hillshade revelou um forte controle estrutural NE-SW que governa a distribuição das unidades. O mapa geológico final e o mapa de potencial calcário, validados com etapas de campo, demonstraram a eficácia da metodologia para a identificação precisa de alvos litológicos em regiões de alta densidade vegetal.
Palavras-chave:
Mapeamento geológico; Sensoriamento remoto; Análise de componentes principais
1 Introduction
Digital Image Processing (DIP) applied to remote sensing data has become one of the main tools for the extraction, analysis, and interpretation of geospatial information. Among its main applications are geology, precision agriculture, environmental monitoring, and territorial planning. The recent advance in the availability of orbital data with high spatial, spectral, and temporal resolution, combined with the development of more robust computational techniques, has enabled the generation of essential geospatial products, such as digital elevation models, spectral indices, and land use and land cover maps. This has significantly expanded the capacity for analyzing the Earth’s surface (Da Paz 2025; Bedini 2017; Ghamisi et al 2018).
In the context of geological mapping, spectral enhancement techniques play a fundamental role in the discrimination of lithological units. This is especially relevant in environments where surface exposure is limited. Among these techniques, Principal Component Analysis (PCA) and RGB color composites stand out, as they are widely used to reduce spectral redundancies and enhance contrasts between different geological materials (Pour & Hashim 2015; Bedini 2017; Pour et al. 2023; Rebouças et al. 2024). PCA allows the transformation of correlated spectral bands into statistically independent components. These correlations are grouped by concentrating most of the variance of the information in the first components, while subsequent components highlight subtle variations associated with specific mineralogical characteristics (Crosta 1992; Jensen 1996). In turn, RGB composites enable the combination of strategic spectral bands, facilitating visual interpretation and the identification of spectral patterns associated with different lithotypes, especially when combined with shortwave infrared (SWIR) bands, which are sensitive to mineral composition (Pour et al. 2023; Peyghambari & Zhang 2021).
In recent years, the MultiSpectral Instrument (MSI) sensor onboard the Sentinel-2 satellite has stood out as one of the main data sources for geological applications. This is due to its high spatial resolution (10-20 m) and the availability of spectral bands in the visible range, as well as in the near-infrared (NIR) and shortwave infrared (SWIR) ranges, which are particularly effective for detecting minerals and hydrothermal alterations (Bedini 2017; Immitzer et al. 2016; Chen et al. 2024). Similarly, synthetic aperture radar (SAR) sensors, such as ALOS PALSAR, have been widely used in morphostructural analysis. Their application stands out due to their ability to partially penetrate vegetation cover, in addition to providing detailed information on terrain roughness, structural lineaments, and geomorphological characteristics. One of their main advantages is the acquisition of such information regardless of atmospheric conditions (Rosenqvist et al. 2007; Ghamisi et al. 202018).
Despite significant advances in the individual use of these techniques and sensors, the systematic integration between multispectral optical data and radar data remains relatively limited, especially in studies focused on the discrimination of carbonate lithotypes in tropical regions. These regions are characterized by dense vegetation cover and, at times, high geomorphological complexity. Under such conditions, the spectral response of geological materials is often masked by environmental factors, including vegetation, soil moisture, and topographic shading, which hinder the direct identification of geological features (Bedini 2017; Chen et al. 2023, 2025). Thus, a scientific gap becomes evident, related to the integrated evaluation of the effectiveness of techniques such as PCA and RGB composites, particularly when combined with morphostructural attributes derived from SAR data, in the identification of carbonate rocks such as limestones.
Carbonate rocks, particularly limestones, have high economic relevance, being widely used in the cement industry, soil correction, and various industrial processes (Huynh 2025; Selim et al. 2020; Mohammed & Hazaa 2024). Therefore, the development of more efficient methodologies for their prospecting and mapping constitutes a strategic demand, especially in areas with still underexplored mineral potential (Muhammad 2018; Sun et al. 2024).
In this context, the present study proposes the integration of multisensor data, combining multispectral images from the MSI/Sentinel-2 sensor with radar data from the ALOS PALSAR sensor. This approach incorporates digital image processing (DIP) techniques, such as Principal Component Analysis (PCA), RGB composites, and terrain roughness analysis. The investigation is guided by the following central question: how can the synergistic integration between different digital processing techniques and data sources optimize the identification and characterization of geological targets in complex environments?
Thus, the main objective of this study is to consolidate an integrated methodological approach for the processing and analysis of orbital data, aiming at the delineation of areas with potential limestone occurrence in the Apiaí region, southwestern São Paulo State. Ultimately, the results contribute to advancing remote sensing applications in mineral prospecting by employing multi-technique DIP approaches in tropical environments, where environmental challenges (vegetation density and accessibility) often limit the effectiveness of conventional approaches.
2 Regional Geology
According to Silva et al. (2022), the investigation area is located in the Apiaí Terrane. This is a crucial portion of the Ribeira Belt and is dominated by a diversified geological framework. Structurally, the terrane is marked by intense deformation related to the Brasiliano Orogeny. This imposed a compressive regime with structures-oriented NE-SW. Among the predominant metamorphic units, metasediments stand out, such as schists, metasiltstones, and quartzites of the Água Clara Formation. Amphibolites from Serra da Boa Vista and pelitic rocks from the Bairro da Serra unit are also notable (Ribeiro 2024). The framework is further complemented by the presence of igneous intrusions, including mafic dikes, several granitic bodies (Cuellar 2019), and the Apiaí Gabbro.
A geological feature of particular interest is the occurrence of micritic to microcrystalline limestone lenses. These are associated with marbles of the Água Clara Formation (Cuellar 2019). These lenses, which may reach up to 5 meters in thickness, are preferentially found at contacts between schists and marbles. Their presence is recognized as a relevant stratigraphic marker, as well as a potential economic target for prospecting in the region. The geological framework also includes alluvial and Quaternary sedimentary deposits.
In the Apiaí region (Ribeira Belt), the geological framework is characterized by the presence of the Apiaí Gabbro and a complex metasedimentary sequence (Alita 2017). The area is dominated by phyllite units, which are low-grade metamorphic rocks (greenschist facies), rich in fine micaceous minerals (sericite and chlorite). These phyllites are interbedded with metarenites and metasiltstones in formations such as Água Clara and Votuverava. This lithological association reflects the original pattern of sediment deposition in basin environments, which was later intensely modified by deformation and metamorphic events related to the Brasiliano Orogeny.
The complexity of the geological framework of the study area is characterized by the association between metasedimentary units, igneous bodies, and carbonate lenses. This favors the application of remote sensing techniques. This application can be employed because these different lithologies present contrasting spectral responses. These contrasts occur mainly in the shortwave infrared (SWIR) regions. This ultimately allows their discrimination through multispectral orbital data. However, the identification of limestones in this context is not trivial. The carbonate lenses occur discontinuously. They frequently occur interlayered with schists, phyllites, and quartzites. They may also be subject to intense weathering, vegetation cover, and the presence of residual soils. These factors tend to mask or attenuate their spectral signatures. Thus, the detection of these bodies requires integrated approaches. It is necessary to combine different remote sensing products and spectral and morphological enhancement techniques.
3 Methodology and Data
3.1 Study Area
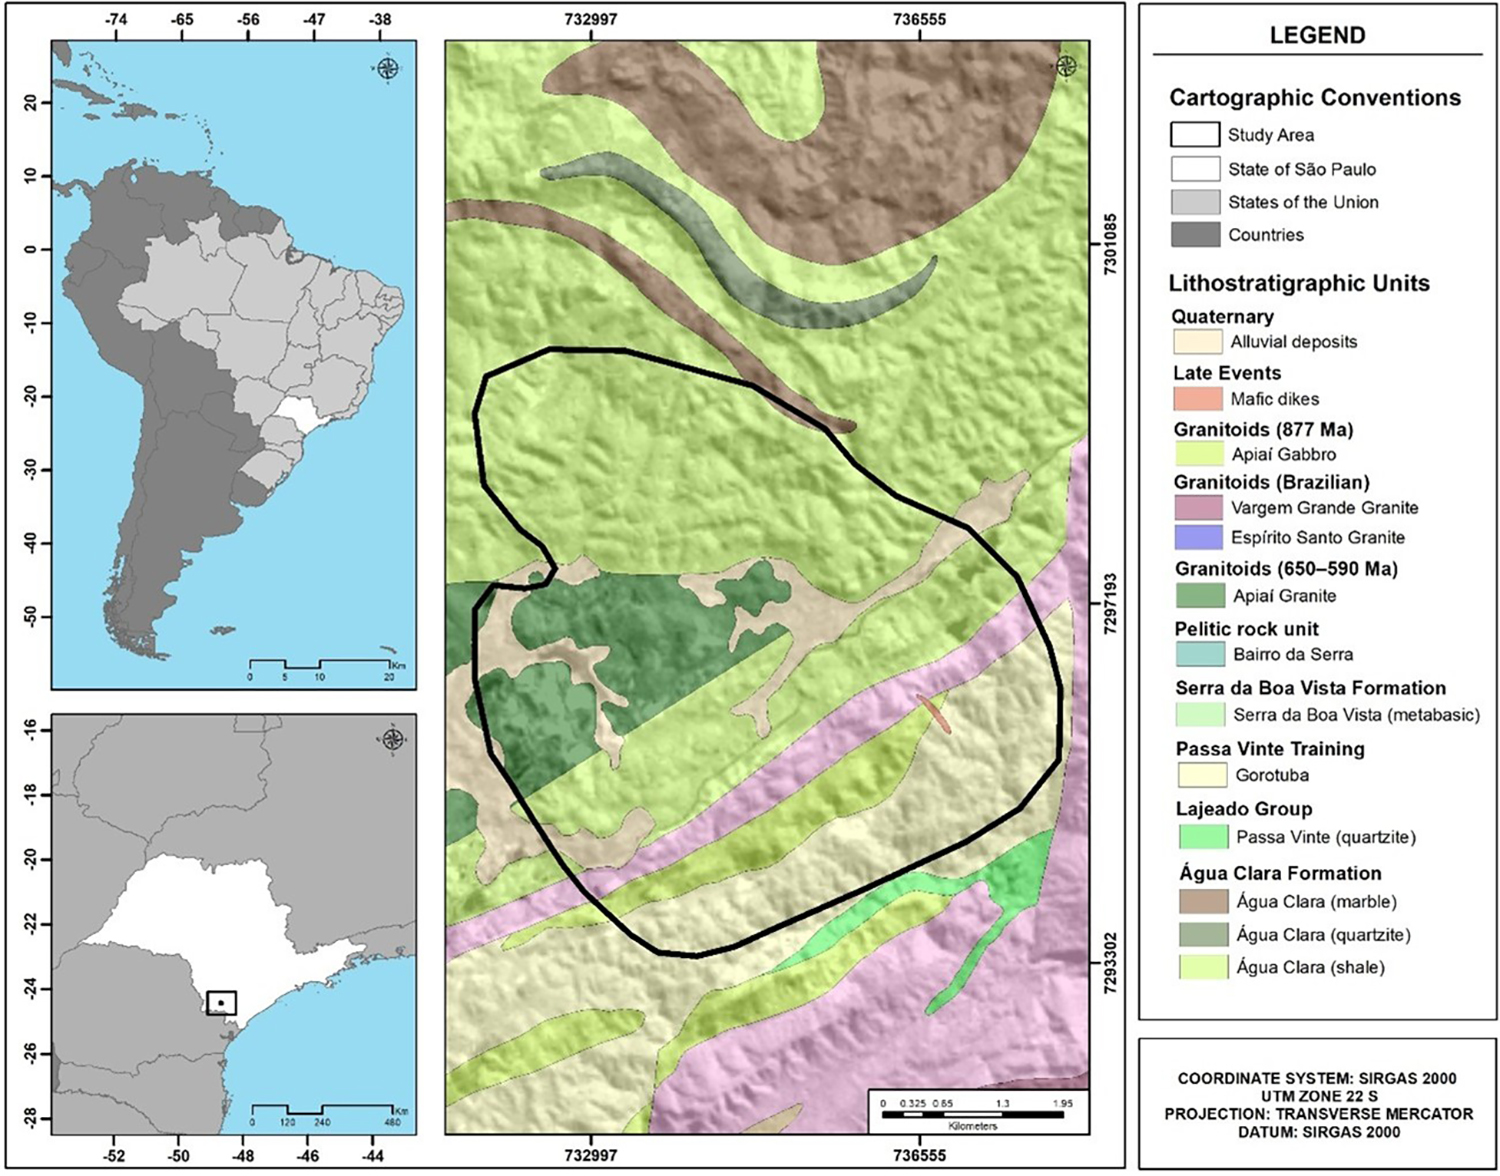
The study area is located in the municipality of Apiaí, within the geographical region of the Ribeira Valley, in the southwest of São Paulo state. This municipality borders the municipalities of Iporanga, Guapiara, and Ribeirão Branco, and is situated approximately 320 km from the capital city, São Paulo (Figure 1).

Location map of the study area, showing the route from São Paulo to Apiaí, SP. Adapted from Faleiros et al. (2012) .
3.2 Database and Techniques Used
All digital image processing (DIP) was carried out within the Geographic Information System (GIS) environment of the QGIS software. Within this environment, the stages of interpretation, vectorization (shapefiles), and the production of thematic maps were also conducted. The Semi-Automatic Classification Plugin plugin was also used to assist in the pre-processing and manipulation of orbital data.
The methodological workflow adopted in this study was structured into four main stages: (i) acquisition and pre-processing of orbital data; (ii) spectral enhancement through Principal Component Analysis (PCA) and RGB composites; (iii) morphostructural analysis based on radar data; and (iv) integration of products for the identification of areas with potential limestone occurrence. Subsequently, a field validation stage was conducted, along with a comparison with existing geological data.
3.2.1 Sentinel-2 Orbital Imagery (MSI)
The multispectral image used (T22KGU_20240816T132231) was acquired through the Copernicus Data Space Ecosystem. The selected date corresponds to August 16, 2024, a period associated with the dry season in the southwestern region of the state of São Paulo. This condition was strategically selected to reduce the interference of vegetation cover and surface moisture, thus favoring the spectral discrimination of geological targets.
Initially, atmospheric correction was performed using the Dark Object Subtraction (DOS) method. This correction was intended to minimize atmospheric scattering effects, as well as to improve the radiometric quality of the data. Subsequently, the spectral bands were organized and prepared for processing within the GIS environment.
The selection of spectral bands (B2, B4, B8, B11, and B12) was based on the expected spectral behavior of carbonates, particularly in the short-wave infrared (SWIR) region, as these materials present diagnostic features associated with carbonate mineral absorption. The visible bands (B2 and B4) were used for surface cover discrimination, while the near-infrared band (B8) contributed to the separation of vegetated areas. The SWIR bands (B11 and B12) were fundamental for identifying spectral signatures related to limestones.
After pre-processing, spectral enhancement techniques were applied, including Principal Component Analysis (PCA). An RGB composite was also generated (R: band 5, G: band 6, B: band 7). PCA was performed using the correlation matrix, with the objective of reducing spectral redundancies and concentrating data variability in the first components. The principal components were analyzed based on the explained variance, prioritizing those that best highlighted lithological contrasts, as well as those that minimized interferences associated with vegetation and moisture.
3.2.2 ALOS PALSAR Radar Data
The ALOS PALSAR radar data (AP_13828_FBD_F6690_RT1) were obtained from the NASA Earthdata portal. These data were used for morphostructural analysis of the study area. The sensor operates in the L-band (1.27 GHz), with a spatial resolution of 12.5 meters in Fine Beam Dual (FBD) mode. It is suitable for geological studies in areas with vegetation cover.
From these data, derived products were generated, including digital elevation models and terrain roughness analyses. Artificial shading (hillshade) techniques were applied with parameters of 45° azimuth and 30° incidence angle. This application aimed to enhance subtle geomorphological features.
The extraction of structural lineaments was performed through visual interpretation. It was based on the identification of linear patterns associated with structural discontinuities, such as fractures, faults, and lithological contacts. This approach was adopted due to its efficiency in complex geological contexts, as automatic methods may generate noise or misleading interpretations.
3.2.3 Data Integration and Interpretation Criteria
The products derived from spectral (PCA and RGB) and morphostructural (roughness and lineaments) analyses were initially analyzed individually, aiming to understand the specific contributions of each technique. Subsequently, these products were integrated within the GIS environment through spatial analysis and joint visual interpretation.
The methodological integration was based on the principle of complementarity between optical and radar data. While optical data (Sentinel-2) are sensitive to the spectral properties of surface materials, radar data (PALSAR) provide information on terrain geometry and geological structures, independently of atmospheric conditions and with reduced influence from vegetation cover. Recent studies highlight that the combination of these approaches significantly increases reliability in lithotype discrimination in complex environments.
In the context of this study, areas with potential limestone occurrence were identified based on the convergence of multiple criteria, including: (i) specific spectral responses in SWIR bands and in principal components associated with carbonate minerals; (ii) characteristic color patterns in RGB composites; (iii) low to moderate terrain roughness associated with carbonate surfaces; and (iv) spatial association with geological structures, such as lineaments and lithological contacts.
The spectral identification of limestones was mainly based on their differentiated response in the SWIR region. This response is due to the presence of the carbonate group (CO₃²⁻), as carbonates influence reflectance at wavelengths near 2.3 µm. However, due to the occurrence of these rocks in discontinuous lenses and frequently associated with other lithologies, in addition to the influence of factors such as weathering and vegetation cover, detection based solely on spectral data proved insufficient. Thus, integrated analysis was essential to reduce ambiguities and increase the reliability of interpretation.
3.2.4 Validation
The obtained results were validated through fieldwork. In this stage, lithological occurrences interpreted from the generated products were verified. The results were also compared with available geological mapping data. For this purpose, information from the CPRM was used to assess the spatial consistency of areas identified as potential limestone occurrences.
4 Results
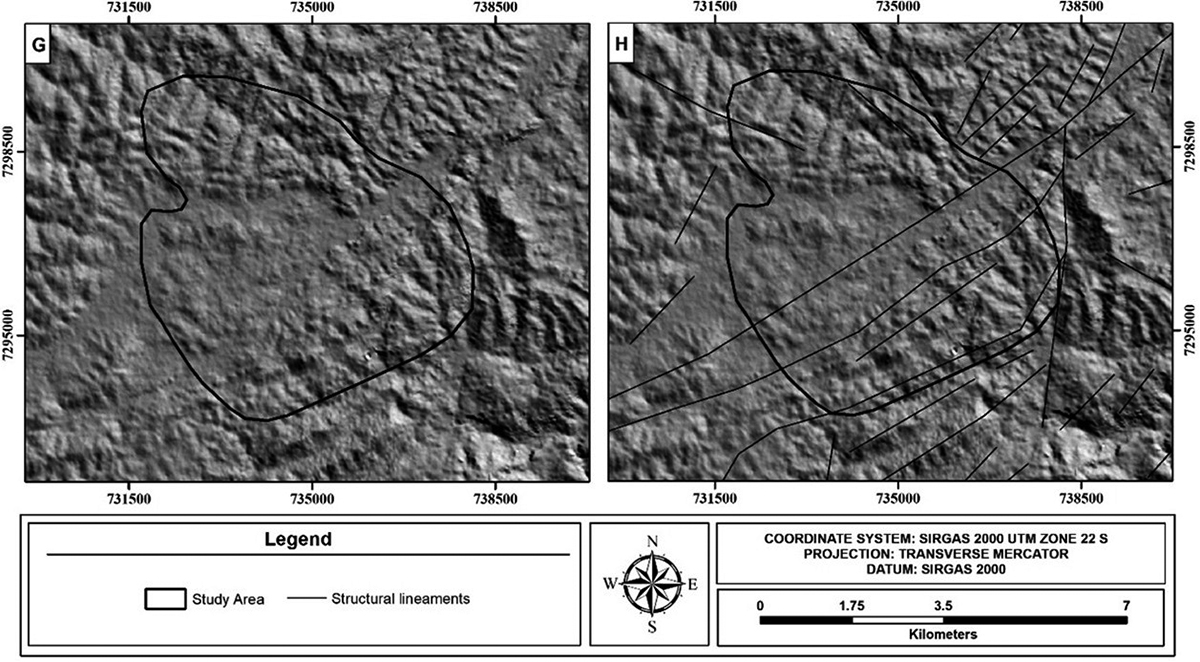
The hillshade technique was applied to the Digital Elevation Model (DEM). For this purpose, an azimuth of 45° and an incidence angle of 30° were used. This configuration allowed the enhancement of subtle variations in the terrain. It also favored the identification of structural discontinuities, as the adopted parameters are oblique to the predominant structural directions of the area.
The generated product (Figure 2.G) highlighted slope variations and linear patterns. This enabled the visual identification and subsequent vectorization of structural lineaments (Figure 2.H). The mapped lineaments present a spatial organization consistent with the regional structural pattern.
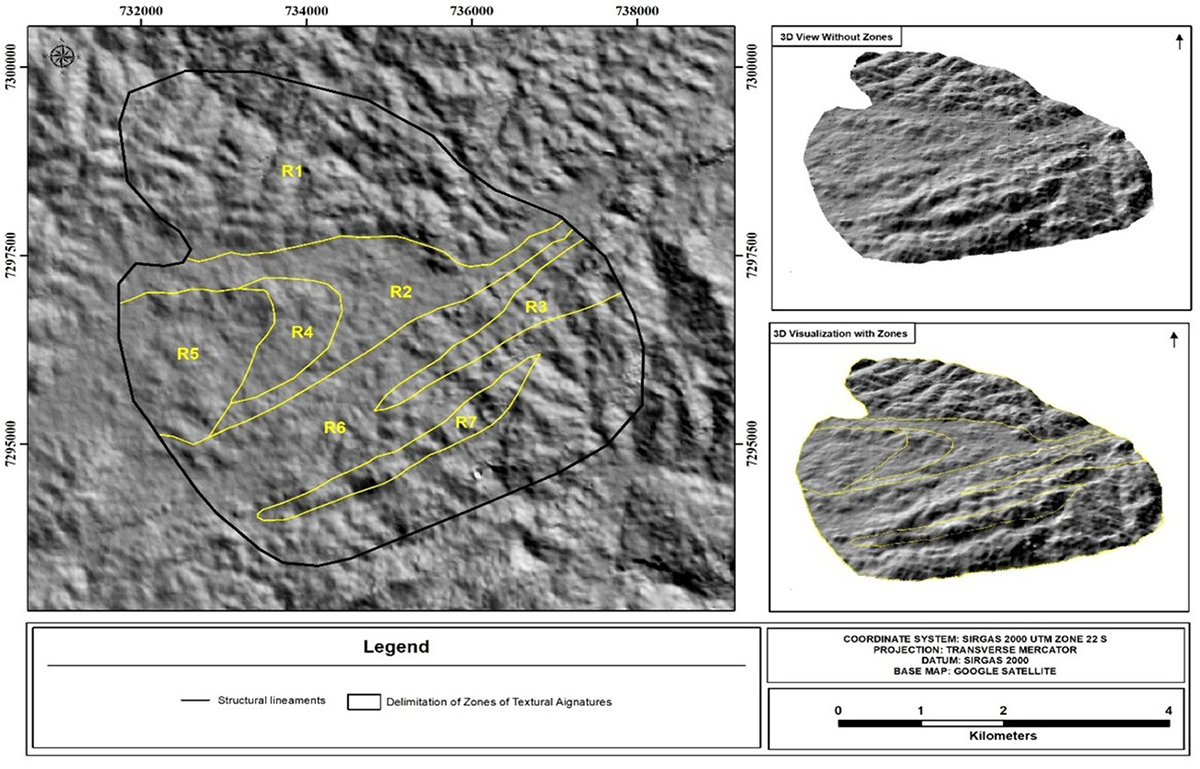
The terrain roughness analysis (Figure 3) allowed the distinction of different textural domains. Class R1 exhibited high roughness and a chaotic dissection pattern. Classes R2 and R3 showed low roughness and structural anisotropy marked by parallel lineaments. Classes R4 and R6 presented intermediate roughness. Class R7 was characterized by a robust texture and lower lineament density, whereas Class R5 displayed a homogeneous and diffuse textural pattern.

Interpretation of the most prominent lineaments and structures using the Hillshade technique with an azimuth of 45º and incidence of 30º.

Delimitation of zones of textural signatures of the terrain extracted through the Radar image of the Alos satellite Palsar sensor with artificial light in the azimuth of 45° and 30° of incidence.
4.2 RGB Color Composition
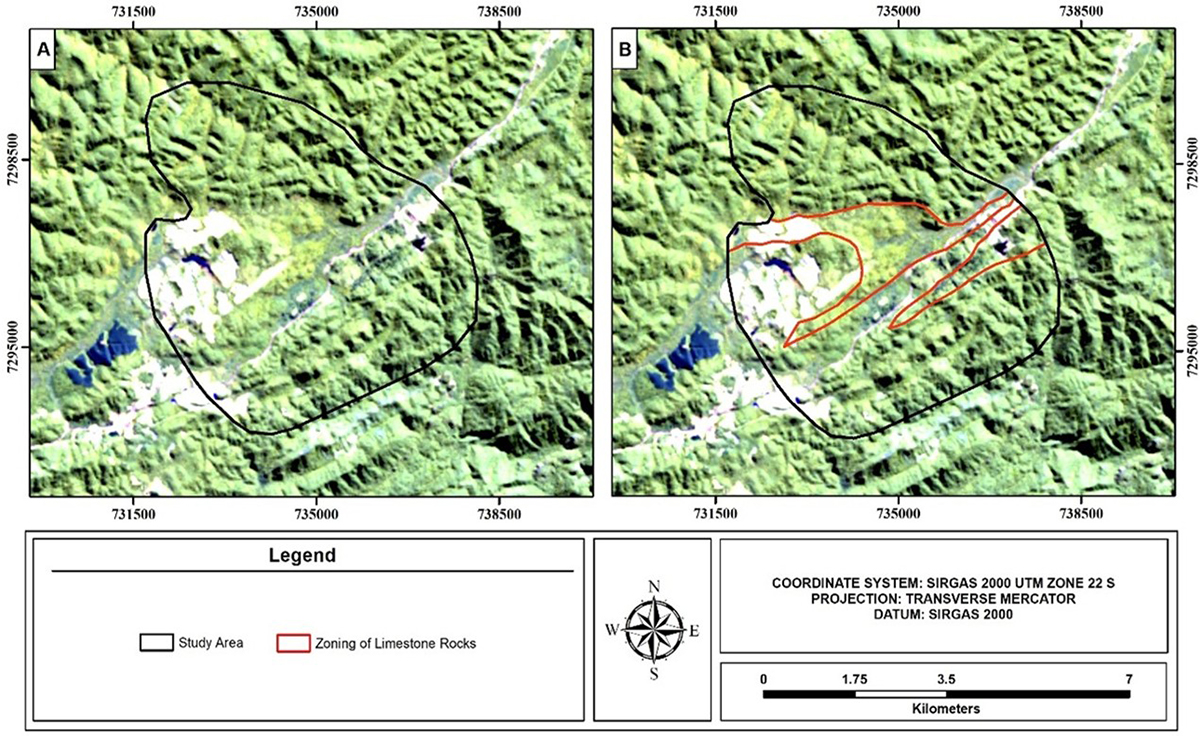
RGB composition using the R(5), G(6) and B(7) bands of the MSI/Sentinel-2 sensor allowed the identification of areas with contrasting spectral responses (Figure 4).
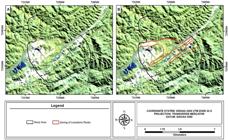
The delimited areas presented shades ranging from white to light blue, standing out in relation to the surrounding vegetation, characterized by intense green tones. These areas were spatially delimited as zones of lithological interest based on their differentiated spectral response.
4.3 Principal Component Analysis (PCA)
Principal Component Analysis was applied to bands B2, B4, B8, B11, and B12. PCA-1 concentrated 97.20% of the total variance of the data, while PCA-2 concentrated 1.89% (Table 1).
The eigenvectors of PCA-2 indicated negative weights in the visible/VNIR bands and high positive weights in the SWIR bands. This distribution resulted in prominent spatial contrast in the image (Figure 5), allowing the delimitation of areas with distinct spectral responses.

4.4 Mapa Geológico Final e Potencial de Calcário
A integração dos produtos derivados (rugosidade, RGB e PCA) resultou na elaboração do mapa litológico final (Figura 6.I). Foram identificadas seis unidades principais: calcário, xisto, metarenito, filito, gabro e granito.
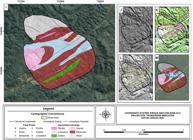
Final lithological map and sequence of supporting data products for interpretation. Panel I: final map of the area. Panels J to M: products used in the interpretation: J) Terrain roughness; K) RGB color composite; L) PC-2 image; M) Field sampling points.
The units exhibit a spatial distribution with a preferential NE-SW orientation. The areas interpreted as limestone display an elongated geometry and occur intercalated with metasedimentary units.
Validation was performed using field data, whose points showed spatial correspondence with the mapped units (Figure 6.M).
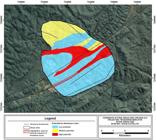
The limestone potential map (Figure 7) was elaborated based on the classification of lithological units. High-potential areas correspond to zones mapped as limestone. Medium-potential areas include metarenites and adjacent pelitic units. Low-potential areas correspond to igneous units.
5 Discussions
The integration of multispectral optical data with radar data proved effective in discriminating lithological units in geologically complex environments. Recent studies reinforce this approach by highlighting the role of multi-sensor integration in advancing geological mapping (Chen et al. 2023, 2024). This strategy is particularly relevant in regions with vegetation cover, especially where the spectral response of geological materials is frequently masked.
In the present study, terrain roughness analysis derived from radar data proved fundamental as a geomorphological indicator for lithological differentiation. The relationship between surface texture and rock competence is widely recognized, as more resistant lithologies tend to present more homogeneous and structurally controlled surfaces, whereas less competent rocks result in more dissected patterns (Da Paz 2025). In addition, the use of data from the ALOS PALSAR sensor reinforces this analysis, since SAR sensors are capable of providing structural information even under vegetation cover. This capability is due to their partial penetration through the canopy and independence from atmospheric conditions (Rosenqvist et al. 2007).
The spectral analysis based on the RGB composition (R5-G6-B7) highlighted marked contrasts associated with limestones. This condition resulted from the characteristic response of carbonates in the shortwave infrared (SWIR) region. This behavior is directly related to the presence of the carbonate group (CO₃²⁻), whose mineralogical properties control diagnostic absorption features, as widely discussed in remote sensing studies applied to mineral prospecting (Pour & Hashim, 2015; Peyghambari & Zhang 2021; Bedini 2017). The efficiency of this approach is also consistent with applications aimed at limestone mapping for industrial purposes, as demonstrated by Selim et al. (2020).
However, the identification of limestones in natural environments is not trivial. Recent studies indicate that factors such as vegetation cover, weathering, and spectral mixing can significantly reduce the detectability of these targets (Chen et al. 2023, 2025). In the present study, this limitation was evidenced by the occurrence of limestones in discontinuous lenses interbedded with metasediments, reinforcing the need for integrated approaches.
In this context, Principal Component Analysis (PCA) played an essential role in enhancing spectral contrast. The selection of PCA-2 was methodologically consistent, as secondary components tend to concentrate uncorrelated information and subtle variations associated with mineralogical composition (Jensen 1996; Ghamisi et al. 2018). The observed eigenvector distribution, with negative weights in the visible and positive weights in the SWIR, is consistent with the expected spectral behavior of carbonates.
The generated products showed interdependence, which constitutes one of the main methodological advances of this study. While optical data are sensitive to the spectral properties of surface materials, radar data provide information on terrain geometry and geological structures. This integration is widely recommended in recent studies, which highlight significant gains in lithological mapping accuracy when multiple data sources are used (Chen et al. 2025; Sun et al. 2024).
Furthermore, the identification of spectral and morphostructural patterns associated with limestones in this study is aligned with recent investigations, emphasizing the importance of integrated analysis in detecting lithological transitions and mineralized zones, especially at contacts between igneous and carbonate units (Huynh et al. 2025).
From an applied perspective, the delimitation of areas with potential limestone occurrence has high economic relevance, especially considering its wide use in the cement industry and industrial processes (Muhammad 2018; Mohammed & Hazaa 2024). The application of remote sensing techniques allows optimization of mineral prospecting, consequently reducing costs and directing field campaigns more efficiently.
The validation of results through fieldwork and comparison with CPRM data reinforces the reliability of the adopted methodology. The spatial coherence between validated points and interpreted units confirms the effectiveness of the integrated approach.
Finally, the results obtained are consistent with recent trends in mineral prospecting, which point to the increasing use of integrated techniques and approaches based on artificial intelligence and deep learning (Sun et al. 2024). In this sense, the present study establishes a robust methodological foundation, with potential for future applications in predictive modeling and automation of geological mapping.
5 Conclusion
The multisensor integration of Digital Image Processing (DIP) products has solidified its role as a suitable methodology for geological prospecting in highly complex environments. PCA-2, strategically chosen for its ability to enhance non-correlated spectral information, and the RGB Composite [R (5), G (6), B (7)], which leveraged the high reflectance of limestone in the SWIR range, were fundamental in the precise delimitation of carbonatic units. This spectral mapping was complemented by the analysis of terrain rugosity and structural lineaments derived from the Alos Palsar sensor, which revealed a strong NE-SW regional tectonic control directly influencing the distribution and morphology of the lithological units, such as the Gabbro and folded marbles.
The applied methods resulted in a robust potential map, where High potential zones correspond directly to calcitic limestone occurrences, validated by high concordance with field sample data. This classification, which assigned medium potential to adjacent metasedimentary sequences (phyllites/metarenites) and low potential to sterile igneous bodies, demonstrated the capacity of DIP to not only map lithologies but also to optimize mineral prospecting at a regional scale. Essentially, the study transformed spectral variance and relief rugosity into replicable knowledge, serving as a solid geoscientific foundation for future investigations. Thus, the delimitation of carbonatic bodies proves that the multisensor integration between radar data (rugosity/Hillshade) and multispectral data (RGB and PCA) is the most robust approach for geological mapping in tropical regions, where high vegetation density typically masks surface features.
Although the results were satisfactory and the final map is validated by field points, the refinement of lithological characterization requires complementary approaches. It is suggested that future research stages focus on detailed geochemical and mineralogical analyses. The application of these techniques will allow for a more precise discrimination between subtypes of limestone and associated carbonates, expanding the understanding of unit composition and enhancing lithological zoning to meet specific mineral exploration demands. This final multidisciplinary approach will be essential to consolidate the discoveries obtained by remote sensing.
References
- Alita, T.T. 2017, ‘Hydrothermal skarn-type alteration at the intrusive contact of the Apiaí Gabbro and Metasediments of the Gorutuba Formation: Apiaí-SP Municipality’, Universidade de São Paulo.
-
Amer, R., Kusky, T.M. & Ghulam, A. 2010, ‘New methods of processing ASTER data for lithological mapping: examples from Fawakhir, Central Eastern Desert of Egypt’, Journal of African Earth Sciences, vol. 56, no. 2-3, pp. 75-82, DOI: 10.1016/j.jafrearsci.2009.06.004
» https://doi.org/10.1016/j.jafrearsci.2009.06.004 -
Bedini, E. 2017, ‘The use of hyperspectral remote sensing for mineral exploration: a review’, Journal of Hyperspectral Remote Sensing, vol. 7, no. 4, pp. 189-211, DOI: 10.29150/jhrrs.v7.4.p189-211
» https://doi.org/10.29150/jhrrs.v7.4.p189-211 -
Chen, W., Li, X., Qin, X. & Wang, L. 2024, ‘Geological remote sensing: an overview’, in Remote Sensing Intelligent Interpretation for Geology, DOI: 10.1007/978-981-99-8997-3_1
» https://doi.org/10.1007/978-981-99-8997-3_1 - Chen, Y., Liu, G., Song, Z., Li, M., Wang, M., & Wang, S. 2025, ‘Lithological mapping in high-vegetation areas using Sentinel-2, Sentinel-1, and digital elevation models’, Sensors, vol. 25, no. 7, p. 2136.
- Chen, Y., Wang, Y., Zhang, F., Dong, Y., Song, Z., & Liu, G. 2023, ‘Remote sensing for lithology mapping in vegetation-covered regions: methods, challenges, and opportunities’, Minerals, vol. 13, no. 9, p. 1153.
- Crosta, A.P. 1992, ‘Processamento digital de imagens de sensoriamento remoto’, Instituto de Geociências, UNICAMP, Campinas.
- Cuellar, B.S.A. 2019, ‘Petrography and geochemistry of the Apiaí Granite-southern state of São Paulo’, 2019. Master dissertation, Universidade de São Paulo.
- Da Paz, A.R. 2025, Digital Elevation Models for Environmental Studies, Springer Nature.
- Faleiros, F.M., Morais, S.M. & Costa, V.S. 2012, Geology and mineral resources of the Apiaí SG.22-X-B-V sheet: scale 1:100,000, CPRM, São Paulo.
- Ghamisi, P., Yokoya, N., Li, J., Liao, W., Liu, S., Plaza, J., Rasti, B., & Plaza, A. 2018, ‘Advances in hyperspectral image and signal processing: a comprehensive overview of the state of the art’, IEEE Geoscience and Remote Sensing Magazine, vol. 5, no. 4, pp. 37-78.
- Huynh, H. H., Yu, J., Wang, L., Pham, T. H., & Lee, J. Y. 2025, ‘Detection of mineralogical and lithological transitions in igneous intrusion-limestone boundaries using close-range hyperspectral remote sensing: a resource perspective’, International Journal of Applied Earth Observation and Geoinformation, vol. 142, p. 104719.
-
Immitzer, M., Vuolo, F. & Atzberger, C. 2016, ‘First experience with Sentinel-2 data for crop and tree species classifications in central Europe’, Remote Sensing, vol. 8, no. 3, p. 166, DOI: 10.3390/rs8030166
» https://doi.org/10.3390/rs8030166 - Jensen, J.R. 1996, Introductory digital image processing: a remote sensing perspective, Prentice Hall, Upper Saddle River, New Jersey.
-
Mohammed, O. & Hazaa, S. 2024, ‘Evaluation of clay deposits and limestone for the manufacture of ordinary Portland cement in the Bazian Basin, Northern Iraq’, Iraqi Geological Journal, vol. 57, no. 2F, pp. 39-55, DOI: 10.46717/igj.57.2F.4ms-2024-12-14
» https://doi.org/10.46717/igj.57.2F.4ms-2024-12-14 -
Muhammad, U.L. 2018, ‘Limestone as solid mineral to develop national economy’, American Journal of Physical Chemistry, vol. 7, no. 2, p. 23, DOI: 10.11648/j.ajpc.20180702.13
» https://doi.org/10.11648/j.ajpc.20180702.13 -
Peyghambari, S. & Zhang, Y. 2021, ‘Hyperspectral remote sensing in lithological mapping, mineral exploration, and environmental geology: an updated review’, Journal of Applied Remote Sensing , vol. 15, no. 3, p. 031501, DOI: 10.1117/1.JRS.15.031501
» https://doi.org/10.1117/1.JRS.15.031501 -
Pour, A.B. & Hashim, M. 2015, ‘Hydrothermal alteration mapping from Landsat-8 data, Sar Cheshmeh copper mining district, south-eastern Islamic Republic of Iran’, Journal of Taibah University for Science, vol. 9, no. 2, pp. 155-166, DOI: 10.1016/j.jtusci.2014.11.008
» https://doi.org/10.1016/j.jtusci.2014.11.008 -
Pour, A.B., Ranjbar, H., Sekandari, M., Abd El-Wahed, M., Hossain, M.S., Hashim, M., Yousefi, M., Zoheir, B., Wambo, J.D.T., & Muslim, A.M. 2023, ‘Remote sensing for mineral exploration’, in Geospatial Analysis Applied to Mineral Exploration. https://doi.org/10.1016/B978-0-323-95608-6.00002-1
» https://doi.org/10.1016/B978-0-323-95608-6.00002-1 -
Rebouças, I.S., Hühn, S.R.B., Miranda, M.P., Salgueiro, A.R.G.N.L., Sales, K.C.P., & Duarte, C.R. 2024, ‘Integração de dados remotos sensoriais e aerogeofísicos aplicados na caracterização geológica do segmento Ipueira-Medrado, Andorinhas/BA’, Anuário do Instituto de Geociências , vol. 47. https://doi.org/10.11137/1982-3908_2024_47_56967
» https://doi.org/10.11137/1982-3908_2024_47_56967 - Ribeiro, A.C.G. 2024, ‘Geochemistry and interpretation of the metabasic rocks of the Água Clara Formation, Southern State of São Paulo’, Universidade de São Paulo.
- Rosenqvist, A., Shimada, M., Ito, N., & Watanabe, M. 2007, ‘ALOS PALSAR: a pathfinder mission for global-scale monitoring of the environment’, IEEE Transactions on Geoscience and Remote Sensing , vol. 45, no. 11, pp. 3307-3316.
-
Selim, E.S.I., Aboelkhair, H. & Aboezz, E.R. 2020, ‘Mapping and assessing limestone as a raw material for the cement industry using satellite data: a case study of areas between Riyadh and Al Kharj, Saudi Arabia’, Arabian Journal of Geosciences, vol. 13, no. 17, p. 892, DOI: 10.1007/s12517-020-05865-y
» https://doi.org/10.1007/s12517-020-05865-y - Silva, M.P., Oliveira, A.A., Caltabellotta, F.P., Faleiros, F.M., & Campanha, G.A.C. 2022, ‘Carta geológica e de recursos minerais: folha SG.22-X-B-II Guapiara’, CPRM, São Paulo .
- Sun, K., Chen, Y., Geng, G., Lu, Z., Zhang, W., Song, Z., Guan, J., Zhao, Y., & Zhang, Z. 2024, ‘A review of mineral prospectivity mapping using deep learning’, Minerals , vol. 14, no. 10, p. 1021.
-
USGS (United States Geological Survey) 2025, Earth Explorer, viewed 13 May 2025, USGS (United States Geological Survey) 2025, Earth Explorer, viewed 13 May 2025, http://earthexplorer.usgs.gov/
» http://earthexplorer.usgs.gov/
-
Data availability statement
The data used in the work in question can be obtained through the United States Geological Survey (USGS; https://www.usgs.gov) and Alaska Satellite Facility (ASF; https://asf.alaska.edu) websites to acquire satellite image data.
-
Funding information
For development, it had the institutional support of the School of Engineering of the Federal University of Minas Gerais (UFMG) through CEERMIN (Specialization Course in Mineral Resources Engineering).
The data used in the work in question can be obtained through the United States Geological Survey (USGS; https://www.usgs.gov) and Alaska Satellite Facility (ASF; https://asf.alaska.edu) websites to acquire satellite image data.