 Natural Regeneration of the Caatinga Detected Through NDVI in the Pedra da Andorinha Conservation Unit, Sobral - Ceará
Abstract
The removal of native vegetation for human occupation and development of agropastoral activities end up making the local soil degraded. The Conservation Unit Refúgio De Vida Silvestre Pedra da Andorinha, located in the district of Taperuaba, municipality of Sobral, state of Ceará, is inserted in the Caatinga Biome, and due to the anthropic actions and the great importance of the biodiversity existing there was established as a protection area. This case study aimed to observe the process of natural regeneration in REVIS Pedra da Andorinha in the period from 1999 to 2019, with images from the Landsat series and using the Normalized Difference Vegetation Index (NDVI). Five classes of land use were established in order to obtain a visualization of land use both qualitatively and quantitatively and thus measure, in percentage terms, the gains and losses of vegetation within the space-time studied. The accuracy of the land cover classification was measured using the Kappa index. The results obtained showed that the study site presented a successful vegetative regeneration between the years 1999 and 2019. With a Kappa value of 1.0 and a Global Efficiency of 100%, the validation of the results showed equally excellent quality for both years, ensuring the reliability of the study. The present work highlighted the importance of the application of geoprocessing, performed through remote sensing, to be a tool of great potential for environmental analysis. The use of orbital images presents as advantages its ease and simplicity in obtaining the results, thus offering a better direction in the decision making of recovery and/or plant protection. REVIS Pedra da Andorinha presents few publications of studies, even with its landscape distinction. In view of this, this work is of fundamental importance for a source of research on the area.
Keywords:
Remote sensing; Biodiversity; Semiarid
Resumo
A remoção da vegetação nativa para ocupação humana e desenvolvimento de atividades agropastoris acabam tornando o solo local degradado. A Unidade de Conservação Refúgio De Vida Silvestre Pedra da Andorinha, localizada no distrito de Taperuaba, município de Sobral, estado do Ceará, encontra-se inserida no Bioma Caatinga e devido às ações antrópicas e a grande importância da biodiversidade ali existente foi instituída como área de proteção. Este estudo de caso objetivou observar o processo de regeneração natural na REVIS Pedra da Andorinha no período de 1999 a 2019, com imagens da série Landsat e utilizando o Índice de Vegetação por Diferença Normalizada (NDVI). Foram estabelecidas cinco classes de ocupação do solo a fim de se obter uma visualização do uso do solo tanto de forma qualitativa quanto quantitativa e assim mensurar, em termos percentuais, os ganhos e perdas de vegetação dentro do espaço-temporal estudado. A acurácia da classificação de ocupação do solo foi mensurada através da aplicação do índice Kappa. Os resultados obtidos demonstraram que o local de estudo apresentou uma exitosa regeneração vegetativa entre os anos de 1999 e 2019. Com um valor de Kappa 1.0 e Eficiência Global de 100% a validação dos resultados demonstrou uma qualidade igualmente excelente para ambos os anos assegurando a confiabilidade do estudo. O presente trabalho destacou a importância da aplicação do geoprocessamento, realizado por meio de sensoriamento remoto, ser uma ferramenta de grande potencial para análise ambiental. O uso de imagens orbitais apresenta como vantagens a sua facilidade e simplicidade na obtenção dos resultados, oferecendo assim um melhor direcionamento na tomada de decisões de recuperação e/ou proteção vegetal. A REVIS Pedra da Andorinha apresenta poucas publicações de estudos, mesmo com sua distinção paisagística. Em vista disso, este trabalho se mostra de fundamental importância para fonte de pesquisa a respeito da área.
Palavras-chave:
Sensoriamento remoto; Biodiversidade; Semiárido
1 Introduction
With the mastery of technique and adaptation to the environment, man began to settle in certain geographical spaces. Consecutively, the reduction of the vegetation cover of the modified land alters the dynamics of local and regional ecosystems. The excessive use of natural resources has generated on the earth environmental degradation in which man is the main responsible (Rubira 2016).
To monitor the process of vegetation cover change, remote sensing, a term coined in the early 1960s by Evelyn L. Pruit and collaborators, has stood out as one of the most successful automatic data collection technologies for the survey and monitoring of land resources (Ferreira 2019). For Ponzoni (2002) the techniques of remote sensing are based on a process of interaction between electromagnetic radiation and the different objects that are intended to be studied.
Also according to Ponzoni (2002) the application of these techniques is made possible through the fulfillment of several steps that include the interaction itself, characterized mainly by the phenomenon of radiation reflection, the collection of data and its registration through a sensor and the analysis of these data in order to extract the intended information from a given object. In summary, sensors capture data from the interaction of electromagnetic radiation with objects and phenomena on the surface (Andrade 2011).
Araújo and Fonseca (2016) citing Ehlers (2007) point out that the satellites of the Landsat series are the ones that offer the greatest regional coverage, thus having an attractive cost/benefit ratio, being a source of information for many environmental applications, as they have good geometric and radiometric quality, thus becoming an ideal tool in terrestrial surface monitoring programs.
For Resende et al. (2015) several spectral indices were created in order to monitor vegetation cover, measure vegetation density and vegetative vigor and detect post-fire effects on vegetation. According to Oliveira et al. (2022) among the various vegetation indices, the Normalized Difference Vegetation Index (NDVI) for presenting a strong ability to point out the natural dynamics of the caatinga vegetation between the periods before and after the drought in the semi-arid zone of the northeast apud (Fensholt et al. 2006). This index is the most used for vegetation analysis.
Silva et al. (2019) when citing Bezerra et al. (2014) describes that the NDVI is a vegetation index that varies between the values of -1 and 1. Being the closer to 1, the greater the indication of vegetative activity, that is, there is strong chlorophylline activity. On the other hand, the negative values of the NDVI indicate areas of water bodies and values close to and in the range of zero indicate areas with little or no vegetation, that is, there is little or no chlorophilian activity.
Silva (2020) citing Lopes et al. (2010) mentions that NDVI is a simple method with high sensitivity in the evaluation of the density of vegetation cover, ensuring the supervision of vegetation, being therefore a primordial biophysical pointer to the studies of evaluation and seasonal and inter annual supervision of environmental degradation. Ferreira (2019) says that for vegetation, in general, high NDVI values indicate health and density, while low values characterize a stressed and sparse vegetation.
The indiscriminate use of the land with the removal of native vegetation, causes its degradation. According to Carvalho et al. (2010) the main techniques of recovery of degraded areas are, direct techniques, indirect techniques, silvopastoral system-SSP, already Rodrigues, Giuliatti & Júnior (2020) highlight that direct sowing is practiced in 60% in the recovery process of the caatinga biome.
The technologies, in turn, have provided great contributions in the detection of spatio-temporal changes caused by anthropic actions in the environment. According to Rodrigues and Lima (2015) the process of use and occupation of Taperuaba and part of the sub-basin of the Bom Jesus River, are linked to the practice of subsistence agriculture through the felling and burning of vegetation and the use of weeding for the cultivation of corn, beans and cotton.
The choice of the area Conservation Unit - UC Pedra da Andorinha is justified by its recent implementation established by virtue of Municipal Decree No. 1252, of August 18, 2010, being located in the domain of the Caatinga Biome and in areas of desertification core of Nucleus I - Irauçuba and Sobral in the State of Ceará, therefore it is essential to evaluate its regeneration process.
In this context, the work sought to observe the changes that occurred in the vegetation of the Pedra da Andorinha Conservation Unit through the spatio-temporal analysis of 20 years from the images of the Landsat satellite series.
2 Methodology and Data
2.1 Area of Study
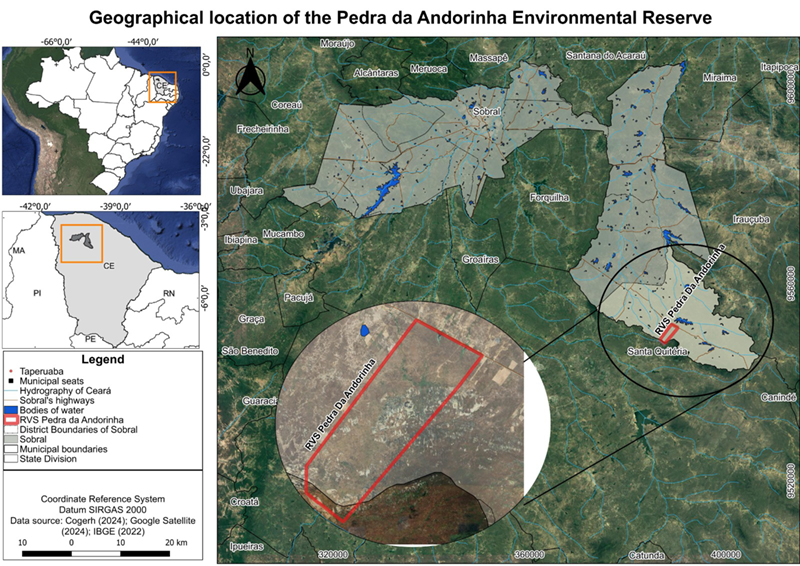
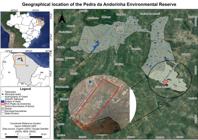
The Pedra da Andorinha Wildlife Refuge (REVIS) (Figure 1), as can be seen below, is located in the district of Taperuaba, municipality of Sobral, state of Ceará. Located at coordinates 4°03'30" S and 39°59'39" W, with an area of 600 hectares, the unit was created through Municipal Decree No. 1252, of August 18, 2010. Its administration is municipal power through the Municipal Environment Agency of Sobral (AMA), with the main objective of ratifying conditions for the maintenance and reproduction of species, local flora as well as original or migratory fauna (Sousa et al. 2019).
2.2 Data and Image Acquisition for Temporal Analysis
To form the Geographic Database (BDG) of the study area, the orbit and the point of the study site were obtained through the website of the National Institute for Space Research (INPE). The region under analysis is in orbit/point 218/063. The Earth Explorer website of the United States GeologicalSurvey (USGS) was accessed to collect the orbital images. The two scenes selected for temporal analysis were from the Landsat 5 sensor Thematic Mapper (TM) satellite, imaging date 07/11/1999, and Landsat 8 sensor Operational Land Imager (OLI), for the day imaged 29/10/2019. Tables 1 and 2 present the characteristics of the Landsat 5 and 8 satellites in more detail.
In order to obtain a better comparison of the scenes, the months determined for the selected images were for the dry period, accentuating between the months of August to November, as well as at the time of the research we sought images that presented less cloud cover to facilitate the visualization of the area. It was also observed the annual average of rainfall for the city of Sobral in a given period, data obtained through the website of the Ceará Foundation of Meteorology and Water Resources (FUNCEME), to seek an equivalence of rainfall.
With the help of the database of the State Superintendence of the Environment (SEMACE), the vector file (shapefile) of Pedra da Andorinha was acquired with the purpose of generating a polygonal around the shape and in a later stage make the cut of the downloaded scenes. This vectorization step was necessary due to the large extent of the scenes. The delimitation of the polygonal around the shape was performed through the advanced scanning tool of QGIS itself.
2.3 Preprocessing
The first pre-processing step consisted of reprojecting the coordinates of the bands used in the NDVI to the same SIRGAS 2000 Coordinate Reference System (SRC) zone 24S.
For the Landsat 5/TM satellite, bands 3 and 4 were georeferenced, while for Landsat 8/OLI, bands 4 and 5 were used, corresponding respectively to the spectral bands of red and near-infrared, these being the bands necessary to generate the vegetation index - NDVI - applied in the study.
The second pre-processing step consisted of converting Digital Numbers (DN) to reflectance. Reflectance is a physical parameter that measures the interaction of electromagnetic radiation with the given surface in percentage.
The reflectance at the top of the atmosphere is obtained through Equation 1. The coefficients used for the correction can be found in the metadata file (MTL) that accompanies the images. For this procedure, the software's raster calculator was used QGIS.
Where: ρλ'= Reflectance from the top of the atmosphere; Mρ= Multiplicative factor of band resizing; Aρ= Band-specific additive sizing factor; Qcal= Pixel value of the quantized and calibrated standard product (DN); θSE= Angle of elevation of the local sun.
2.4 NDVI Processing
With the corresponding red and near-infrared spectral bands of each satellite converted to reflectance, the NDVI for the entire scene was calculated. After the generation of the new image with the information from the NDVI, the raster image was cut, highlighting only the area of the UC Pedra da Andorinha. The tool used to perform the calculation of the NDVI index was the raster calculator, while for the clipping the tool Cut raster by the mask layer was used. This procedure was applied in both Landsat scenes.
The calculation of the NDVI is represented by Equation 2. Through the ratio between the difference of the Nir (nearinfrared) and Red bands and the sum of them, it is obtained as a result values ranging from -1 and +1, and the closer to +1 the greater the presence of vegetation, and otherwise, the proximity of the value of -1 demonstrates its absence.
𝑁𝐷𝑉𝐼= 𝜌𝑁𝐼𝑅−𝜌𝑅𝐸𝐷 𝜌𝑁𝐼𝑅+ 𝜌𝑅𝐸𝐷 (2)
For a better visualization of the changes that occurred in the raster images of local NDVI, the false-color symbology was applied, as well as contrast enhancement of the images.
2.5 Classification of Land Use and Occupation
According to Oliveira et al. (2019) citing Ponzoni, Shimabukuro & Kuplichn (2012), the NDVI proposed by Rouse et al. (1973) is the ratio between the difference and the sum of the infrared and red bands. It is -1 for terrestrial targets and +1 for targets at the upper limit, generating an image with 256 shades of gray, the lighter shades of gray are related to higher NDVI values, while the darker ones are related to lower values.
For the 1999 and 2019 scenes, objective minimum and maximum NDVI limits were established for the discrimination of land cover classes, following the concept of Rouse et al. (1973). According to Rouse et al. (1973), a range of -1 and +1 is established, but for this study the minimum and maximum values (Table 3) varied in accordance with the results obtained from the NDVI. The classes determined were Shade, Water, Exposed soil, Sparse vegetation and Dense vegetation.
Using the Grass tool r.recode generated the recoded file with the defined classes. This procedure of Reclassification of the raster is necessary, because the images in this format present continuous data, that is, it is not possible to perform a precise quantification of classes. Therefore, when applying this method, the data go from continuous to integer data making the classes delimited and facilitating the performance of calculations. This processing was applied to both scenes. Soon after, a color palette was applied for better visualization of the areas according to their occupation.
With the reclassified NDVI image, the areas occupied by each class were quantified using the r.report tool. A text file is produced with the area values for later percentage calculation.
2.6 Accuracy of land cover classification
To validate the results of the thematic maps, the Kappa index was used to measure the reliability of the data obtained by the NDVI classifier. According to Nery, Oliveira & Abreu (2013) the Kappa statistic is a statistical method that allows the results of the analysis of maps obtained through remote sensing to be compared within a certain limit apud (Landis & Koch 1977).
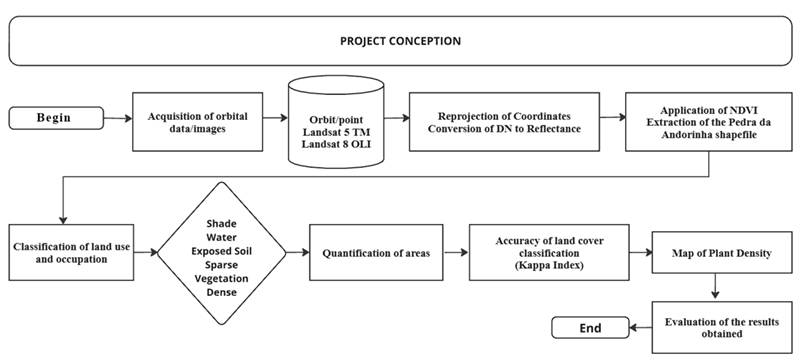
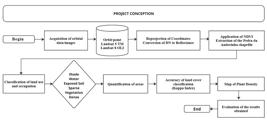
The reference samples were selected by creating randomly distributed polygons of varying sizes throughout the study area. It was decided to maintain the standard of a minimum number of 5 sample polygons for each thematic class; however, due to the fact that some classes occupy small areas, it was not possible to adopt this equity in the choice of samples. Next, the process of applying the Kappa index was carried out in the free software QGIS 3.28.13 using the Grass r.kappa add-on. This tool readily provides the confusion matrix, Kappa index and Global Accuracy. This procedure was carried out for the two resulting maps. For the best compression of the research, the methodological flowchart was applied as shown in Figure 2 below.
3 Results and Discussion
The natural cover of the land has suffered serious consequences that have been generating changes in the ecosystem and in the landscape. According to Coutinho (2006) the caatinga biome is of semi-arid savanna of Zonobiome II. Where the process of alteration of the natural land cover is associated with the process of land use and occupation through agropastoral practices.
REVIS Pedra da Andorinha is located in the district of Taperuaba, in the rural area of the municipality of Sobral, the process of use and occupation was linked to the predominance of mineral and vegetable extractivism, which possibly generates fragmentation of areas. For Souza et al. (2021) generally the fragments are associated with non-productive areas and are very susceptible to anthropic changes.
The monitoring and identification of the types of activities linked to the caatinga biome can contribute to environmental planning and territorial management. The following is the Table 4 on the process of land use and occupation in REVIS Pedra da Andorinha.
According to the current legislation Law No. 9,985/2000 in its Art. 2 For the purposes set forth in this Law, it is understood by: I - conservation unit: territorial space and its environmental resources, including jurisdictional waters, with relevant natural characteristics, legally established by the Government, with conservation objectives and defined limits, under a special administration regime, to which adequate guarantees of protection apply.
Also according to the legislation, REVIS Pedra da Andorinha, is linked to the Integral Protection Unit, and describes in Art. 13. The Wildlife Refuge aims to protect natural environments where conditions are ensured for the existence or reproduction of species or communities of local flora and resident or migratory fauna.
According to studies developed by Souza et al. (2022), the Revis Pedra da Andorinha has a typical physiognomy of caatinga sensu stricto and rupestrian vegetation on inselbergs and outcrops. Highlighting the richness of herbaceous plants in the local community.
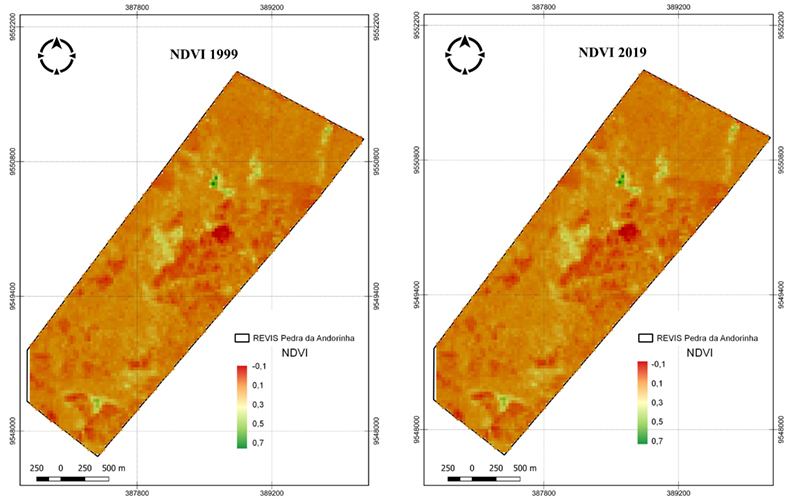
Figure 3 shows the density of vegetation cover, respectively for the years 1999 and 2019. Values range from -0.1 to 0.7. The image of Landsat 5/TM shows that the conservation unit studied has a larger area for exposed soil, followed by water classes, sparse vegetation and dense vegetation. In the year 2019, it is verified that there was a change in the natural landscape of the reserve, with an increase in green area and consequent reduction of exposed soil.
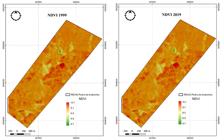
It is observed that the Conservation Unit has modified the local characteristic of use of the area. This situation can be proven in relation to the data presented in Table 4 and compared in relation to the NDVI Indices shown in Figure 3. The agropastoral character and subsistence agriculture is linked to the characteristic of the local community, which has redirected its relationship with land use. It is possible to identify that from the implementation of the Conservation Unit Pedra da Andorinha, the natural vegetation obtained a significant regeneration for the period analyzed. However, we highlight the potential of the study area to the scientific aspect for other areas of interest such as ecosystem, environmental analysis and local history.
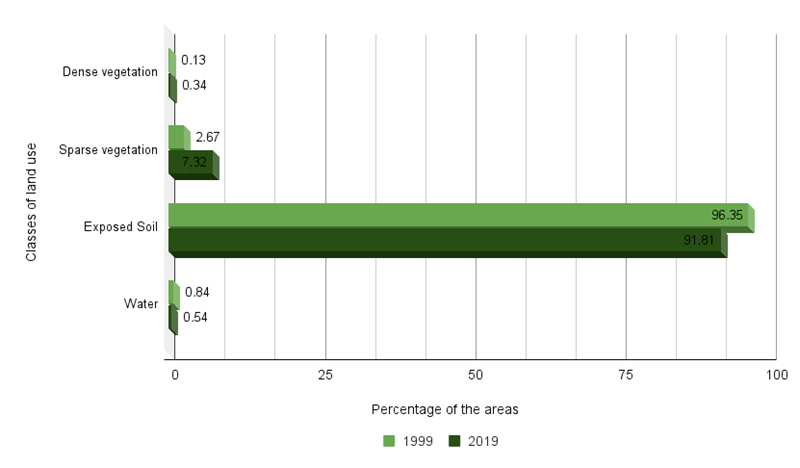
The results we obtained can also be observed in more detail through Table 5, as well as through Figure 4, which represent the quantification in percentage of the areas occupied by class for each year analyzed.
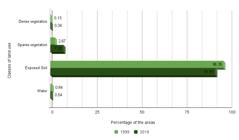
REVIS Pedra da Andorinha showed changes between classes over time. In view of the exposition in Figure 4, before becoming an ecological reserve it is possible to notice that the conservation unit studied has a larger area for exposed soil (96.35%), This happens due to the way the soil was used in this period. The removal of native vegetation by means of fires to prepare the soil for agriculture and introduction of non-native animals from the area were for a long time carried out, altering the local landscape.
The second largest area present is the sparse vegetation with 2.68% of cover. This type of vegetation is a typical characteristic of the biome in which the Conservation Unit is inserted, the Caatinga.
The water class appears soon after, with an occupancy of 0.84%. The dense vegetation presents, as expected, the lowest percentage of occupation of the classes (0.13%). This result is related to the modification of the natural landscape caused by the performance of agropastoral activities, making the environment degraded.
For the year 2019 a positive increase in the natural regeneration of the vegetated area is visible. Both vegetation classes (sparse vegetation and dense vegetation) totaled an area of 7.66% for the year 2019. Sparse vegetation recorded 7.32% coverage in 2019. This represents an increase of approximately 173.48% compared to 1999. For dense vegetation there was a jump from 0.13% in 1999 to 0.34% in 2019, representing approximately three times the area occupied before the reserve was established.
The increase in the class of sparse vegetation can be explained by being characteristic of the Caatinga, a biome in which its vegetation presents a better resistance to changes in environmental degradation, as well as by the sealing of anthropogenic activities after the area is established as a full protection reserve.
The dense vegetation obtained an increase in its area. Through the NDVI product for the year 2019 it is possible to infer that the region where it presents the highest concentration of dense vegetation is close to the rocky elevations in which the species of swallows are sheltered, a place of closed forest and difficult access; and possibly should have a better humidity. In the year 1999, although in lesser expression, it is also noticeable the dense vegetation near this area.
For the water class there was a reduction to 0.53% within the 20-year period. The decrease in the class of exposed soil is a situation resulting from the establishment of the UC of Integral Protection and consequent gain of vegetated area. Despite this, it is still evident the exposed soil as the largest portion that occupies the environmental reserve, this is due to the fact that the site under study is in natural regeneration, a process that can be slow due to local environmental factors.
With regard to the accuracy of the land cover classification, the quality classification proposed by Landis & Koch (1977) shown in Table 6 was used. Tables 7 and 8 detail the confusion matrices drawn up for the years 1999 and 2019. With a Kappa value of 1.0 and Global Efficiency of 100% for both years analyzed, the validation of the results showed equally excellent quality according to Landis & Koch (1977). Therefore, with these results it can be concluded that the results are satisfactory and guarantee the reliability of the study.
Quality of the classification according to the Kappa Index (taken from Landis & Koch, 1977).
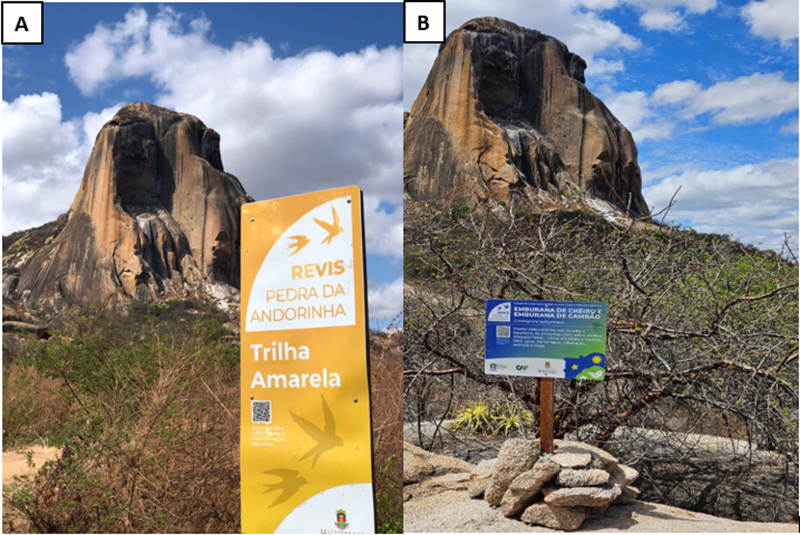
For Moro et al. (2015) inselbergs and slabs are stressful environments for plants, with strong water restriction during the dry season. According to Milen (2016) it is possible to find herbaceous species, in the areas of sertaneja depression and in the inselberg, shrubby species are predominant as shown in Figure 5 below.
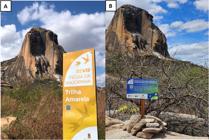
Inselberg Pedra da Andorinha: A. View of Pedra da Andorinha with native vegetation and the location of thetrails; B. Parallel view of Pedra da Andorinha, with native vegetation..
According to Figure 5, the relief forms in the Pedra da Andorinha REVIS, include three geomorphological features are present: inselbergs, river plain and sertaneja depression (Sousa et al. 2019), with sertaneja depression present in 70% of its territory.
The REVIS Pedra da Andorinha unit proved to be fundamental in the process of regeneration of the local flora, in which the sparse vegetation in 2.67% in 1999 increasing to 7.32% in 2019 followed by the dense vegetation where it was observed in 1999 about 0.13% increasing to 0.34% in 2019. And the Exposed Soil, reduced from 96.35% in 1999 to 91.81% in 2019. Finally, we indicate that the Conservation Unit can be included as a technique for the recovery of degraded areas.
4 Conclusion
The present work highlighted the importance of the application of geoprocessing, carried out through remote sensing, in being a tool of great potential for environmental analysis, specifically in the perspective of vegetation cover in protected areas due to the extension of occupied area. The use of orbital images presents as advantages its ease and simplicity in obtaining the results, thus offering a better direction in the decision making of recovery and plant protection.
Through the technique of Supervised Classification it was possible to obtain a visualization of the land occupation both qualitatively and quantitatively and thus verify the gains and losses of vegetation within the space-time studied. REVIS Pedra da Andorinha presented a successful vegetative regeneration between the years 1999 and 2019. The vegetation classes defined in the study show the gains of local vegetation after the establishment of the conservation area.
These changes in land use allow us to observe the occurrence of natural regeneration in Revis Pedra da Andorinha for the years 1999 and 2019. In this scenario, it is possible to infer that the protection areas are of great value for the increase of the vegetation cover through the process of natural regeneration and in the maintenance of biodiversity.
It is noteworthy that the studies carried out through remote sensing require an on-site analysis as a way of validating and complementing the results obtained for the study area. Therefore, it is suggested that for future work in the area of Pedra da Andorinha visits be made to the site for better verification and environmental analysis.
The Revis Pedra da Andorinha presents few publications of studies, even with its landscape distinction. In view of this, this work is of fundamental importance for a source of research on the area.
5 References
-
Andrade, S.F. 2011, ‘Sensoriamento Remoto e Algumas Aplicações’, Caderno de Estudos Geoambientais CADEGEO, vol. 2, no. 1, pp. 13-26, viewed 20 March 2023, < 13-26, viewed 20 March 2023, http://www.cadegeo.uff.br/index.php/cadegeo/article/view/5/5 >.
» http://www.cadegeo.uff.br/index.php/cadegeo/article/view/5/5 -
Araújo, T.D. & Fonseca, E.L. 2016, ‘Análise multitemporal dos Lençóis Maranhenses entre 1984 a 2014 utilizando sensoriamento remoto orbital’, Revista Brasileira de Geografia Física, vol. 09, no. 1, pp. 280-95, DOI: 10.26848/rbgf.v9.1.p280-295.
» https://doi.org/10.26848/rbgf.v9.1.p280-295 - Bezerra, J.M., Moura, G.B.A., Silva, B.B., Lopes, P.M.O. & Silva, E.F.F. 2014, ‘Parâmetros biofísicos obtidos por sensoriamento remoto em região semiárida do estado do Rio Grande do Norte, Brasil’, Revista Brasileira de Engenharia Agrícola e Ambiental, vol. 18, pp. 73-84.
-
Brazil. 2000, ‘Lei no 9.985, de 18 de julho de 2000, Institui o Sistema Nacional de Unidades de Conservação da Natureza e dá outras providências’, viewed 13 July 2023, <985, de 18 de julho de 2000, Institui o Sistema Nacional de Unidades de Conservação da Natureza e dá outras providências’, viewed 13 July 2023, https://www.planalto.gov.br/ccivil_03/leis/l9985.htm >.
» https://www.planalto.gov.br/ccivil_03/leis/l9985.htm -
Coutinho, L.M. 2006, ‘O conceito de bioma’, Acta Botânica Brasilica, vol. 20, no. 1, pp. 13-23, DOI:10.1590/S0102-33062006000100002.
» https://doi.org/10.1590/S0102-33062006000100002 - Ehlers, M. 2007, ‘Sensoriamento Remoto para usuários de SIG - Sistemas sensores e métodos: entre as exigências do usuário e a realidade’, in Blaschke, T. & Kux, H. (org.), Sensoriamento Remoto e SIG Avançado, 2 ed., Editora Oficina de Textos, São Paulo, pp. 19 - 38.
-
Ferreira, F.F. 2019, ‘Análise de persistência do estado da vegetação usando NDVI na bacia do rio Itapemirim-Es’, Master Thesis, Universidade Federal do Rio de Janeiro, <https://pantheon.ufrj.br/bitstream/11422/14006/1/FernandaFrancaFerreira.pdf>.
» https://pantheon.ufrj.br/bitstream/11422/14006/1/FernandaFrancaFerreira.pdf - Landis, J.R. & Koch, G.G. 1977, ‘The Measurement of Observer Agreement for Categorical Data’, Biometrics, vol. 33, no. 1, pp. 159-174.
-
Lopes, H.L., Candeias, A.L.B., Accioly, L.J.O., Sobral, M.C.M. & Pacheco, A.P. 2010, ‘Parâmetros biofísicos na detecção de mudanças na cobertura e uso do solo em bacias hidrográficas’, Revista Brasileira de Engenharia Agrícola e Ambiental, vol. 14, no. 11, pp.1210-9, DOI: 10.1590/S1415-43662010001100011.
» https://doi.org/10.1590/S1415-43662010001100011 -
Milen, A.F. 2016, ‘Caracterização geoambiental da Unidade de Conservação Refúgio de Vida Silvestre Pedra da Andorinha’, Revista de Geociências do Nordeste, vol. 2, no. Especial, pp. 1191-200, DOI:10.21680/2447-3359.2016v2n0ID10584.
» https://doi.org/10.21680/2447-3359.2016v2n0ID10584 -
Minighin, D., Gonçalves, L.C., Villanova, D.F.Q., Mauricio, R.M., Pereira, R.V.G. & Carvalho, W.T.V. 2017, ‘Pastagens degradadas e técnicas de recuperação: Revisão’, Pubvet, vol. 11, no. 10, pp. 1036-045, DOI:10.22256/PUBVET.V11N10.1036-1045.
» https://doi.org/10.22256/PUBVET.V11N10.1036-1045 -
Moro, M.F., Macedo, M.B, Moura-Fé, M.M, Castro, A.S.F, Costa, R.C & da Costa, R. C. 2015, ‘Vegetação, unidades fitoecológicas e diversidade paisagística do estado do Ceará’, Rodriguésia, vol. 66, no. 3, pp. 717-43, DOI:10.1590/2175-7860201566305.
» https://doi.org/10.1590/2175-7860201566305 -
Nery, C.V.M., Oliveira, D.B. & Abreu, L.H.G 2013, ‘Estudo comparativo entre os índices NDVI obtidos a partir dos sensores Landsat 5 - TM e Resourcesat - Liss III’, Caminhos de Geografia, vol. 14, no. 46, p. 160-167, DOI:10.14393/RCG144616793.
» https://doi.org/10.14393/RCG144616793 -
Oliveira, G.F., Alexandre, F.S., Costa, S.O.S., Neto, J.B.S, Souza, L.R. & Gomes, D.D.M. 2019, ‘Utilização do NDVI para análise da degradação da cobertura vegetal do município de Saloá - PE’, Revista da Casa da Geografia de Sobral, vol. 21, no. 2, pp. 491-501, DOI: 10.35701/rcgs.v21n2.504.
» https://doi.org/10.35701/rcgs.v21n2.504 - Oliveira, P.J.L., Silva Filho, C.R. & Guedes, J.C.F. 2022, ‘Variação da cobertura vegetal na Unidade de Conservação Stoessel de Brito, Jucurutu-RN’, Revista GeoNordeste, vol. 33, no. 1, pp. 190-207.
-
Ponzoni, F.J. 2002, ‘Sensoriamento remoto no estudo da vegetação: diagnosticando a Mata Atlântica’, in: Rudorff, B.F.T., Moraes, E.C., Ponzoni, F.J., Camargo Júnior, H., Conforte, J.C., Moreira, J.C., Epiphanio, J.C.N., Moreira, M.A., Kampel, M., Albuquerque, P.C.G., Martini, P.R., Ferreira, S.H., Tavares Júnior, S.S. & Santos, V.M.N. (eds), Curso de uso de sensoriamento remoto no estudo do meio ambiente, INPE, São José dos Campos, pp. 1-27, INPE-8984-PUD/62, viewed 10 April 2023, < 1-27, INPE-8984-PUD/62, viewed 10 April 2023, http://urlib.net/ibi/sid.inpe.br/sergio/2005/06.14.13.11 >.
» http://urlib.net/ibi/sid.inpe.br/sergio/2005/06.14.13.11 - Ponzoni, F.J., Shimabukuro, Y.E. & Kuplich, T.M. 2012, Sensoriamento Remoto da Vegetação, Oficina de Texto, São José dos Campos.
-
Resende, F.C., Soares, T.B.O., Santos, P.R. & Pereira, G. 2015, ‘Análise de índices espectrais para estimativa de áreas de regeneração florestal no Parque Nacional Chapada Das Mesas’, Revista Territorium Terram, vol. 3, no. 5, pp. 95-104, 16 June 2023, < 95-104, 16 June 2023, http://www.seer.ufsj.edu.br/territorium_terram/article/view/1053 >.
» http://www.seer.ufsj.edu.br/territorium_terram/article/view/1053 -
Rodrigues, A.B.M., Giuliatti, N.M., & Júnior, A. P. 2020, ‘Aplicação de metodologias de recuperação de áreas degradadas nos biomas brasileiros/ Application of methodologies for degraded areas recovering in the Brazilian Biomes’, Brazilian Applied Science Review, vol. 4, no. 1, pp. 333-69, DOI:10.34115/basrv4n1-021.
» https://doi.org/10.34115/basrv4n1-021 -
Rodrigues, J.M.D. & Lima, E.C. 2015, ‘Análise dos sistemas ambientais da sub-bacia hidrográfica do Rio Bom Jesus-Taperuaba-CE’, Revista da Casa da Geografia de Sobral, vol. 17, no. 1, pp. 60-79, viewed 30 April 2023, DOI: 10.36403/espacoaberto.2016.3606.
» https://doi.org/10.36403/espacoaberto.2016.3606 -
Rubira, F. G. 2016, ‘Definição e diferenciação dos conceitos de áreas verdes/espaços livres e degradação ambiental/impacto ambiental’, Caderno de Geografia, vol. 26, no. 45, pp. 134-50, DOI:10.5752/P.2318-2962.2016v26n45p134.
» https://doi.org/10.5752/P.2318-2962.2016v26n45p134 -
Silva, L.A. 2020, 'Uma revisão de literatura sobre o índice de vegetação por diferença normalizada (NDVI) no monitoramento de áreas degradadas por empreendimentos minerários', Holos Environment, vol. 20, no. 2, pp. 198-213, DOI:10.14295/holos.v20i2.12375.
» https://doi.org/10.14295/holos.v20i2.12375 - Silva, L.C., Silva, J.L.B., Moura, G.B.A., Oliveira, J.G., Santos, J.M. & Lopes, P.M.O.L. 2019, 'Monitoramento Espaço-Temporal Dos Índices De Vegetação Por Sensoriamento Remoto No Semiárido Pernambucano', IX Workshop de mudanças climáticas e recursos hídricos do estado de Pernanbuco, VI Workshop internacional de mudanças climáticas e biodiversidade, pp. 219-233.
-
Sousa, M.A., Mendes, D.C., do Nascimento, A.N.P. & Lima, E.C. 2019, ‘Caracterização geomorfológica da unidade de conservação refúgio de vida silvestre Pedra Das Andorinhas, Taperuaba Sobral - CE’, Revista Homem, Espaço e Tempo, vol. 13, no. 1, pp. 35-45, viewed 30 April 2023, < 35-45, viewed 30 April 2023, https://rhet.uvanet.br/index.php/rhet/article/view/303 >.
» https://rhet.uvanet.br/index.php/rhet/article/view/303 -
Souza, E.B., Nepomuceno, F.A.A., Santos, F.D.S., Araújo, F.F., Nepomuceno, I.V., Paula, A.S., Amorim, V.O., Branco, M.S.D., Rabelo, S.T., Pinto, D.M.M., Nascimento, J.B.S. & Moro, M.F. 2022, ‘Flora andphysiognomyof Caatinga vegetation over crystallinebedrock in thenorthern Caatinga domain, Brazil’, Rodriguésia, vol. 73, e01252021, DOI:10.1590/2175-7860202273109.
» https://doi.org/10.1590/2175-7860202273109 -
Souza, L.P.N., Moura, D.C., Batista, R.F., Costa, C.R.G. & Marques, A.L. 2021, ‘Land use andfragmentation in a dryforest in theBraziliansemiarid’, Natural Resources, vol. 11, no. 1, pp. 92-101, DOI:10.6008/CBPC2237-9290.2021.001.0012.
» https://doi.org/10.6008/CBPC2237-9290.2021.001.0012
-
Funding information
Not applicable
-
Data availability statement
Model data are freely available on: https://earthexplorer.usgs.gov/ Reference datasets can be downloaded from: https://seuma.sobral.ce.gov.br/iinformativos/dados-geograficos
Model data are freely available on: https://earthexplorer.usgs.gov/ Reference datasets can be downloaded from: https://seuma.sobral.ce.gov.br/iinformativos/dados-geograficos