 Relationships between glucose variability with white matter hyperintensity and cerebrovascular abnormalities
Abstract
Objective: Epidemiological studies have revealed that glucose variability (GV) is a predictor of stroke, cognitive impairment, and dementia in patients with type 2 diabetes mellitus (T2DM). However, evidence on the associations of GV with white matter hyperintensity (WMH) and cerebrovascular abnormalities remains scarce. This study aimed to explore the relationships of GV with WMH and cerebrovascular abnormalities using epidemiological and Mendelian randomization (MR) approaches. The MR approach was used to assess the effects of genetic proxies for GV on MRI outcomes.
Subjects and methods: This cross-sectional study was conducted at a medical center where patients with T2DM were recruited. The measures for fasting plasma glucose (FPG) and HbA1c variability included the standard deviation, coefficient of variation, average real variability (ARV), and variability independent of the mean (VIM). Brain magnetic resonance images were analyzed to assess WMHs and cerebrovascular abnormalities. For MR, instrumental variables were used to assess the causal relationships between glycemic variability and outcome based on two-stage regression analysis.
Results: This study included 2,247 subjects, of whom 1,122 had WMH and 957 had cerebrovascular abnormalities. We found 80 independent single-nucleotide polymorphisms associated with GV but not with WMH or cerebrovascular abnormalities, which were subsequently used as genetic instruments. Genetically increased, unweighted FPG-VIM was linked with WMH (odds ratio 1.17 [95% CI 1.08, 1.27] per standard deviation). All genetically increased, unweighted and weighted GV measures were associated with cerebrovascular abnormalities, except FPG-ARV.
Conclusion: Our study provided evidence that genetically predicted GV was associated with WMH and cerebrovascular abnormalities, supporting a potential causal link under MR assumptions.
Keywords:
Type 2 diabetes; glycemic variability; white matter hyperintensity; cerebrovascular abnormalities
INTRODUCTION
A global pandemic of type 2 diabetes is currently underway, driven by factors such as rapid urbanization, an aging global population, and rising obesity rates associated with energy-dense diets and sedentary lifestyles. This public health crisis affects low-, middle-, and high-income countries. The global prevalence of type 2 diabetes increased markedly from 151 million in 2000 to 537 million by 2021, significantly exceeding the earlier 1998 projection of 300 million by 2021 (1,2). Type 2 diabetes is linked to a range of complications, including macrovascular conditions - such as coronary artery disease, stroke, and peripheral arterial disease - and microvascular complications. These outcomes, largely attributed to atherosclerotic processes, impose a considerable burden on health care systems worldwide (3-5). Cardiovascular diseases, including heart failure, coronary heart disease, cerebrovascular disease, and other cardiac conditions, remained the leading cause of mortality worldwide and accounted for more than 30% of all deaths in 2016 (6). A comprehensive meta-analysis of 102 prospective studies revealed that compared with nondiabetic individuals, individuals with diabetes face a 2- to 4-fold increased risk of ischemic stroke and coronary heart disease and a 1.5- to 3.6-fold increase in all-cause mortality. These risks are further exacerbated by poor glycemic control (7).
Glycemic control has long been considered a fundamental strategy for mitigating diabetic complications, with glycosylated hemoglobin (HbA1c) widely recognized as the “gold standard” biomarker for long-term glycemic regulation. However, randomized controlled trials have indicated that reduced blood glucose levels do not necessarily correspond to a decreased incidence of diabetic complications (8-10). One plausible explanation is that these studies did not adequately account for glucose variability-marked fluctuations in blood glucose levels over time-which may play a critical role in the development of diabetic complications. The concept of “glucose variability” or “glycemic variability” has garnered increasing attention from the research community. Mounting evidence suggests that visit-to-visit glucose fluctuations are significantly associated with diabetes-related complications and mortality. To date, experimental evidence confirming the harmful effects of glucose variability is lacking. Thus, further investigations using methodologies capable of establishing experimental causality are warranted to clarify the role of glucose variability in the pathogenesis of diabetes-related complications. Mendelian randomization (MR) provides an alternative methodological framework for inferring causal relationships and generating evidence analogous to experimental results.
Quantitative and noninvasive in nature, brain magnetic resonance imaging (MRI) has become increasingly accessible in clinical settings and is frequently utilized as a surrogate endpoint for identifying novel determinants of brain health (11). One commonly examined MRI parameter is white matter hyperintensity (WMH) volume, which represents lesions in the white matter of the brain. These lesions make the white matter appear hyperintense on fluid-attenuated inversion recovery (FLAIR) sequences. Brain MRI, particularly WMH assessment, is widely regarded as a marker of cerebral small vessel disease (12). Increased WMH volumes have been associated with increased risks of Alzheimer’s disease, incident stroke, all-cause mortality, and cognitive decline (13). Advanced brain MRI techniques enable the visualization and quantification of structural and microvascular abnormalities, thereby facilitating the early detection of cerebrovascular disease even in asymptomatic individuals.
Previous studies that employed traditional epidemiologic or MR designs to examine the association of glucose level or variability with WMH and cerebrovascular abnormalities have been limited (14-16). One study explored the association between HbA1c levels and WMH in the general population (16). Research on glucose variability has focused primarily on individuals with type 1 diabetes (14), whereas another study investigated a small sample of older adults with type 2 diabetes who carried the APOE4 allele (15). One MR study investigated the association between HbA1c levels and WMH. Considering the limited number of studies and their small sample sizes, we aimed to assess the associations between visit-to-visit glucose variability and brain MRI measurements using observational epidemiologic and MR approaches. The MR approach was used to assess the effects of glucose variability (GV) on MRI outcomes.
SUBJECTS AND METHODS
Study subjects
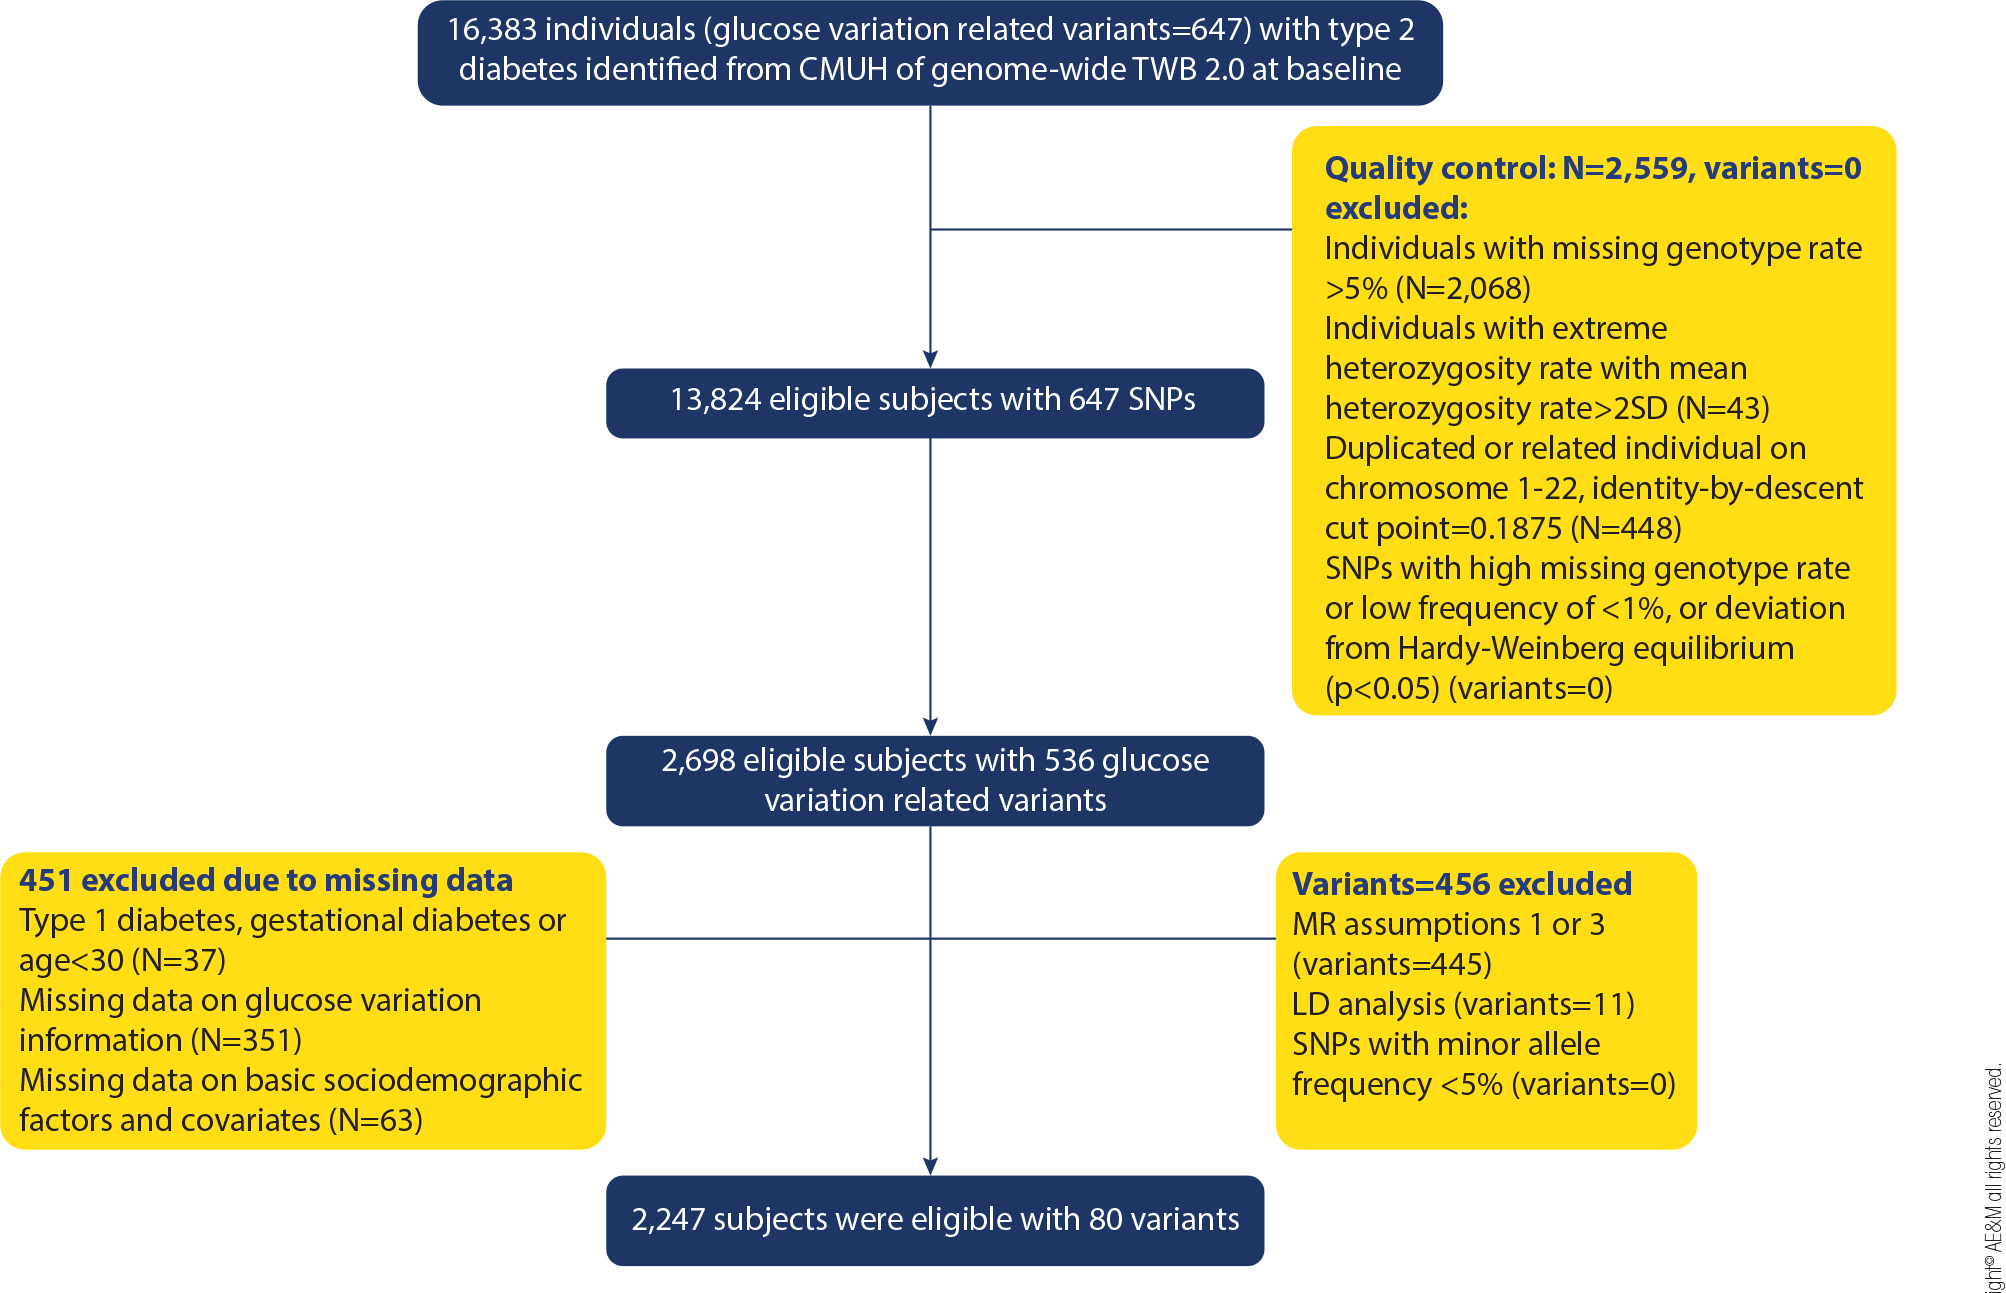
A retrospective cohort study was conducted among individuals with type 2 diabetes who were enrolled in the Diabetes Care Management Program (DCMP) at China Medical University Hospital (CMUH). The inclusion criterion was individuals diagnosed with diabetes, identified by the International Classification of Diseases, Ninth Revision, Clinical Modification (ICD-9-CM) code 250. The exclusion criteria included individuals younger than 30 years, those with type 1 diabetes (ICD-9-CM codes 250.x1/x3), and those diagnosed with gestational diabetes (ICD-9-CM code 648.83). Participants were recruited between November 2001 and June 2022. The index date was defined as the date of the first available brain MRI measurement. Individuals lacking data on brain MRI, laboratory tests, or dietary records were excluded from the analysis (Figure 1). Measurements for other study variables were obtained from the date closest to the index date. This study was approved by the Ethical Review Board of the CMUH (CMUH112-REC1-007).
Data source
The data for this study were derived from the computerized databases of the Clinical Research Data Repository (CRDR) and the DCMP at CMUH in Taichung, Taiwan. Established in 2017, the CMUH-CRDR integrates data from multiple clinical sources with the goal of improving healthcare quality by consolidating trackable patient information generated during routine clinical practice. This repository includes comprehensive data, such as laboratory and physiological measurements, prescription records, hospitalizations, surgical procedures, and emergency department visits. It also contains whole-genome genotyping data generated using Affymetrix Axiom Genome-Wide TPM array chips (Affymetrix, Santa Clara, CA, USA). Moreover, the DCMP database contains information on individuals diagnosed with diabetes based on the diagnostic criteria set forth by the American Diabetes Association. Eligible patients were invited to enroll in the program by their physicians. Only healthcare professionals who have completed the required clinical education and training programs were authorized to recruit patients into the DCMP.
Measurements
Upon enrollment in the DCMP, patients underwent a series of assessments, such as anthropometric measurements and blood and urine tests. Information on dietary habits, lifestyle factors, and past or current medical conditions was collected by trained case nurses using a standardized computerized questionnaire. Detailed definitions of all study variables are provided in the sections below.
Key predictor variables
In this study, the primary predictor variable was glucose variability, which was using the following metrics: variability independent of the mean (VIM), average real variability (ARV), coefficient of variation (CV), standard deviation (SD), and slope of HbA1c and fasting plasma glucose (FPG). These indices were calculated on the basis of annual outpatient measurements over the 1-year period preceding the index date. As recommended in prior research, variability estimates were adjusted using a weighting factor equal to the reciprocal of √(n/(n - 1)) to account for differences in the number of glucose measurements per individual (17). Glucose variability metrics were derived only for participants with at least two recorded measurements of HbA1c and FPG.
Covariates
The demographic and family history variables included participants’ sex; age at entry into the DCMP. Lifestyle variables, as recorded in the DCMP dataset, included physical activity, alcohol consumption, smoking, passive smoking, and habitual dietary intake.
The medication variables included the use of oral hypoglycemic agents and insulin. Oral agents were categorized into seven classes as follows: meglitinides, sulfonylureas, biguanides, insulin sensitizers, dipeptidyl peptidase-4 inhibitors, α-glucosidase inhibitors, and other compounds. Insulin types included insulin aspart, regular insulin, neutral protamine hagedorn, levemir, glucagon-like peptide-1 analogs, and lantus. The use of other medications, including antihypertensives (e.g., calcium channel blockers), nephropathy medications, and lipid-lowering agents (e.g., statins), was recorded electronically and classified as “yes” or “no”, baseline comorbidities and diabetic complications were also classified dichotomously. Comorbidities included hyperlipidemia, hypertension, and obesity. Chronic complications included stroke, peripheral neuropathy, peripheral vascular disease, retinopathy, diabetic foot, nephropathy, and amputation. Acute complications included hyperglycemic hyperosmolar nonketotic coma (HHNK), severe hypoglycemia, and diabetic ketoacidosis.
Instrumental variables
Single-nucleotide polymorphism (SNP) genotyping in MR analysis
The SNP data used as instrumental variables were obtained from the iHi Genomics, CMUH-CRDR (18) and were based on DNA samples genotyped using the TPM array and analyzed with the Axiom Genome-Wide Array Plate System (Affymetrix, Santa Clara, CA, USA). Quality control included assessment of Hardy-Weinberg equilibrium using PLINK v2.0 (19), and genotype imputation was performed with IMPUTE2 software (20) using the 1000 Genomes Project as the reference panel. Genetic variants were selected under the guidance of previous studies employing candidate gene and genome-wide association study (GWAS) approaches for HbA1c (21-23) and FPG (24,25). A curated list of SNPs associated with HbA1c and FPG was constructed. For HbA1c, the variants in genes involved in glycemic pathways (e.g., CDKAL1, DGKB, GCK, SLC30A8, MTAP, and KL) and nonglycemic pathways (e.g., SPATS2L, TRAM2-AS1, RPA2P2, KCNKS, and ARAP3) were included. For FPG, SNPs from loci such as HFE, MYB, ANK1, HK1, and PHB2 were considered. The MR literature was further searched for SNPs (16,26-32), especially those linked to the potential biological mechanisms of glucose variability. A total of 536 SNPs were found in the GWAS data from iHi Genomics. The SNPs not identified in the iHi genomics dataset, with minor allele frequencies < 5%, violating MR assumptions 1 and 3 (SNP = 445), and in high linkage disequilibrium (SNP = 11) were removed. Finally, 80 SNPs were included in the analysis. Approval was obtained from the Human Research Committee of CMUH (CMUH112-REC1-007), and this study was conducted in accordance with relevant regulations and guidelines.
Assessment of brain MRI scans
Brain MRI scans were performed using a 3.0 Tesla scanner (SIGNA HDxt), and imaging data were retrieved from the hospital’s electronic medical records. Axial T2-weighted FLAIR sequences were used for the assessment of WMHs. WMHs were defined as those with subcortical or periventricular hyperintensities visible on FLAIR images and were assessed visually by a board-certified radiologist, who was blinded to the clinical information. WMH was operationalized as a binary variable, defined as “yes” if any WMH lesion was identified, and “no” otherwise. The interand intrarater reliability of cerebrovascular findings were evaluated on a sample of 60 MRI images, yielding kappa statistics exceeding 0.80 across all assessed conditions, indicating high agreement. Cerebrovascular abnormalities were also assessed by a radiologist. Cerebrovascular abnormalities included stenosis or occlusion of major intracranial or internal carotid arteries, aneurysms, lacunar or small infarctions, intracerebral hemorrhage, and lobar infarctions.
Statistical analysis
Descriptive statistics are reported as the means and standard deviations for continuous variables and as frequencies and proportions for categorical variables. Bivariate analyses were conducted using chi-square tests for categorical variables and two-sample t-tests for continuous variables. Multiple logistic regression was used to adjust for age, sex, lifestyle behaviors (smoking, alcohol consumption, physical activity, and BMI), diabetes-related variables (duration of diabetes and type of hypoglycemic drug use), comorbidities (stroke, hypertension, obesity, coronary artery disease, hyperlipidemia, peripheral neuropathy, neuropathy and nephropathy), drug-related variables (cardiovascular medications, hyperlipidemia medications, and hypertension medications) and biomarkers (HDL-C, TG, LDL-C, TC, eGFR, FPG, and HbA1c). All statistical analyses were performed using SAS version 9.4 (SAS Institute, Cary, NC) with two-tailed p-values and a significance threshold of 0.05.
MR analysis
Quality control excluded individuals with high genotyping missingness, extreme heterozygosity, or genetic relatedness. SNPs were removed for low minor allele frequency, high missingness, or Hardy-Weinberg disequilibrium (tested via chi-square in controls). MR assumptions were assessed as follows: For relevance (assumption 1), SNP associations with glucose variability were tested using ANOVA and linear regression (additive model); for exclusion restriction (assumption 3), chi-square tests ensured no association with brain MRI variables. Only SNPs meeting both criteria were used to construct weighted and unweighted genetic risk scores (GRSs).
Before the GRSs were constructed, linkage disequilibrium (LD) was assessed using pairwise r2 in Haploview v4.2; for SNP pairs with r2 > 0.8, one was retained on the basis of prior associations with glucose traits. The weighted GRS was calculated by summing the products of minor allele counts and their regression coefficients. GRS values were divided into quartiles to assess linearity, and analyzed as a continuous variable. Linear regression was used to test the association between GRSs and glucose variability (assumption 1), whereas multinomial logistic regression was used to assess the associations with covariates (assumption 2). Assumption 3 was tested via logistic regression with brain MRI variables.
MR analyses used two-stage instrumental variable regression with multivariable adjustment to estimate the causal effect of glucose variability on brain MRI outcomes. In stage one, glucose variability was predicted from the weighted GRS. In stage two, these predicted values were used in logistic regression with brain MRI measures. Models adjusted for first-stage residuals, covariates violating MR assumption 2, and the top 10 genetic principal components. Horizontal pleiotropy was assessed using MR-Egger regression, and between-instrument heterogeneity was evaluated using Cochran’s Q statistics under the inverse-variance weighted framework. All tests were two-sided with p < 0.05.
RESULTS
Baseline characteristics of the study subjects
A total of 2,247 individuals with type 2 diabetes from the Taichung Diabetes Study were included, with a mean baseline age of 65.00 years (SD = 11.14). Among these participants, 1,122 (49.9%) had WMHs and 957 (42.6%) had cerebrovascular abnormalities. Table 1 shows the characteristics of the study subjects grouped by WMH volume and cerebrovascular abnormalities. Individuals with WMH were significantly older and had a low proportion of men and smokers. They also had a long mean duration of diabetes, a high prevalence of cardiovascular and antihypertensive medication use, and low mean LDL-C level and eGFR. Moreover, significantly more individuals with cerebrovascular abnormalities were older and had a high proportion of men and a greater prevalence of injection use, oral hypoglycemic drug use, hypertension, stroke, coronary artery disease, and neuropathy. They also had a long mean duration of diabetes, high HbA1c levels, a high prevalence of cardiovascular and hypertension medication use, and low mean HDL-C level and eGFR.
Comparisons of sociodemographic factors, lifestyle behaviors, diabetes-related variables, glucose variation and comorbidities according to WMH or cerebrovascular abnormality
Associations between glucose variability and brain MRI variables determined using an epidemiologic approach
Table 2 presents the odds ratios (ORs) and confidence intervals (CIs) for the presence of WMH and cerebrovascular abnormalities associated with various glucose variability measures in the study subjects with type 2 diabetes as observed in an epidemiological study. After adjustment for age and sex or multivariate adjustment, no significant associations were found between any glucose variability measures and the presence of WMH (all p>0.05). With the exception of HbA1c-VIM, all glucose variability measures were significantly associated with the presence of cerebrovascular abnormalities after adjustment for age and sex. Following multivariate adjustment, only AC-CV, AC-SD, AC-VIM, and AC-ARV remained significantly associated with the presence of cerebrovascular abnormalities. The OR per 1 unit change for glucose variability ranged from 1.12 (95% CI: 1.02, 1.23) for AC-ARV to 1.28 (95% CI: 1.15, 1.41) for AC-CV.
The odds ratios of WMH or cerebrovascular abnormality for various glucose variation measures in patients with type 2 diabetes using observational epidemiologic approach
Evaluation of MR assumptions 1 and 3 at the SNP level
Supplementary Table 1 shows the regression coefficients for glucose variability measures and ORs for the presence of WMH and cerebrovascular abnormalities of the significant SNPs meeting SNP-level MR assumptions 1 (all p < 0.05) and 3 (all p > 0.05) as determined using an additive model. For the SNPs exhibiting negative associations, i.e., those with regression coefficients less than 0 or an ORs less than 1, we reversed the codes to 2, 1, or 0 depending on the number of minor alleles to ensure that the direction of the regression coefficients or ORs consistently remained positive.
MR-Egger regression was performed to test horizontal pleiotropy. The absolute values of the intercepts for the brain MRI variables ranged from 0.0003 to 0.025 (Supplementary Table 2). The results of the Cochran’s Q statistics suggest no apparent horizontal pleiotropy because all the intercepts were not significantly different from zero (all p > 0.05).
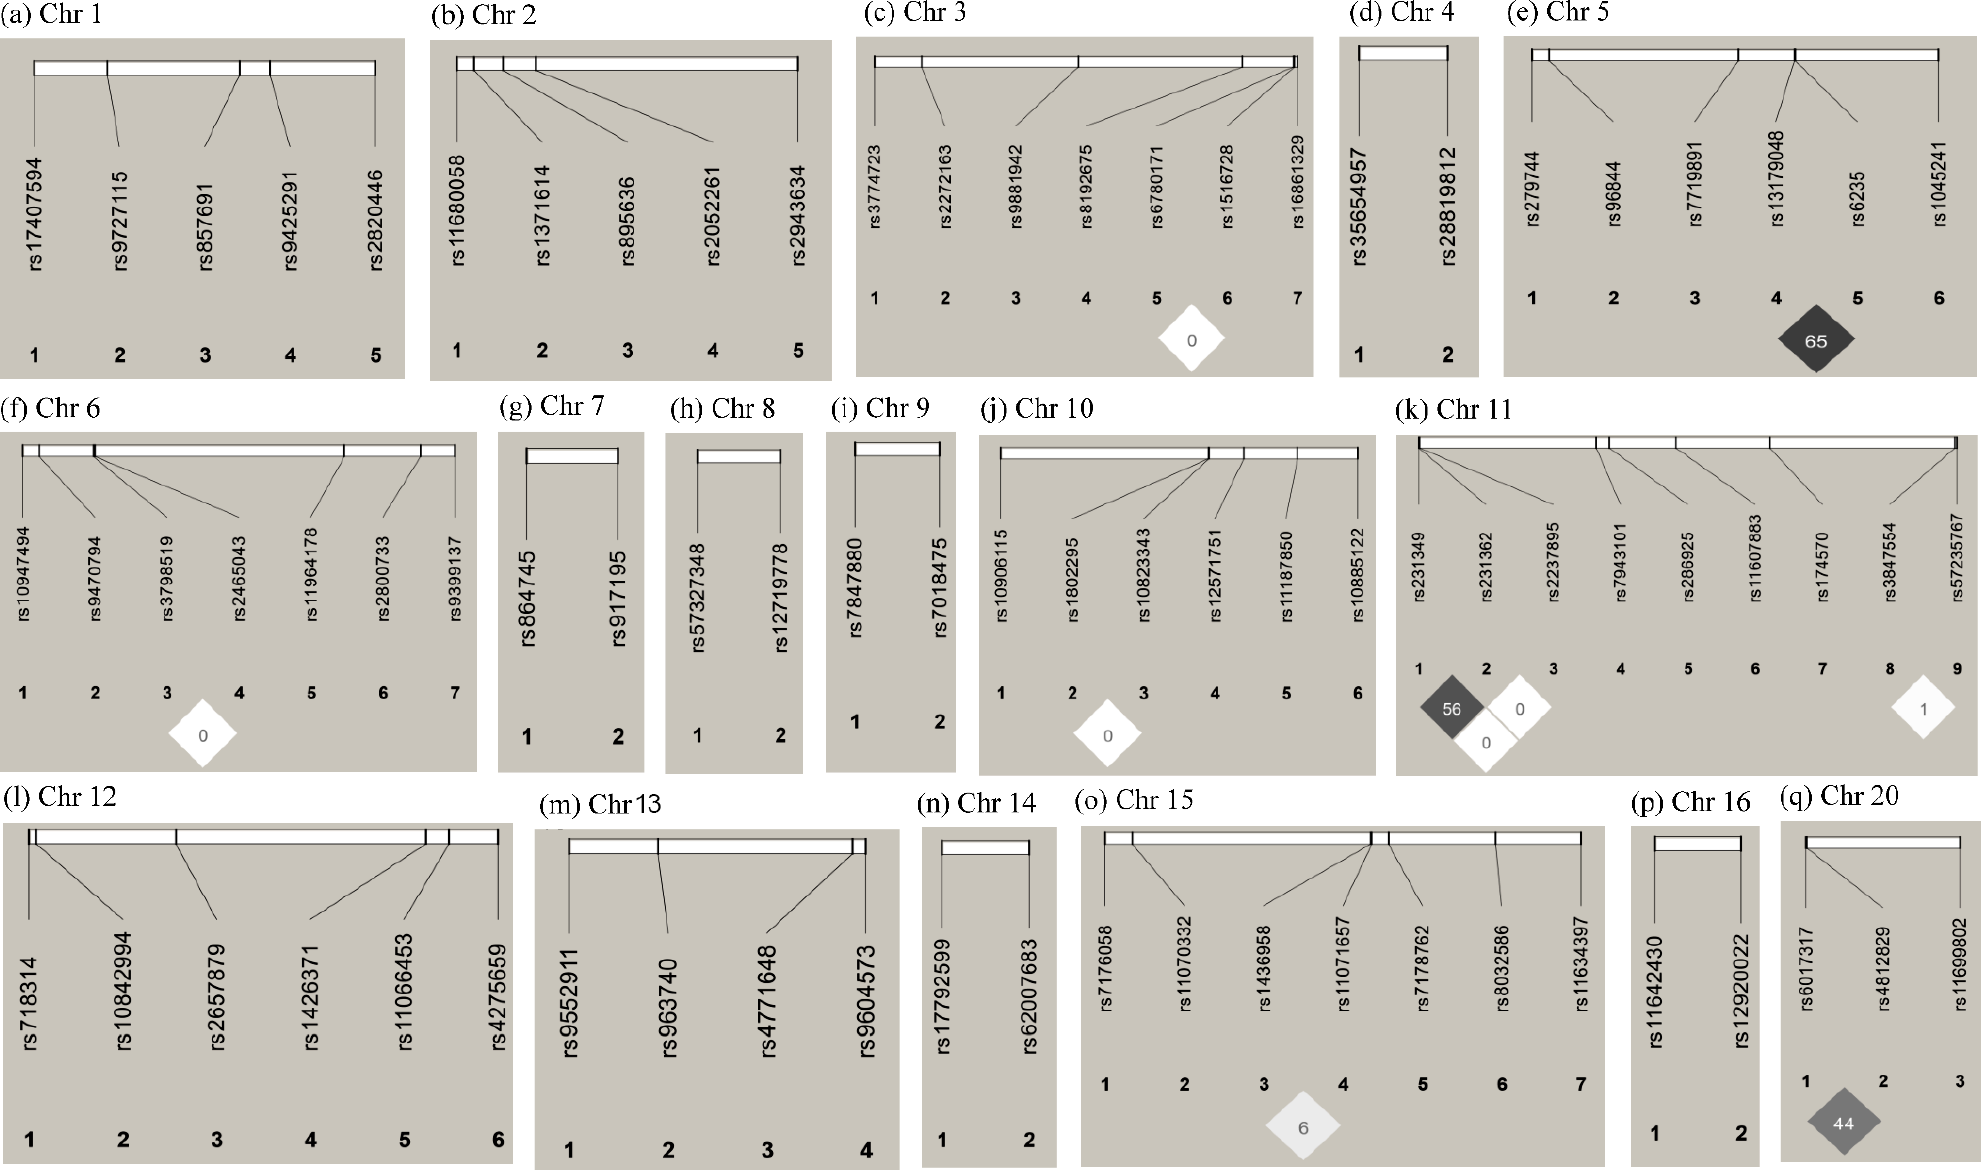
The LD of the SNPs satisfying MR assumptions 1 and 3 was examined. (Supplementary Figure 1). The retained SNPs included AC-CV (19), AC-SD (16), AC-VIM (19), and AC-ARV (20) for FPG variation measures and HbA1c-CV (18), HbA1c-SD (19), HbA1c-VIM (10), and HbA1c-ARV (13) for HbA1c variation measures. We derived weighted and unweighted GRSs using these glucose variability-associated SNPs. The numbers of SNPs at each stage of instrument selection for each GV metric, including the initial SNP set, exclusion based on association with MRI outcomes, weak association with GV, and LD pruning, are listed in Supplementary Table 3.
Evaluation of MR assumptions 1, 2, and 3 at the genetic risk score (GRS) level
We also investigated the GRS-level MR assumption 1, which examined the associations between weighted and unweighted GRSs and glucose variability measures (Table 3). Our findings indicate significant positive associations between weighted and unweighted GRSs and glucose variability measures with and without adjustment, thereby meeting assumption 1. As the weighted or unweighted GRS increases, the values of glucose variability measures correspondingly increase.
Association of genetic risk scores with glucose variation in patients with type 2 diabetes (MR assumption 1)
We then explored GRS-level MR assumption 2, which examined the relationship between unweighted and weighted GRSs and covariates. Linear regression analyses were conducted to examine the associations of glucose variability-related unweighted and weighted GRSs with various covariates including lifestyle behaviors, clinical and biochemical markers, sociodemographic factors, and comorbidities. The significant covariates associated with glucose variability measures are presented in Supplementary Table 4. These covariates failed to meet assumption 2 and thus were not considered for adjustment in the initial stage of modeling to derive the glucose variability-related scores using GRSs.
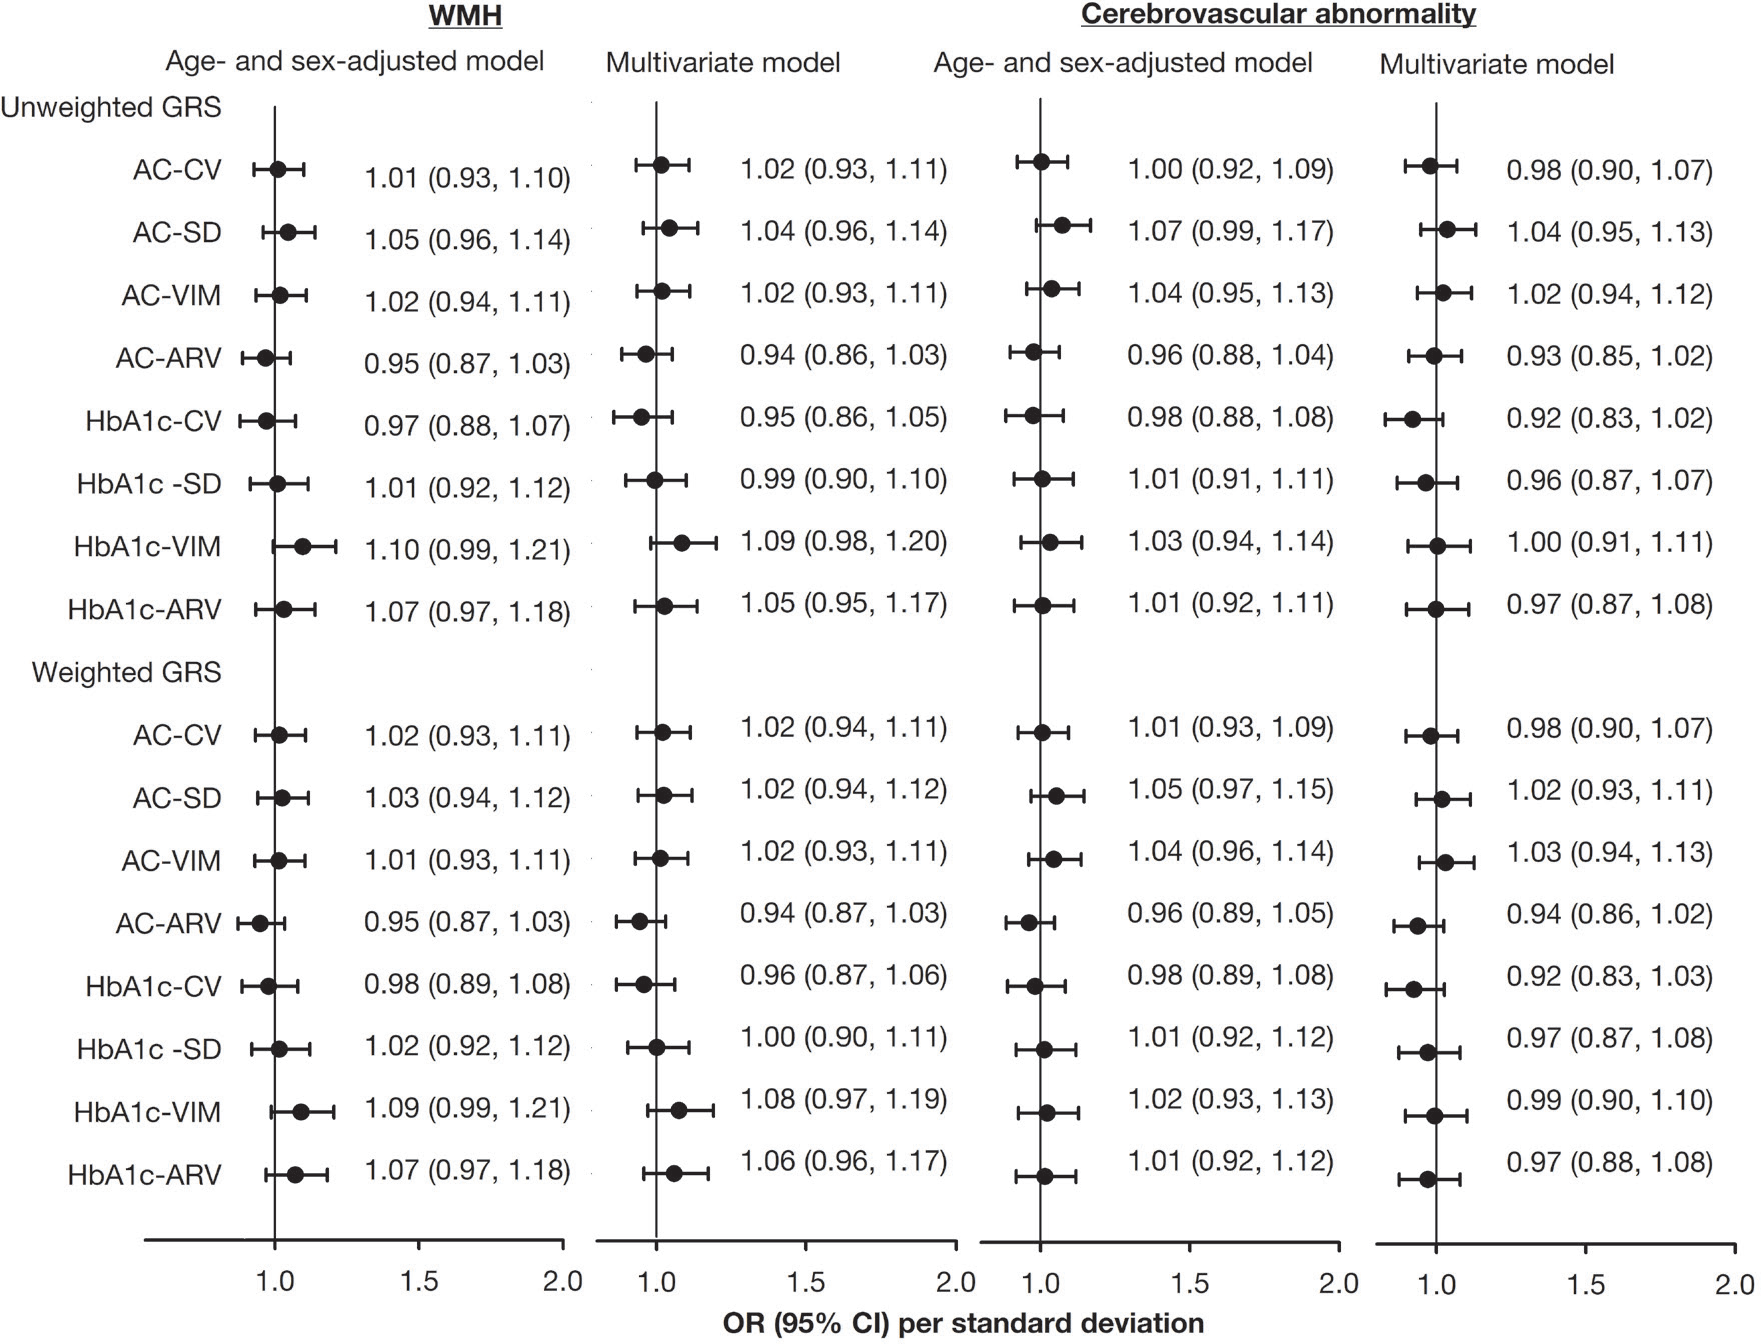
We also assessed GRS-level MR assumption 3, which investigated the association of unweighted and weighted GRSs with WMH and cerebrovascular abnormalities (Figure 2). The unweighted and weighted GRSs for glucose variability measures were not significantly associated with WMH or cerebrovascular abnormalities, regardless of whether age and sex were adjusted or multivariate adjustment was performed, thereby meeting assumption 3.
Association of genetic risk scores with WMH or cerebrovascular abnormality in patients with type 2 diabetes for genetic risk score level (MR assumption 3). Multivariate model adjusting for age, sex, lifestyle behaviors, diabetes-related variables, comorbidity, drug-related variables and biomarker.
Associations between glucose variability and brain MRI variables determined using an MR approach
Table 4 shows the ORs of the presence of WMH and cerebrovascular abnormalities associated with genetic-related glucose variability, derived from the unweighted and weighted GRSs with and without adjustment. The genetic-related glucose variability scores denoted a genetic predisposition to glucose variability and were obtained by regressing glucose variability measures on the unweighted and weighted GRSs. With respect to the presence of WMH per 1 SD increase in glucose variability scores with residual adjustment, the ORs were significant for AC-CV and AC-VIM in the unweighted GRS and for AC-VIM in the weighted GRS. After the multivariate adjustment, the ORs of the presence of WMH remained significant for AC-VIM in the unweighted GRS. In contrary, the ORs for AC-CV in the unweighted GRS and AC-VIM in the weighted GRS became insignificant after the multivariate adjustment. Among the glucose variability metrics in the unweighted GRS that were significantly associated with multivariate adjustment, only AC-VIM (OR per 1SD: 1.17, 95% CI: 1.08-1.27) was positively associated.
The odds ratios of WMH or cerebrovascular abnormality for predictive glucose variation derived from unweighted and weighted GRS using MR approach
The ORs of the presence of cerebrovascular abnormalities per 1 SD increase in glucose variability scores with residual adjustment were significant for all the unweighted and weighted GRSs. After multivariate adjustment, all the significant ORs of the presence of cerebrovascular abnormalities remained significant for the unweighted and weighted GRSs, except for the AC-ARV unweighted GRS. Among the glucose variability metrics in the unweighted GRS that were significantly associated with multivariate adjustment, the OR per 1 unit change for glucose variability measures ranged from 1.14 (1.04, 1.25) for AC-SD to 1.37 (1.26, 1.50) for HbA1c-VIM.
DISCUSSION
In this study, the associations between glucose variability and brain MRI indicators were thoroughly assessed using MR and epidemiologic approaches. When applied the epidemiologic approach, we did not observe any significant associations between glucose variability and WMH. However, we found significant associations between all the FPG variability metrics and cerebrovascular abnormalities. With the MR approach, the absence of significant associations between the weighted or unweighted genetic risk scores and WMH or cerebrovascular abnormalities supports the validity of MR assumption 3, suggesting no evidence of direct genetic effects on the outcomes. In contrast, the two-stage MR analyses revealed a significant association between genetically predicted FPG variability, as measured by AC-VIM, and WMH, with a 17% increase in odds per 1 SD increase when the unweighted GRS was used. These findings reflect an indirect effect of genetic instruments on WMH mediated through glycemic variability rather than a direct instrument-outcome association. The association was not significant for AC-VIM in the weighted model after the multivariate adjustment, indicating the potential specificity of this metric in the unweighted genetic context. For cerebrovascular abnormalities, the glucose variability metrics in the unweighted and weighted GRS models showed consistent and significant associations after full adjustment, with the exception of the AC-ARV in the unweighted GRS group. Among the significant metrics in the unweighted GRS group, the strongest association was observed with HbA1c-VIM (OR per 1 unit increase: 1.37; 95% CI: 1.26-1.50), followed by AC-SD (OR: 1.14; 95% CI: 1.04-1.25), highlighting the clinical relevance of glycemic variability as an independent risk factor for cerebrovascular pathology.
These findings underscore the importance of glycemic variability - beyond average glucose levels-as a potential independent risk factor for cerebral small vessel disease and cerebrovascular abnormalities. The observed association between FPG variability (AC-VIM) and WMH, particularly in the context of unweighted genetic risk, suggests that fluctuations in fasting glucose levels may contribute to subclinical brain injury. Moreover, the consistent and significant associations between cerebrovascular abnormalities and multiple glucose variability metrics, especially the strong link with HbA1c-VIM, support the hypothesis that long-term glycemic instability may play a causal role in vascular brain damage. From a clinical perspective, these results highlight the need to monitor and manage chronic hyperglycemia and glycemic fluctuations, particularly in individuals at high genetic risk, as part of strategies to reduce the burden of cerebrovascular disease and cognitive decline.
Only a few epidemiological and MR studies have investigated the association between visit-to-visit glucose variability and brain MRI parameters (14-16). One epidemiological study examined individuals with type 1 diabetes (14), and another focused on APOE4 genotype carriers with type 2 diabetes (15). One MR study assessed the relationship between HbA1c levels - rather than HbA1c variability-and WMH (16). In a study of individuals with type 1 diabetes, no association between HbA1c variability and cerebral small vessel disease was found among 189 neurologically asymptomatic participants (14). In contrast, our work demonstrated a consistent association between glucose variability and cerebrovascular abnormalities. This discrepancy may be attributed to our large sample size and the use of a composite outcome measure that includes stenosis or occlusion of major intracranial or internal carotid arteries, aneurysms, lacunar or small infarctions, intracerebral hemorrhage, and lobar infarctions-features that may increase the prevalence and statistical power of a study. In the investigation of WMH, previous epidemiological and MR studies reported differing findings: the former identified associations (15), and the latter did not (16). In an investigation of individuals aged 65 years and older with type 2 diabetes and carrying the APOE4 genotype (n = 124), HbA1c variability was found to be significantly associated with high WMH burden in APOE4 carriers (15). Two-sample MR analysis revealed no significant association between genetic liability and type 2 diabetes or between HbA1c levels and WMH (16). Although a significant association between FPG-VIM and WMH was found in this work, most other glucose variability metrics were consistent with the MR findings. Substantial methodological differences were noted between the above studies and the current study. These epidemiological studies focused on older adults with type 2 diabetes who carry the APOE4 allele; despite having a relatively large sample size, our work focused on asymptomatic adults over the age of 30 years with type 2 diabetes. Thus, the prevalence of WMH in our study was relatively low, which may have resulted in limited statistical power. Further research is warranted to clarify these associations.
Several limitations of this study should be acknowledged. First, the glucose-related variables - FPG and HbA1c - were derived from routine clinical monitoring, resulting in variability in the number of measurements obtained across the participants. To mitigate this issue, we adjusted for the number of FPG and HbA1c measurements when calculating variability indices. Moreover, these glucose measurements were collected prior to the brain MRI assessments, and the duration between the two procedures may not have been sufficient to capture the full temporal relationship between glucose variability and brain MRI outcomes. Second, the study sample may not be representative of the broad type 2 diabetes population; the study subjects may have undergone brain MRI for specific clinical indications. In clinical settings, brain MRI is often performed in the presence of suspected or known cerebrovascular pathology. Hence, the participants included in this analysis may have had underlying cerebrovascular symptoms or risk factors, limiting the generalizability of the findings to individuals with type 2 diabetes who do not present with such concerns. Third, cerebrovascular abnormalities were analyzed as a composite binary variable encompassing heterogeneous lesion types, including large-vessel stenosis or occlusion, aneurysms, lacunar infarctions, intracerebral hemorrhage, and lobar infarctions. Owing to the structure of the Clinical Research Data Repository and the pre-specified data request at the time of application, lesion-specific information was not available for further stratified or severity-based analyses. The use of a composite endpoint may introduce heterogeneity, as these lesions differ in terms of their underlying pathophysiology and clinical significance. Such heterogeneity is more likely to bias associations toward the null, potentially diluting lesion-specific effects of glycemic variability rather than inflating them. Therefore, the observed associations should be interpreted as conservative estimates of the relationship between glycemic variability and overall cerebrovascular disease burden. Future studies with access to detailed neuroimaging phenotypes are warranted to disentangle lesion-specific associations and to evaluate whether glycemic variability differentially influences ischemic, hemorrhagic, and large-vessel cerebrovascular processes. Fourth, although WMH is a canonical marker of cerebral small-vessel disease, WMH was available only as a binary measure in the current dataset. Information on WMH volume or severity grade was not accessible because of the structure of the clinical imaging data repository. As a result, we were unable to examine dose-response relationships or formally assess effect modification by WMH burden in the association between glycemic variability and other cerebrovascular abnormalities. Future studies incorporating quantitative or graded WMH measures may provide further insights into whether the impact of glycemic variability differs across levels of small-vessel disease burden. Fifth, markers of neurodegenerative pathology, such as amyloid biomarkers or cognitive performance measures, were not available in this cohort. Although the APOE genotype was included in the genetic analyses, the lack of phenotypic neurodegenerative data limits our ability to distinguish between purely vascular pathology and mixed vascular-neurodegenerative processes underlying the observed MRI findings. Finally, causal inferences cannot be drawn because this cohort study was observational. The findings represent associations rather than definitive causal relationships. In addition, the association between glucose variability and WMH was not consistently observed across the epidemiological and MR approaches. For the MR analysis, this inconsistency may be attributed to the use of weak instrumental variables, which could limit the strength and reliability of the causal estimates.
In conclusion, this study thoroughly evaluated the associations between glucose variability and brain MRI outcomes using epidemiological and MR approaches. Epidemiological and MR analyses revealed no significant association between glucose variability and WMH. Meanwhile, FPG and HbA1c variability were significantly associated with cerebrovascular abnormalities across most metrics. These findings emphasize the importance of monitoring and managing glucose variability, beyond measuring average glucose levels, in persons with type 2 diabetes to potentially mitigate cerebrovascular risk.
Acknowledgements:
we appreciate the iHi Research Platform/iHi Genomics from the Big Data Center of China Medical University Hospital for the data exploration, administrative, and statistical analytic support.
-
Funding:
this study was supported primarily by the Ministry of Science and Technology, Taiwan (MOST 109-2314-B-039-031-MY2, MOST 110-2314-B-039-021-, and MOST 111-2314-B-039-018-), National Science and Technology Council, Taiwan (NSTC 112-2314-B-039-042-, NSTC 113-2314-B-039-042- and NSTC 114-2314-B-039-027-), and China Medical University Hospital, Taiwan (DMR-115-194).
SUPPLEMENTARY MATERIALS
Supplementary figure 1


The Intercepts for the associations between glucose variation and WMH or cerebrovascular abnormality from MR-Egger regression
The number of SNPs at each stage of instrument selection for each GV metric, including the initial SNP set, exclusion based on association with MRI outcomes, weak association with GV, and LD pruning
Data availability:
datasets related to this article will be available upon request to the corresponding author.
REFERENCES
-
1 International Diabetes Federation (IDF). IDF Diabetes Atlas. 10th ed. Brussels: IDF; 2021. Available from: https://diabetesatlas.org/atlas/tenth-edition/
» https://diabetesatlas.org/atlas/tenth-edition/ -
2 King H, Aubert RE, Herman WH. Global burden of diabetes, 1995-2025: prevalence, numerical estimates, and projections. Diabetes Care. 1998;21(9):1414-31. doi: 10.2337/diacare.21.9.1414 .
» https://doi.org/10.2337/diacare.21.9.1414 -
3 Chatterjee S, Khunti K, Davies MJ. Type 2 diabetes. Lancet. 2017;389(10085):2239-51. doi: 10.1016/S0140-6736(17)30058-2.
» https://doi.org/10.1016/S0140-6736(17)30058-2. -
4 Fowler MJ. Microvascular and Macrovascular Complications of Diabetes. Clinical Diabetes. 2011;29(3):116-22. doi: 10.2337/diaclin.29.3.116.
» https://doi.org/10.2337/diaclin.29.3.116. -
5 Lin X, Xu Y, Pan X, Xu J, Ding Y, Sun X, et al. Global, regional, and national burden and trend of diabetes in 195 countries and territories: an analysis from 1990 to 2025. Scientific reports. 2020;10(1):14790. doi: 10.1038/s41598-020-71908-9.
» https://doi.org/10.1038/s41598-020-71908-9. -
6 GBD 2016 Causes of Death Collaborators. Global, regional, and national age-sex specific mortality for 264 causes of death, 1980-2016: a systematic analysis for the Global Burden of Disease Study 2016. Lancet (London, England). 2017;390(10100):1151-210. doi: 10.1016/S0140-6736(17)32152-9.
» https://doi.org/10.1016/S0140-6736(17)32152-9. -
7 Sarwar N, Gao P, Seshasai SR, Gobin R, Kaptoge S, Di Angelantonio E, et al. Diabetes mellitus, fasting blood glucose concentration, and risk of vascular disease: a collaborative meta-analysis of 102 prospective studies. Lancet (London, England). 2010;375(9733):2215-22. doi: 10.1016/S0140-6736(10)60484-9.
» https://doi.org/10.1016/S0140-6736(10)60484-9. -
8 Duckworth W, Abraira C, Moritz T, Reda D, Emanuele N, Reaven PD, et al. Glucose control and vascular complications in veterans with type 2 diabetes. The New England journal of medicine. 2009;360(2):129-39. doi: 10.1056/NEJMoa0808431.
» https://doi.org/10.1056/NEJMoa0808431. -
9 Patel A, MacMahon S, Chalmers J, Neal B, Billot L, Woodward M, et al. Intensive blood glucose control and vascular outcomes in patients with type 2 diabetes. N Engl J Med. 2008;358(24):2560-72. doi: 10.1056/NEJMoa0802987.
» https://doi.org/10.1056/NEJMoa0802987. -
10 Ismail-Beigi F, Craven T, Banerji MA, Basile J, Calles J, Cohen RM, et al. Effect of intensive treatment of hyperglycaemia on microvascular outcomes in type 2 diabetes: an analysis of the ACCORD randomised trial. Lancet (London, England). 2010;376(9739):419-30. doi: 10.1016/S0140-6736(10)60576-4.
» https://doi.org/10.1016/S0140-6736(10)60576-4. -
11 Schmidt R, Scheltens P, Erkinjuntti T, Pantoni L, Markus HS, Wallin A, et al. White matter lesion progression: a surrogate endpoint for trials in cerebral small-vessel disease. Neurology. 2004;63(1):139-44. doi: 10.1212/01.WNL.0000134675.63950.9A.
» https://doi.org/10.1212/01.WNL.0000134675.63950.9A. -
12 Matsusue E, Sugihara S, Fujii S, Ohama E, Kinoshita T, Ogawa T. White matter changes in elderly people: MR-pathologic correlations. Magn Reson Med Sci. 2006;5(2):99-104. doi:10.2463/mrms.5.99.
» https://doi.org/10.2463/mrms.5.99. -
13 Debette S, Markus HS. The clinical importance of white matter hyperintensities on brain magnetic resonance imaging: systematic review and meta-analysis. BMJ (Clinical research ed). 2010;341:c3666. doi: 10.1136/bmj.c3666.
» https://doi.org/10.1136/bmj.c3666. -
14 Inkeri J, Adeshara K, Harjutsalo V, Forsblom C, Liebkind R, Tatlisumak T, et al. Glycemic control is not related to cerebral small vessel disease in neurologically asymptomatic individuals with type 1 diabetes. Acta diabetologica. 2022;59(4):481-90. doi: 10.1007/s00592-021-01821-2.
» https://doi.org/10.1007/s00592-021-01821-2. -
15 Livny A, Ravona-Springer R, Heymann A, Priess R, Kushnir T, Tsarfaty G, et al. Long-term Variability in Glycemic Control Is Associated With White Matter Hyperintensities in APOE4 Genotype Carriers With Type 2 Diabetes. Diabetes care. 2016;39(6):1056-9. doi: 10.2337/dc15-2686.
» https://doi.org/10.2337/dc15-2686. -
16 Garfield V, Farmaki AE, Fatemifar G, Eastwood SV, Mathur R, Rentsch CT, et al. Relationship Between Glycemia and Cognitive Function, Structural Brain Outcomes, and Dementia: A Mendelian Randomization Study in the UK Biobank. Diabetes. 2021;70(10):2313-21. doi: 10.2337/db20-0895.
» https://doi.org/10.2337/db20-0895. -
17 Kilpatrick ES, Rigby AS, Atkin SL. A1C variability and the risk of microvascular complications in type 1 diabetes: data from the Diabetes Control and Complications Trial. Diabetes Care. 2008 Nov;31(11):2198-202. doi: 10.2337/dc08-0864.
» https://doi.org/10.2337/dc08-0864. -
18 Chiang HY, Liang LY, Lin CC, Chen YJ, Wu MY, Chen SH, et al. Electronic medical record-based deep data cleaning and phenotyping improve the diagnostic validity and mortality assessment of infective endocarditis: medical big data initiative of CMUH. Biomedicine (Taipei). 2021;11(3):59-67. doi: 10.37796/2211-8039.1267.
» https://doi.org/10.37796/2211-8039.1267. -
19 Purcell S, Neale B, Todd-Brown K, Thomas L, Ferreira MA, Bender D, et al. PLINK: a tool set for whole-genome association and population-based linkage analyses. Am J Hum Genet. 2007 Sep;81(3):559-75. doi: 10.1086/519795.
» https://doi.org/10.1086/519795. -
20 Howie BN, Donnelly P, Marchini J. A flexible and accurate genotype imputation method for the next generation of genome-wide association studies. PLoS Genet. 2009;5(6):e1000529. doi:10.1371/journal.pgen.1000529.
» https://doi.org/10.1371/journal.pgen.1000529. -
21 Chen P, Takeuchi F, Lee JY, Li H, Wu JY, Liang J, et al.; CHARGE Hematology Working Group; Gross MD, Assimes TL, Miki T, Shu XO, Qi L, Chen YT, Lin X, Aung T, Wong TY, Teo YY, Kim BJ, Kato N, Tai ES. Multiple nonglycemic genomic loci are newly associated with blood level of glycated hemoglobin in East Asians. Diabetes. 2014 Jul;63(7):2551-62. doi: 10.2337/db13-1815.
» https://doi.org/10.2337/db13-1815. -
22 Soranzo N, Sanna S, Wheeler E, Gieger C, Radke D, Dupuis J, et al. Common variants at 10 genomic loci influence hemoglobin A₁(C) levels via glycemic and nonglycemic pathways. Diabetes. 2010;59(12):3229-39. doi: 10.2337/db10-0502.
» https://doi.org/10.2337/db10-0502. -
23 Wheeler E, Leong A, Liu CT, Hivert MF, Strawbridge RJ, Podmore C, et al. Impact of common genetic determinants of Hemoglobin A1c on type 2 diabetes risk and diagnosis in ancestrally diverse populations: A transethnic genome-wide meta-analysis. PLoS medicine. 2017;14(9):e1002383. doi: 10.1371/journal.pmed.1002383.
» https://doi.org/10.1371/journal.pmed.1002383. -
24 Hwang JY, Sim X, Wu Y, Liang J, Tabara Y, Hu C, et al. Genome-wide association meta-analysis identifies novel variants associated with fasting plasma glucose in East Asians. Diabetes. 2015;64(1):291-8. doi: 10.2337/db14-0563.
» https://doi.org/10.2337/db14-0563. -
25 Ramos E, Chen G, Shriner D, Doumatey A, Gerry NP, Herbert A, et al. Replication of genome-wide association studies (GWAS) loci for fasting plasma glucose in African-Americans. Diabetologia. 2011;54(4):783-8. doi: 10.1007/s00125-010-2002-7.
» https://doi.org/10.1007/s00125-010-2002-7. -
26 Ai S, Wang X, Wang S, Zhao Y, Guo S, Li G, et al. Effects of glycemic traits on left ventricular structure and function: a mendelian randomization study. Cardiovascular diabetology. 2022;21(1):109. doi: 10.1186/s12933-022-01540-6.
» https://doi.org/10.1186/s12933-022-01540-6. -
27 Emanuelsson F, Marott S, Tybjærg-Hansen A, Nordestgaard BG, Benn M. Impact of Glucose Level on Microand Macrovascular Disease in the General Population: A Mendelian Randomization Study. Diabetes Care. 2020 Apr;43(4):894-902. doi: 10.2337/dc19-1850.
» https://doi.org/10.2337/dc19-1850. -
28 Gottsäter M, Hindy G, Orho-Melander M, Nilsson PM, Melander O. A genetic risk score for fasting plasma glucose is independently associated with arterial stiffness: a Mendelian randomization study. J Hypertens. 2018 Apr;36(4):809-814. doi: 10.1097/HJH.0000000000001646.
» https://doi.org/10.1097/HJH.0000000000001646. -
29 Leong A, Chen J, Wheeler E, Hivert MF, Liu CT, Merino J, et al. Mendelian Randomization Analysis of Hemoglobin A1c as a Risk Factor for Coronary Artery Disease. Diabetes Care. 2019 Jul;42(7):1202-1208. doi: 10.2337/dc18-1712.
» https://doi.org/10.2337/dc18-1712. -
30 van Oort S, Beulens JWJ, van Ballegooijen AJ, Burgess S, Larsson SC. Cardiovascular risk factors and lifestyle behaviours in relation to longevity: a Mendelian randomization study. J Intern Med. 2021 Feb;289(2):232-243. doi: 10.1111/joim.13196.
» https://doi.org/10.1111/joim.13196. -
31 Yang G, Au Yeung SL, Schooling CM. Sex differences in the association of fasting glucose with HbA1c, and their consequences for mortality: A Mendelian randomization study. EBioMedicine. 2022 Oct;84:104259. doi: 10.1016/j.ebiom.2022.104259.
» https://doi.org/10.1016/j.ebiom.2022.104259. -
32 Rasmussen-Torvik LJ, Li M, Kao WH, Couper D, Boerwinkle E, Bielinski SJ, et al. Association of a fasting glucose genetic risk score with subclinical atherosclerosis: The Atherosclerosis Risk in Communities (ARIC) study. Diabetes. 2011 Jan;60(1):331-5. doi: 10.2337/db10-0839.
» https://doi.org/10.2337/db10-0839.
Edited by
-
Associated editor:
Marcelo Mori https://orcid.org/0000-0001-7112-5263