Exploring design solution spaces for optimising timber consuption in high-rise engineered wood structures
Abstract
In engineered timber construction, the configuration of the structural system is crucial for achieving material efficiency and ensuring structural adequacy. This study proposes a parametric design approach combined with genetic algorithms to explore solution spaces for multi-storey engineered timber buildings. The key variables considered were the number of storeys, building dimensions, timber strength classes and the cross-sectional dimensions of the structural elements. The results showed that timber consumption was influenced not only by span lengths, the number of storeys and the dimensions of the members, but also by the strength class of the material and the stiffness of the bracing core. For most structural members, maximum displacement governed structural adequacy, whereas shear was the governing criterion for girders. Additionally, global stability emerged as a significant design constraint from the eleventh storey onwards. Dynamic analysis of the floor system showed that natural frequencies were primarily influenced by girder stiffness and generally remained above the normative 8 Hz limit. A subsequent cost analysis showed that transitions between strength classes lead to marked increases in cost per area, with a reduced impact for combined classes.
Keywords
Timber Structures; Parametric modelling of structures; Design solution spaces; Structural optimisation; Genetic algorithm
Resumo
Na construção com madeira engenheirada, a configuração do sistema estrutural é crucial para alcançar eficiência no uso de materiais e garantir a adequação estrutural. Este estudo propõe uma abordagem de projeto paramétrico combinada com algoritmos genéticos para explorar espaços de soluções para edifícios de múltiplos pavimentos em madeira engenheirada. As principais variáveis consideradas foram o número de pavimentos, as dimensões do edifício, as classes de resistência da madeira e as dimensões das seções transversais dos elementos estruturais. Os resultados mostraram que o consumo de madeira foi influenciado não apenas pelos vãos, número de pavimentos e dimensões dos elementos, mas também pela classe de resistência do material e pela rigidez do núcleo de contraventamento. Para a maioria dos elementos estruturais, o deslocamento máximo foi o critério determinante para a adequação estrutural, enquanto o cisalhamento foi o critério dominante para as vigas principais. Além disso, a estabilidade global surgiu como uma restrição significativa de projeto a partir do décimo primeiro pavimento. A análise dinâmica do sistema de piso mostrou que as frequências naturais foram influenciadas principalmente pela rigidez das vigas principais e, em geral, permaneceram acima do limite normativo de 8 Hz. Uma análise de custos subsequente mostrou que as transições entre classes de resistência levam a aumentos acentuados no custo por área, com um impacto reduzido para classes combinadas.
Palavras-chave
Estruturas de Madeira; Modelagem paramétrica de estruturas; Espaço soluções de projeto; Otimização estrutural; Algoritmo genético
1 Introduction
The use of timber in civil construction has intensified in recent years, driven by the development of new industrial processes that have expanded its applicability in structural systems. The products resulting from these advancements are collectively referred to as Engineered Wood Products (EWPs) (Shigue, 2018). Among the most prominent EWPs are glued laminated timber (Glulam) and cross-laminated timber (CLT).
From a structural standpoint, engineered timber has enabled the development of new construction alternatives, allowing for more robust and versatile structural configurations. Its range of applications is further broadened when combined with digital fabrication, which allows for advanced modelling and diverse geometric solutions (Al-Qaryouti; Baber; Gattas, 2019). Another key advantage of engineered timber is its potential to support more sustainable construction practices (Oliveira, 2023; Wang et al., 2024). Compared to conventional materials such as masonry and steel, engineered timber offers a lower self-weight, which facilitates transportation and on-site assembly. These characteristics contribute to shorter construction times and cost optimization, particularly in industrial, commercial, and residential projects (EWA, 2020).
In terms of design, the integration of parametric modelling into the development of EWP structural systems enhances both efficiency and flexibility. This approach enables the iterative exploration of different configurations from the early stages of the project, thereby streamlining building performance analysis (Leone, 2017; Wang; Lu; Zhang, 2025). Another valuable design strategy involves the concept of solution spaces. According to Stumpf et al. (2022), this methodology incorporates various disciplinary requirements to define multidimensional regions of feasible solutions using a set-based design model. These regions are represented by admissible ranges for each design variable, allowing for the identification of ideal intervals for parameters such as spans, building dimensions, cross-sectional geometry, and total building height. This strategy supports a more precise analysis of variable interdependencies, improving the assessment of structural efficiency and mechanical performance.
In this context, Bucher et al. (2023) employed parametric modelling techniques combined with genetic algorithms to design and analyse a dataset of bridge models. Along similar lines, Brown and Mueller (2019) applied the concepts of parametric modelling and solution spaces to investigate variables associated with truss structural system design. In a similar approach, Silva and Pimentel (2023) developed solution spaces for warehouse structures using two-dimensional plots generated by a genetic algorithm. Hens, Solnosky; Brown (2021) also explored solution spaces for engineered timber design through parametric modelling, focusing primarily on minimizing embodied carbon.
In this context, the aim of this study is to propose a method based on parametric modelling combined with genetic algorithms to explore design solution spaces for multi-storey engineered timber buildings. This method will support the definition of optimised design guidelines in the early stages of structural conception. Specifically, the study seeks to:
-
identify structurally feasible configurations that minimise timber consumption;
-
analyse how geometric variables and strength classes influence safety and serviceability criteria;
-
evaluate the dynamic behaviour of the floor system based on the obtained natural frequencies; and
-
conduct a comparative cost analysis of the different structural scenarios generated.
2 Methodology
2.1 Design variables for sampling design solution spaces
To support the selection of design variables aligned with current construction practices in the building industry, data from the WoodWorks Innovation Network (WIN, 2024) was used. This database compiles information on the characteristics of buildings that utilize engineered wood structural systems in the United States and Canada. Although this information is regional, it reflects industry tendencies that may inform broader global trends in the use of engineered timber. For simplification purposes, however, foundation elements and lower floors – typically constructed from reinforced concrete – were excluded from the modelling process. Furthermore, the selection and modelling of variables did not consider the metal connectors typically used between timber structural components. Based on this database, the boundaries of the structural system domains for post-beam-panel configurations with a reinforced concrete bracing core were defined, as outlined by the design variable ranges in Table 1 and illustrated in Figure 1. These structural system instances enabled the sampling and exploration of design solution spaces using a genetic algorithm.
Description of the main characteristics of engineered wood buildings considered in this research

2.2 Parametric structural model
The construction of the parametric model (PM) integrates structural geometry through input variables such as span length, number of storeys, and the repetition of basic units, using the Grasshopper tool within the Rhinoceros software. Each unit consists of a spatial frame composed of four Glulam beams, four Glulam columns, and a single CLT slab panel. The model allows for the horizontal replication of either three or five basic units.
The rectangular cross-sections of the beams were selected from the Glued Laminated Beam Design Tables by APA (EWA, 2016) and classified into two types: tie beams (aligned along the x-axis and providing bracing) and girders (aligned along the y-axis and supporting the slab). These parameters allow for adjustments in both span length and cross-sectional dimensions. The cross-sections of the columns were also defined using the same catalogue as the beams, with the distinction that column sections could include up to nine layers replicated along the y-axis. For the strength classes of the structural members, the classifications provided by the EN 14080 standard (ECS, 2013) were adopted. These strength classes are defined based on bending capacity and the composition of lamelas – whether they consist of a single wood species (homogeneous, indicated by the suffix “h”) or a combination of two wood species (combined, indicated by the suffix “c”).
For the CLT slab panels, the geometric and mechanical properties were based on the ANSI/APA PRG 320 standard (EWA, 2017), in which class E refers to mechanically graded structural timber, class V to visually graded timber, and class S to timber that has undergone specific industrial processes to enhance strength.
A centrally located reinforced concrete bracing core was also included, with floor plan dimensions equivalent to those of a single basic unit. In the structural model, the slabs, beams, and bracing core walls were assumed to be made of reinforced concrete with a characteristic compressive strength of 30 MPa.
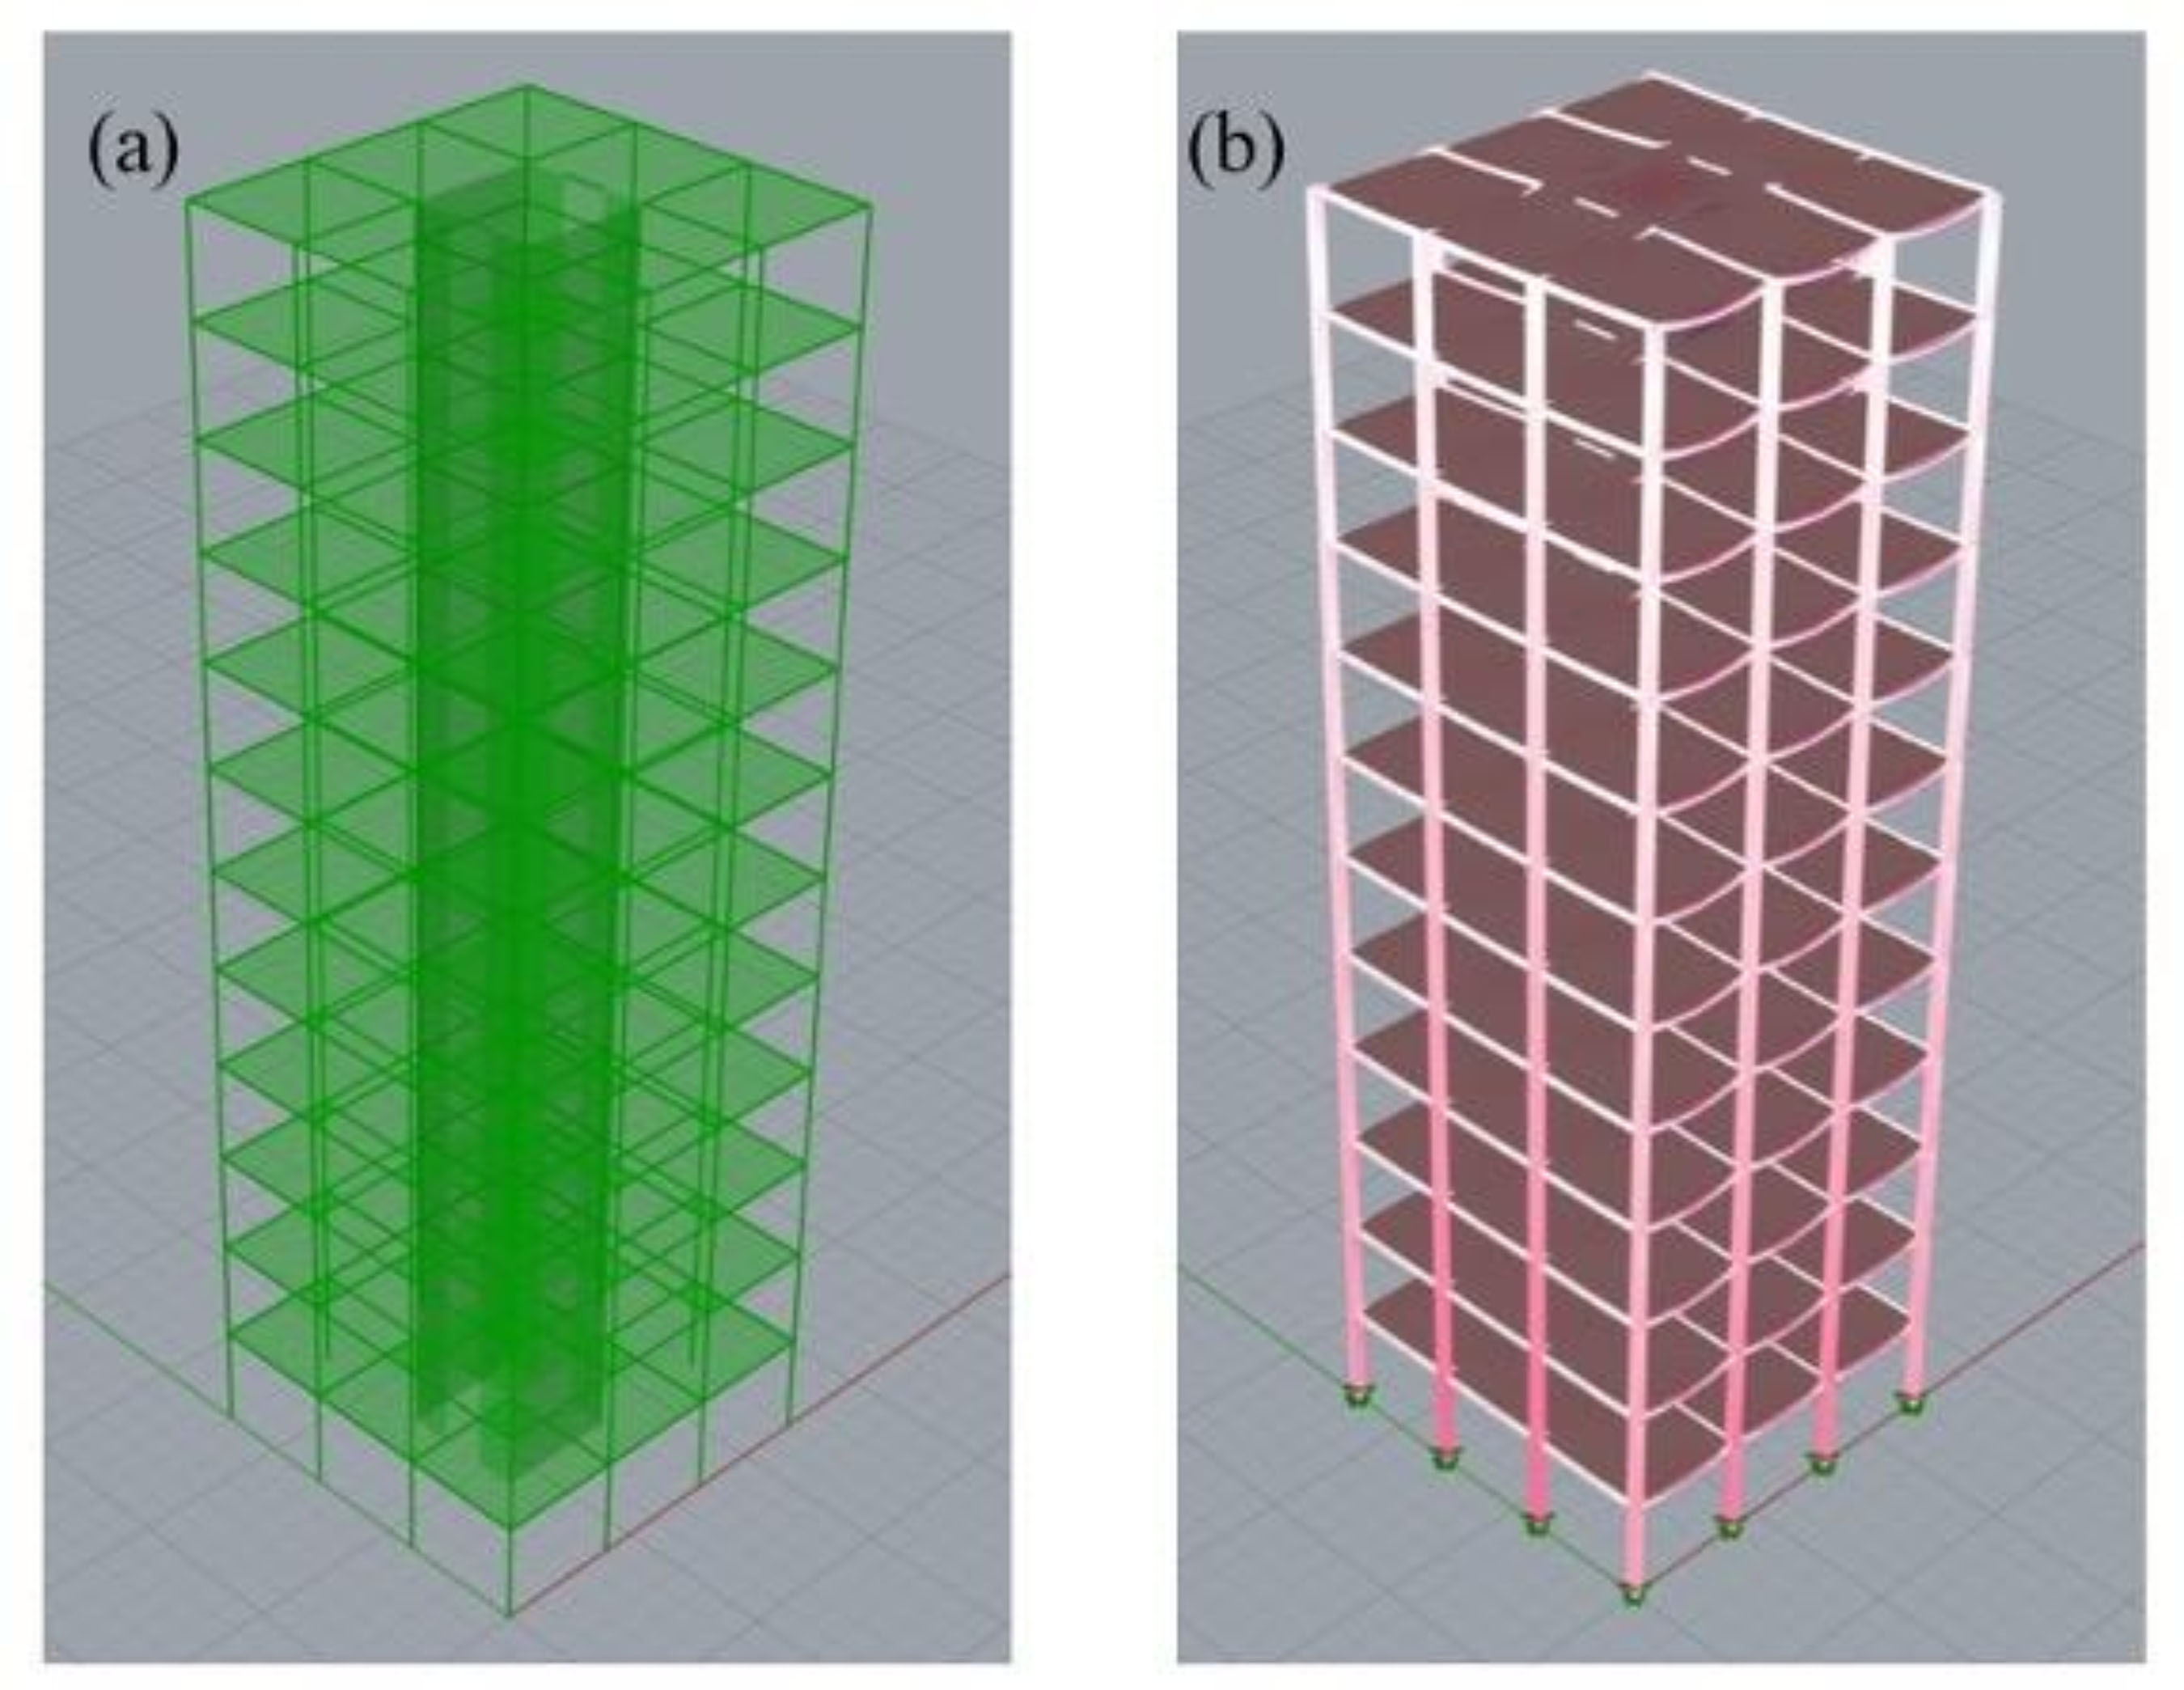
Finally, each combination of variable values defines a distinct structural instance, composed of basic units replicated in both vertical and horizontal directions. Figure 2a illustrates the three-dimensional geometric model of one such instance, in which linear segments represent beams and columns, while polygonal meshes represent the slab panels and bracing core walls.

Visualization of the parametric three-dimensional model (a) and finite element model (b) of the same instance
2.3 Finite element modelling using Karamba3D
Using the Karamba3D tool, a finite element model (FEM) was generated, in which the beams and columns from the geometric model were defined as frame elements, while the polygonal meshes representing the slab panels were modelled as shell elements. Supports were placed at the base of the columns and configured as pinned restraints. The finite element representation of one structural instance is shown in Figure 2-b.
Three types of loads were considered, with values extracted from Eurocode 1 (ECS, 2002), NBR 6123 (ABNT, 1988) (the Brazilian standard for wind loads), and NBR 6120 (ABNT, 2019) (the Brazilian standard for building design loads):
-
wind load acting in the yz plane, with wind speed ranging from 20 to 50 m/s;
-
gravitational loads for residential buildings, including a distributed load of 1.5 kN/m² applied to the floor slabs (representing residential occupancy), and a linear load of 0.6 kN/m along the slab perimeter (representing external wall cladding); and
-
self-weight of all structural elements.
It is also worth noting that the connections between slabs, beams, and columns were modelled as pinned joints to reflect practical construction behaviour.
2.4 Verification of safety and serviceability of the structural system
To verify the engineered wood structural elements used in this study, two approaches were adopted:
-
beams and columns: verification was performed in accordance with the Brazilian standard NBR 7190 – Design of Timber Structures (ABNT, 2022); and
-
slabs: the verification methodology was based on The CLT Handbook: CLT Structures – Facts and Planning (FSS, 2019), which follows Eurocode 5 – Design of Timber Structures (ECS, 2004).
Internal force values were obtained from the finite element model generated using Karamba3D. Based on these values, the verification process was carried out using design factors (DF), which indicate how close a structural element is to the limit state defined by the relevant standards (Equation 1). For elements subjected to axial forces combined with bending, the following equations were considered.
Where:
is the design axial force, and are the design bending moments about the principal axes; and , and are the corresponding design resistances;
The coefficient accounts for stability effects under compression, including member slenderness and buckling phenomena, while and represent interaction effects between axial force and bending moments. Depending on the governing mechanism, these coefficients assume either unitary or code-prescribed values.
The critical moment for lateral buckling (Mm,crit) was also obtained according to Equation 2. When Mm,crit lower than or equal to or the value of the axial design factor (DFnormal) was considered to be greater than 1.
Where:
is the moment of inertia about the z-axis of the element;
is the torsional moment of inertia;
is the effective length;
is the fifth percentile value of the modulus of elasticity; and
is the fifth percentile value of the shear modulus.
The values for shear force were determined based on Equation 3.
Where:
and represent the design torsional moment and the allowable torsional moment, respectively;
and represent the design shear force and the allowable shear force in the y-axis, respectively; and
and represent the design shear force and the allowable shear force in the z-axis, respectively.
For the serviceability limit state, the verification of the building’s overall horizontal displacement and the element-level maximum displacements, obtained max), was performed against the corresponding code-prescribed limits:
for beams, where is the length of the element;
for slabs; and
for columns, where is the total height of the structural system.
Thus, the values for displacements were calculated using the following Equation 4:
Each instance was subjected to a second-order analysis, in which the ratio between the design axial force acting on the bar most susceptible to buckling (NII) and the critical axial force that would lead to global structural instability in the same bar (NB) was calculated. Accordingly, for a given instance to be considered acceptable under second-order effects, the DFBuckling value must satisfy the condition established in Equation 5.
Finally, there are indications that the stiffness of the floor-supporting beams – represented in the studied instances by the girders – contributes to a reduction in the natural frequency of the structural system formed by these beams and the CLT slabs. Therefore, a dynamic analysis was also carried out to determine the natural frequency of this system, hereafter referred to as the floor system. This frequency was used as an additional criterion for assessing the serviceability performance of susceptibility to human-induced vibrations. The obtained values were then compared with the commonly adopted minimum normative limit of 8 Hz for building floors. Although natural frequencies were not used as constraints in the optimisation process, they were analysed afterwards to assess the dynamic adequacy of the generated solutions.
2.5 Cost analysis
A simplified cost analysis was performed using representative unit prices for cross-laminated timber (CLT) panels and glued laminated timber members, as reported in the cost ranges of published techno-economic and economic studies on engineered timber (Brandt et al., 2019; Zhang; Lan, 2022; Zovkić; Dolacek-Alduk; Guljas, 2025; Liu et al., 2023). Prices were differentiated by strength or grading class to reflect differences in material performance and production processes. These unit prices are summarised in Table 2 and were used to estimate the material costs associated with each analysed structural configuration.
2.6 Sampling of design solution spaces
The elements generated by the parametric model (PM) were transformed and verified through a finite element model (FEM) using the Karamba3D plug-in. At each iteration, information related to design variables and structural performance was recorded. The analysis of timber consumption rates (Wrate) considered slabs, columns, and beams, expressed as a volume-to-area ratio in cubic meters per square meter (m³/m²) of built area.
Once the verification of a structural instance generated by the PM was completed, its performance was evaluated based on the relationship between its maximum design factor (DFmax(%), expressed as a percentage) and its timber consumption, using Galapagos, an optimization component within Grasshopper. This component modified the geometric dimensions of structural elements and the strength classes of engineered wood products to verify a new instance in the subsequent iteration. In this way, considering that DFmax(%) could not exceed 100%, it was possible to obtain optimized instances in terms of cross-sectional dimensions, structural configuration, and material strength classes – thus defining the solution space.
Unit prices for cross-laminated timber (CLT) panels and glued laminated timber members adopted in this study
In this regard, the Galapagos plug-in requires not only the definition of input variables for generating fitter instances but also the establishment of a fitness function, which ranks the best individuals produced by the genetic algorithm (Massone; Gabrieli; Rineiski, 2017). To perform a discrete and optimized sampling of the solution space, the fitness function was defined as the ratio between Wrate and DFmax(%) for each instance, minimizing this value as described by Equation 6. This approach targets instances that combine timber consumption close to the minimum with structural capacity approaching the allowable limit. When the maximum DFmax(%) exceeded 100%, the algorithm penalized the instance, guiding the sampling process toward structurally valid solutions (i.e., DFmax(%) < 100%).
Where:
is the value of the fitness function to be minimized for each instance;
is the wood consumption rate in m³/m²; and
is the maximum value of each instance in percentage terms.
During part of the sampling process, as a strategy to accelerate convergence, the fitness function was modified to minimize the expression in Equation 7. In other words, the genetic algorithm shifted its search toward instances with maximum DFmax(%) values closer to the structural capacity limit.
The evolutionary process involved a population of 50 individuals, elitism at 5%, an inbreeding rate of 75%, and a stagnation criterion of 50 generations. This prioritised exploration of the design solution space over convergence to a single optimum.
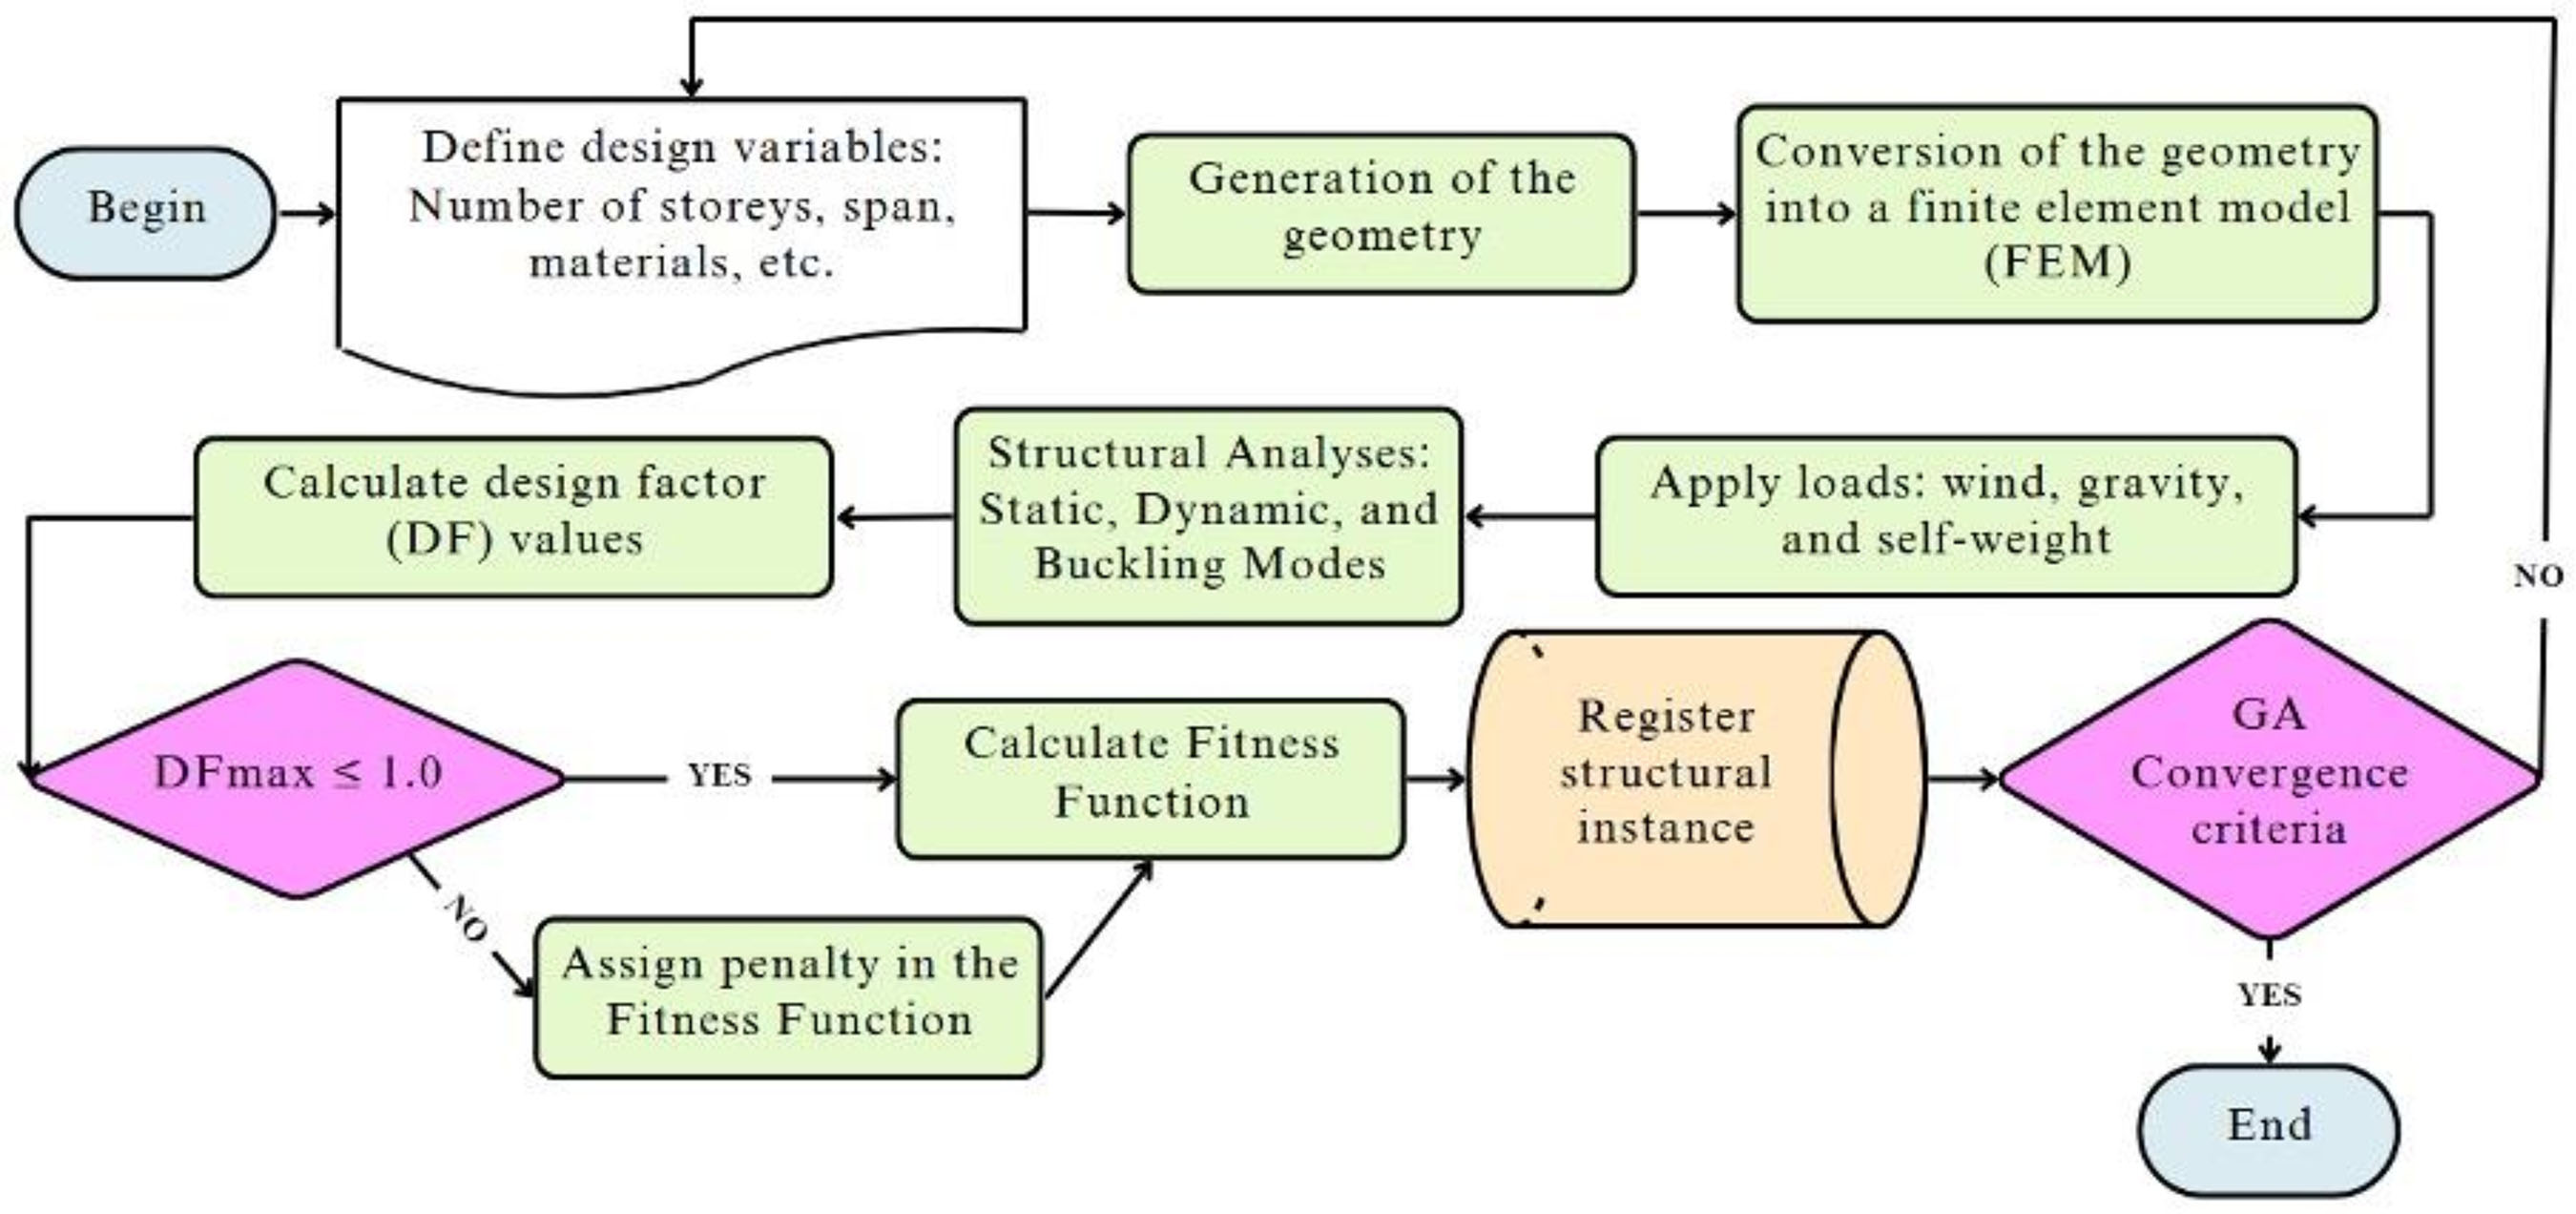
Thus, through an optimized search process, each instance evaluated by the genetic algorithm was recorded, thereby constituting the solution space. Figure 3 presents a flowchart illustrating the methodology employed by the algorithm to generate these solution spaces.

3 Results and analysis
Initially, the solution space sampling process generated 31,512 structural instances, which were organized into a data table in .CSV format. In the next step, instances that did not meet the structural acceptability criteria – specifically those whose maximum design factor (DFmax(%)) exceeded 100% - were excluded, resulting in a filtered set of 10,539 valid instances. The results are presented and analysed in the following sections, grouped according to structural design factors, timber consumption rate, and the natural frequency of the floor system, which comprised Glulam beams, Glulam columns, and CLT panels. For clarity, all DF values are expressed as percentages.
3.1 Timber consumption rate
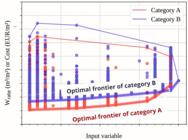
Before proceeding, the concept of the optimal frontier is introduced. It refers to the set of instances within the solution space that exhibit the most efficient use of material, defined with respect to the performance metric adopted on the ordinate, namely cost or Wrate. Figure 4 illustrates the optimal frontier for two fictional instance groupings, with material-efficient solutions located closer to the x-axis and highlighted by a thicker line weight.
3.1.1 Timber consumption rate related to span length
Regarding the CLT floor panels shown in Figure 5, it was observed that the 175 mm thickness could span up to 5 meters, while the 190 mm thickness accommodated spans of up to 6 meters. An analysis of the optimal frontiers indicated that the selection of these two thicknesses was efficient in terms of timber consumption for spans around 5 meters. In contrast, the 245 mm thickness demonstrated the highest material efficiency for spans ranging from 5.70 m to 7.00 m.

Another observation was the absence of instances with thicknesses of 105 mm and 114 mm. This finding aligned with the limitations reported by Föreningen Sveriges Skogsindustrier (FSS, 2019), which indicated that panels with thicknesses near 100 mm were not capable of spanning beyond 4 meters.
As for the tie beams, Figure 6a shows that for span lengths shorter than 5 meters, the GL24h, GL28h, and GL32h strength classes exhibited greater material efficiency. Overall, it was observed that the timber consumption rate among instances near the optimal frontier increased for spans exceeding 5 meters. The same figure also revealed that the GL32h and GL24c classes were the only ones capable of reaching spans beyond 6 meters, despite representing the strength classes with, respectively, the highest and lowest self-weight. It was also worth noting that, between 4 and 5 meters, the GL24c class did not yield lower timber consumption compared to the GL32h class.

Span × timber consumption rate (%) categorized by the strength classes of glulam (MLC) tie beams (a) and strength classes of glulam (MLC) girders (b)
Regarding the girders, Figure 6b shows that the GL24h and GL24c classes, which had the lowest self-weight values, allowed instances to achieve longer spans. Conversely, the GL32h class (with spans exceeding 7.5 m) and the GL32c class (limited to spans of 6 m) exhibited a considerable difference in girder span length despite sharing the same bending strength. This discrepancy was explained by the higher self-weight of GL32h being offset by increased strength values, whereas in GL32c this compensation was not proportional. Two key observations emerged from the optimal frontiers: first, from girder spans of 7.6 meters onward, classes with lower self-weight (GL24h and GL24c) began to result in lower material consumption rates; second, for spans between 4 and 6 meters, the choice of homogeneous glulam class had no significant effect on material efficiency, while combined classes displayed considerably lower efficiency.
3.1.2 Timber consumption rate related to the number of storeys
When the regions of the solution space were categorized according to the strength class of the columns, a general trend was observed: the timber consumption rate tended to increase as the number of storeys rose, as illustrated in Figure 7. In relation to the optimal frontiers of the glulam strength classes for columns, the GL32h class exhibited the highest efficiency. Conversely, the lighter and less resistant classes (GL24h and GL24c) resulted in higher timber consumption, even among the instances closest to the optimal frontier.

Number of storeys × timber consumption rate (%) categorized by the strength glulam classes of columns
The configuration of the graph in Figure 8 enables the analysis of the relationship between timber consumption rate and the number of storeys, considering the proportions of bracing core openings. It can be observed that the most robust category (opening ratio < 40%) was the only one capable of reaching beyond 17 storeys. Regarding the optimal frontier, the category with larger openings achieved greater material efficiency between the 7th and 16th floors.

Number of storeys in relation to timber consumption rate (%) categorized by bracing core opening proportions
From the graph in Figure 9a, it was possible to identify which structural elements governed safety and serviceability requirements. It was observed that from the 17th storey onward, the maximum DF values were primarily associated with the slabs, girders, and columns. Moreover, for most storeys, when tie beams governed the design, a significant increase in timber consumption was observed along the optimal frontier. Notably, up to the 6th storey, the fact that a particular element governed the design did not result in timber savings.

Number of storeys × Timber consumption rate (%) (a) and girder span × Timber consumption rate (%) (b), categorized by the structural element associated with the maximum design factor
Analysing the optimal frontiers in Figure 9b, it was demonstrated that when the CLT panels governed the design, timber consumption rates tended to be lower. Similar to the variation observed with the number of storeys, cases where tie beams governed the design exhibited lower material efficiency in relation to span length. Notably, tie beams governed only instances with spans between 4.0 and 7.2 meters, yet they consistently showed higher timber consumption at the optimal frontier when compared to other categories.
3.2 Design factors (DF)
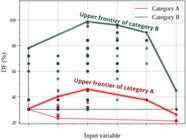
As with the material consumption rates, the analysis of DF values in the following sections focuses on the CLT floor panels, girders, tie beams, columns, and the structural bracing core. Before proceeding, the concept of the upper frontier is introduced. This refers to the set of solution space instances in which structural elements are operating close to their maximum capacity – representing designs with higher structural efficiency. Figure 10 illustrates the upper frontier for two hypothetical instance groups, in which solutions farther from the x-axis exhibit greater structural efficiency and are highlighted by a thicker line weight.
3.2.1 DF related to the span lengths
As can be seen in Figures 11a and 11b, which depict results for the CLT floor panels, most instances were governed by maximum deflection limits, with the upper frontier approaching the limit of structural capacity. Notably, the upper frontiers associated with rolling shear exhibited higher structural efficiency compared to those related to normal bending and shear stresses. This behaviour is explained by the low span-to-thickness ratio, which increases the susceptibility of CLT slabs to rolling shear (Glasner et al., 2023). Overall, all DF types showed a tendency to increase with increasing span length.

Slab span × CLT panel DF value (%) (a) and Girder span × CLT panel DF value (%) (b) related to the slabs, categorized by type of design factor
As for the tie beams, Figure 12a displays only the DF values associated with these structural elements. When analysing the category associated with maximum deflection, the upper frontiers approached the structural capacity limit, followed by a sharp decline beyond 6 meters. The upper frontiers associated with normal bending stresses not only reached higher levels than those related to shear but also showed a noticeable drop after 6 meters. It is important to highlight the significant influence of wind loading, particularly on shear: this category exhibited low structural efficiency, with upper frontier values ranging from 25% to 45%.

Slab span × DF value (%) categorized by the type of DF (a); Slab span × Maximum DF value (%) related to the tie beams and to the strength class of the tie beams (b)
In Figure 12b, the data points were plotted based on the maximum DF values of the tie beams and were categorized according to their engineered wood strength class. It was observed that tie beams of class GL32h exhibited the highest structural efficiency, as indicated by the position of their upper frontier. Classes GL28h and GL32c showed similar performance, while GL24c and GL24h displayed an upward trend in upper frontier values with increasing span lengths. Conversely, class GL28c demonstrated comparatively low structural efficiency.
Regarding the girders, Figure 13a displayed only the DF values associated with these structural elements. When analysing the categories related to shear, the upper frontiers were observed to be very close to the full structural capacity, showing a slight decline beyond 7.2 m. In contrast, the upper frontiers associated with normal bending stresses were lower and began to decrease at approximately 4.8 m. Overall, for this type of structural element, wind loading had no significant influence, as indicated by the overlapping of the respective categories. It was also noted that the category governed by maximum deflection showed low structural efficiency, with upper frontier values ranging from 25% to 40%.
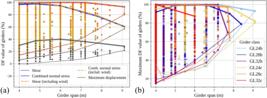
Girder span <inline-formula><math display="inline" xmlns="http://www.w3.org/1998/Math/MathML"><semantics><mi mathvariant="bold">×</mi><annotation encoding="application/x-tex">\mathbf{\times}</annotation></semantics></math></inline-formula> DF value (%) categorized by the type of DF (a); Girder span <inline-formula><math display="inline" xmlns="http://www.w3.org/1998/Math/MathML"><semantics><mi mathvariant="bold">×</mi><annotation encoding="application/x-tex">\mathbf{\times}</annotation></semantics></math></inline-formula> Maximum DF value (%) related to the girders and to the strength class of the girders (b)
Figure 13b plots the data points based on the girders' maximum DF values and categorises them according to their glulam strength class. Up to a span of 6.5 m, no specific glulam class consistently offered superior structural efficiency, except for GL32c, which performed comparatively poorly. Furthermore, the lighter classes (GL24h and GL24c) achieved longer spans without significant loss of structural efficiency, maintaining upper frontier values between 80% and 100%.
3.2.2 DF related to the number of storeys
Analysing the plot in Figure 14a, it was observed that up to the fourteenth storey, the governing effects were primarily due to bending stresses, either in isolation or in combination with wind loading. Beyond this height, displacement became the predominant factor influencing the upper frontiers. Unlike these stresses, shear exhibited considerably low DF values, indicating a slight influence of wind action in generating this type of stress.
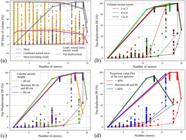
Number of storeys × Maximum DF value (%) related to the columns categorized by the type of design factor (a); Number of storeys × DF related to the top displacement (%): categorized by the number of layers (b); by the height of the column section (c); by the opening proportions of the bracing core (d)
Deepening the analysis of top displacement, the cross-sectional dimensions of the columns proved to be relevant, as shown in Figures 14b and 14c. In Figure 14b, the category with 4 to 6 layers exhibited a slightly more efficient upper frontier compared to the others, although it did not reach the twentieth storey – a result observed only for the category with 7 to 9 layers. In Figure 14c, where instances were grouped by column cross-sectional height, it was noteworthy that the intermediate category was the only one to reach the twentieth storey. Between the 16th and 19th storeys, the two tallest categories in terms of cross-sectional height showed similar upper frontiers, indicating good performance for both. However, only the instances classified within the 40 to 80 cm range reached the twentieth storey. It was also observed that up to the twelfth storey, the intermediate category was the most efficient in terms of the upper frontier. Nevertheless, from the 13th to the 17th storey, all categories demonstrated satisfactory performance.
Studies such as those by Wang, Pan and Zhang (2021) and Budak, Sucuoglu and Celik (2023) demonstrate that the stiffness provided by bracing cores in high-rise buildings has a significant influence on the structural system’s performance, particularly under wind and seismic loading. Similarly, as shown in Figure 14d, a decrease in bracing core opening (indicating increased robustness) was associated with a higher number of achievable storeys.
Figure 15a shows the DFnormal in the columns (considering wind action) as a function of the number of storeys and the number of layers in the cross-section of the columns. As already expected, as shown by the categories, as the number of layers decreased, the upper frontiers got closer to the structural limit. It was also observed that between the tenth and fourteenth storeys, the DFnormal values started to decrease considerably. It was emphasized that, as explained earlier, it was precisely on the fourteenth storey that the top displacement (Figure 14a) began to become predominant, thus concluding that serviceability criteria were more relevant than ultimate limit state criteria from this storey upwards. This same fact was observed when analysing the DFBuckling value in Figure 15b, which declined sharply from the thirteenth floor for all layer categories. Also, similar to the axial force, the DFBuckling values were higher when the number of layers was reduced in the upper frontiers of the categories, not exceeding 31%. This low DFBuckling value indicated that even when one of its members was under critical internal forces, the system as a whole remained within the safety criteria that predicted global instability.

Number of storeys <inline-formula><math display="inline" xmlns="http://www.w3.org/1998/Math/MathML"><semantics><mi mathvariant="bold">×</mi><annotation encoding="application/x-tex">\mathbf{\times}</annotation></semantics></math></inline-formula> Column DFnormal (including wind) (%) (a); Number of storeys <inline-formula><math display="inline" xmlns="http://www.w3.org/1998/Math/MathML"><semantics><mi mathvariant="bold">×</mi><annotation encoding="application/x-tex">\mathbf{\times}</annotation></semantics></math></inline-formula> DFBuckling (%) (b); categorized by number of layers
3.3 Natural frequencies of the floor system
To further investigate the relationship between the supporting beams and the natural frequency of the floor system, Figures 16a and 16b respectively display data points relating slab span (a) and girder span (b) to the system's natural frequency. A pronounced influence of the girders on the natural frequency was observed. Specifically, as the height of the girder cross-section increased, instances with higher natural frequencies emerged.

Span × Natural Frequency: categorized by the beam section height regarding the slab span (a) and the girder span (b); categorized by the strength classes of the CLT panels regarding the slab span (c) and the girder span (d)
To analyse the influence of CLT panel classification on natural frequency values, the graphs in Figures 16c and 16d were developed. Initially, it was observed that there was no significant variation in the solution space when instances were grouped by slab span (Figure 16c) according to CLT class. However, this behaviour changed when the girder span was used as the horizontal axis (Figure 16d), where more distinct patterns emerged.
Concerning the thickness of the CLT panels, it was observed in Figures 17a and 17b that the natural frequency decreased as both the thickness and the span decreased. As for the modulus of elasticity of the CLT, this parameter was strongly associated with various models used to obtain natural frequency values, such as the equations proposed by Eurocode 5 and by Huang, Gao and Chang (2020). This could be seen in the plots in Figures 17c and 17d, which represented the instances categorized by ranges of modulus of elasticity values. It was demonstrated that, throughout the entire span range studied, the instances with higher modulus of elasticity values exhibited higher natural frequency values.

Span × Natural Frequency: categorized by the thickness of the CLT panel regarding the slab span (a) and the girder span (b); categorized by the modulus of elasticity regarding the slab span (c) and the girder span (d)
3.4 Material cost estimation
Figure 18a shows the cost as a function of slab and tie-beam spans for the CLT classes. It illustrates that, within the 4–5 m range, the CLT S class stands out by offering an optimal frontier of around 125 €/m². Meanwhile, the CLT E and CLT V classes remain relatively stable, with values close to 90 €/m². Between 5 and 7 m, this trend continues, except for the CLT V class, which achieves the lowest cost values of around 130 €/m² at spans close to 7 m.

Span × Cost: categorized by class CLT (a); categorized by class tie beam (b); categorized by class girder (c); Number of storeys × Cost: categorized by class column (d)
Figure 18b presents the relationship between cost and slab and tie-beam spans for different tie-beam strength classes. For spans between 4 and 5 m, the GL24h and GL28h classes define the most favourable cost frontier, with values close to 90 €/m², whereas the GL32c class reaches the highest costs, up to approximately 150 €/m²; the GL24c and GL28c classes exhibit similar trends, converging towards lower cost values. For spans between 5 and 7 m, an increase in cost is observed for the GL32h and GL24c classes up to approximately 130 €/m², with GL24c maintaining the lowest optimal frontier.
Figure 18c presents the cost as a function of girder-beam span, indicating similar optimal frontiers close to 100 €/m² for most classes between 4.5 and 6 m, except for the GL32c class, which reaches significantly higher costs of approximately 175 €/m²; beyond this span range, the GL32h class exhibits an abrupt increase in cost, whereas the GL24h and GL28h classes display nearly identical behaviour, with the GL24c class consistently defining the most favourable optimal frontier.
Finally, Figure 18d relates cost to the number of storeys for column strength classes, in which the GL24c and GL24h classes reach the highest cost levels, up to approximately 150 €/m², while the GL32c class presents, over most of the analysed storey range, the lowest optimal cost frontier, at around 100 €/m², with only marginal differences relative to the GL32h class.
Table 4 summarises representative parameter ranges for each structural element, highlighting the governing mechanisms, the most efficient wood strength classes, and the corresponding average timber consumption and cost values.
4 Discussion
4.1 Cost and consumption timber
Firstly, the relative structural performance of each strength class, as reflected in its material consumption, is not directly linked to nominal strength alone, but rather to the interaction between the stiffness-to-weight ratio and the span length. This explains why certain timber classes maintain favourable material efficiency only within specific span ranges, while others become more competitive under different geometric configurations. The analysis therefore indicates that the choice of strength class depends not only on its mechanical properties, but on how these variables interact with the structural dimensions.
An illustrative example of this relationship is provided by the interaction between the design instances and the bracing core. Figure 9a also revealed that the timber consumption associated with column-governed categories increased as the number of storeys rose. This trend can be attributed to the intensified load transfer from the upper levels to the foundations. A similar behaviour was observed for tie-beam-governed categories, which exhibited higher timber consumption with increasing building height due to their bracing function.
In turn, the results show that systematic cost differences emerge between strength classes and structural functions, even when optimisation is driven exclusively by minimising timber consumption. Combined glulam classes, particularly GL24c (Figures 18c and 18d), are found to convert volumetric reductions into economic advantages more effectively. However, homogeneous classes of higher strength tend to incur cost increases that are only marginally offset by further reductions in consumption. Similar behaviour is observed for CLT systems (Figure 18a), where the CLT S class consistently incurs the highest costs, while the CLT E and CLT V classes remain associated with the lowest cost frontiers. This suggests that improved panel structural performance does not necessarily lead to greater economic efficiency when evaluated retrospectively.
4.2 Interpretation of Structural Performance and Governing Mechanisms
With regard to the indicators of structural performance efficiency, several aspects deserve attention. Notably, for slabs, the upper frontiers associated with rolling shear exhibited higher structural efficiency than those governed by normal bending and shear stresses. This behaviour is explained by the low span-to-thickness ratio (Figure 11), which increases the susceptibility of CLT slabs to rolling shear (Glasner et al., 2023). For girder beams (Figure 12), in contrast, the predominance of shear-governed instances across a wide span range could be attributed to the higher h/L ratio required to meet structural criteria for longer, more heavily loaded beams, as well as to the relatively low shear strength of glulam classes.
With respect to the dynamic performance of the floor system, several aspects can be highlighted. Firstly, an increase in the natural frequency of the floor system was observed with increasing girder stiffness (Figures 16a and 18b), which is consistent with the studies by Huang, Gao and Chang (2020) and Simović, Glisovic and Todorovic (2023). This increase in natural frequency can be attributed to the fact that the slabs are supported by the girders, which transmit their dynamic response to the CLT panels. In line with the trends observed in the present results (Figures 17a and 17b), when analysing some models proposed in the literature, such as the one presented by Simović, Glisovic and Todorovic (2023), it was verified that the natural frequency in timber floors was greatly affected by the span-to-thickness ratio.
From a generative design perspective, the use of genetic algorithms in this study was not intended to identify a single optimal solution, but rather to expand and explore the space of structurally feasible design alternatives. Combining parametric modelling with an evolutionary search allowed us to identify non-trivial configurations resulting from the interaction between geometric variables, strength classes, and code-based constraints. These relationships would be hard to capture using deterministic or sequential design approaches. In this sense, the genetic algorithm acted as a discovery mechanism, revealing patterns, efficient frontiers and innovative solutions within the analysed design domain.
5 Conclusions
First, the importance of the strength classes of CLT and glulam in timber consumption was observed, as well as the expected influence of span sizes, number of stories, and geometric properties. Another relevant factor for efficiency in timber consumption was the robustness of the bracing core. In general, the graphs related to the analysis of the timber consumption rate and the number of floors indicated values between 0.1 and 0.4 m³/m² at the optimal frontiers.
Regarding the design factors, it was found that girders were predominantly governed by shear stresses, and that the structural efficiency of the solution space was closely related to the self-weight of the strength classes. For elements contributing most significantly to the global stability of the structural system – namely columns, tie beams, and floor slabs – the strength properties proved more decisive. Finally, the results indicated that higher-strength timber classes tend to result in lower material consumption.
Concerning the dynamic behaviour of CLT slabs, the relevance of panel thicknesses, the height of the supporting beams, and the span sizes for determining the natural frequency values of the floors was observed. An important finding is that the normative limit of 8 Hz for the natural frequency of the floor system was not reached by the instances, indicating that the design considering static factors already encompasses dynamic serviceability.
The results indicate that transitions between strength classes are associated with marked increases in cost per area, even when timber consumption has already been optimised, with this effect being less pronounced for combined classes.
Thus, based on the exploration of the solution spaces, a set of design guidelines can be proposed for the development of optimized structural systems with characteristics similar to those adopted in this study. First, with regard to the selection of CLT panel thickness: panels with a thickness of 175 mm are recommended for slab spans between 4 and 5 meters; 190 mm panels for spans between 5 and 6 meters; and 245 mm panels for spans between 6 and 7 meters. Second, adopting a height-to-span ratio (h/l) limit of 1/17 for beams not only promotes structural efficiency but also helps mitigate the occurrence of low natural frequency values, particularly for supporting beams, as recommended by FSS (2024). In addition, the use of GL32h glulam for tie beams and columns, and GL24h or GL24c for girders, is suggested due to their favourable performance in terms of both structural efficiency and material consumption. It is also recommended to increase the number of layers in the columns as the cross-sectional height increases, with optimal column heights ranging between 40 and 80 cm. Finally, for structural systems exceeding 16 storeys, it is advisable to avoid bracing cores with aperture lengths in plan greater than 60% of the girder span, as these tend to compromise structural robustness and efficiency.
The study is based on simplified structural assumptions, such as idealised connections and an absence of explicit modelling of metal fasteners, as well as a simplified representation of the reinforced concrete core. Additionally, material costs are based on representative literature values rather than detailed market surveys. Therefore, they should be interpreted as relative indicators for design comparisons rather than as absolute cost estimates. Future studies should address these aspects by incorporating more detailed connection modelling and market-based cost data.
Acknowledgements
The authors acknowledge the support of the Brazilian National Council for Scientific and Technological Development (CNPq) and the PPGECAM programme at the Federal University of Paraíba (UFPB).
-
SOUZA, M. V. B. C. de; SILVA, F. T. da. Exploring design solution spaces for optimising timber consumption in high-rise engineered wood structures. Ambiente Construído, Porto Alegre, v. 26, e149370, jan./dez. 2026.
Data Availability Statement
The research data is only available upon request to the corresponding author.
References
- AL-QARYOUTI, Y.; BABER, K.; GATTAS, J. M. Computational design and digital fabrication of folded timber sandwich structures. Automation in Construction, v. 102, p. 27-44, 2019.
- ASSOCIAÇÃO BRASILEIRA DE NORMAS TÉCNICAS. NBR 6120: ações para o cálculo de estruturas de edificações. Rio de Janeiro, 2019.
- ASSOCIAÇÃO BRASILEIRA DE NORMAS TÉCNICAS. NBR 6123: forças devidas ao vento em edificações. Rio de Janeiro, 1988.
- ASSOCIAÇÃO BRASILEIRA DE NORMAS TÉCNICAS. NBR 7190: projeto de estruturas de madeira. Rio de Janeiro, 2022.
- BRANDT, K. et al Techno-economic analysis for manufacturing cross-laminated timber. BioResources, v. 14, n. 4, p. 7790-7804, 2019.
- BROWN, N. C.; MUELLER, C. T. Design variable analysis and generation for performance-based parametric modeling in architecture. International Journal of Architectural Computing, v. 17, n. 1, p. 36-52, 2019.
- BUCHER, M. J. J. et al Performance-based generative design for parametric modeling of engineering structures using deep conditional generative models. Automation in Construction, v. 156, p. 105128, 2023.
- BUDAK, E.; SUCUOĞLU, H.; CELIK, O. C. Response parameters that control the service, safety and collapse performances of a 253 m tall concrete core wall building in Istanbul. Bulletin of Earthquake Engineering, v. 21, n. 1, p. 375-395, 2023.
- ENGINEERED WOOD ASSOCIATION. Glued laminated beam design tables Tacoma, 2016.
- ENGINEERED WOOD ASSOCIATION. North American CLT vs. imported product: stringent standard assures value and performance. Tacoma; 2020.
- ENGINEERED WOOD ASSOCIATION. PRG 320-2017: standard for performance rated cross-laminated timber. Tacoma, 2017.
- EUROPEAN COMMITTEE FOR STANDARDIZATION. EN 14080: timber structures: glued laminated timber and glued solid timber: requirements. Brussels, 2013.
- EUROPEAN COMMITTEE FOR STANDARDIZATION. Eurocode 1: actions on structures. Brussels, 2002.
- EUROPEAN COMMITTEE FOR STANDARDIZATION. Eurocode 5: design of timber structures: part 1.1: general rules and rules for buildings. Brussels, 2004.
- FÖRENINGEN SVERIGES SKOGSINDUSTRIER. The CLT handbook: CLT structures, facts. Stockholm: Swedish Wood, 2019.
- FÖRENINGEN SVERIGES SKOGSINDUSTRIER. The Glulam handbook Stockholm: Swedish Wood, 2024.
- GLASNER, D. et al. Rolling shear strength of Cross Laminated Timber (CLT): testing, evaluation, and design. Buildings, v. 13, p. 2831, 2023.
- HENS, I.; SOLNOSKY, R.; BROWN, N. C. Design space exploration for comparing embodied carbon in tall timber structural systems. Energy and Buildings, v. 244, p. 110983, 2021.
- HUANG, H.; GAO, Y.; CHANG, W.-S. Human-induced vibration of cross-laminated timber (CLT) floor under different boundary conditions. Engineering Structures, v. 204, p. 110016, 2020.
- LEONE, C. Parametric modelling: design of twisted towers and solar screens for the analysis of natural lighting and solar radiation in a commercial building in the city of São Paulo São Paulo, 2017. Master’s thesis (Mestrado em Arquitetura) — Mackenzie Presbyterian University, São Paulo, 2017.
- LIU, M. et al. Economic ripple effects analysis of cross-laminated timber manufacturing in Japan. Forests, v. 14, n. 3, p. 492, 2023.
- MASSONE, M.; GABRIELLI, F.; RINEISKI, A. SIMMER extension for multigroup energy structure search using genetic algorithm with different fitness functions. Nuclear engineering and technology, v. 49, n. 6, p. 1250-1258, 2017.
- OLIVEIRA, G. L. Engineered timber structures: architectural design oriented towards construction process rationalization. São Paulo, 2023. Tese (Doutorado em Arquitetura) – Faculdade de Arquitetura, Universidade de São Paulo, São Paulo, 2023.
- SHIGUE, E. K. The diffusion of timber construction in Brazil: agents, actions, and products São Carlos, 2018. Dissertação (Mestrado em Arquitetura) – Instituto de Arquitetura e Urbanismo, Universidade de São Paulo, São Carlos, 2018.
- SILVA, F. T. da; PIMENTEL, R. L. Optimization of steel portal frames under a parametric structural design framework. Practice Periodical on Structural Design and Construction, v. 28, n. 1, p. 04022059, 2023.
- SIMOVIĆ, N.; GLIŠOVIĆ, I.; TODOROVIĆ, M. Design of cross-laminated timber (CLT) floors for human-induced vibrations. Building Materials and Structures, v. 66, 2023.
- STUMPF, J. et al Systems design using solution-compensation spaces with built-in tolerance applied to powertrain integration. Proceedings of the Design Society, v. 2, p. 1995-2004, 2022.
- WANG, B.; LU, W.; ZHANG, Y. A graph-enabled parametric modeling approach for façade layout generative design. Journal of Building Engineering, v. 105, p. 112481, 2025.
- WANG, Q. et al Mechanical properties and probabilistic models of wood and engineered wood products: A review of green construction materials. Case Studies in Construction Materials, v. 21, p. e03796, 2024.
- WANG, Z.; PAN, W.; ZHANG, Y. Parametric study on module wall-core system of concrete modular high-rises considering the influence of vertical inter-module connections. Engineering Structures, v. 241, p. 112436, 2021.
-
WOODWORKS INNOVATION NETWORK. The woodworks innovation network: projects. 2024. Available: https://www.woodworksinnovationnetwork.org/projects Access: 15 abr. 2024.
» https://www.woodworksinnovationnetwork.org/projects - ZHANG, Z.; LAN, K. Understanding the impacts of plant capacities and uncertainties on the techno-economic analysis of cross-laminated timber production in the southern US. Journal of Renewable Materials, v. 10, n. 1, p. 53, 2022.
- ZOVKIĆ, J.; DOLAČEK-ALDUK, Z.; GULJAŠ, I. Correlation between the load-bearing capacity, fire resistance, and the price of glued laminated timber. Fire, v. 8, n. 4, p. 123, 2025.
Edited by
-
Editores-chefes:
Marcelo Henrique Farias de Medeiros e Julio Molina