
 Water use analysis in mixed-use buildings in Brasília, Brazil
Abstract
The main objective of this study was to characterize water use for mixed-use buildings in Brasília, Brazil, based on their typological and functional characteristics. The invoiced monthly building water consumption between 2013 and 2019 was analysed in 181 commercial establishments, 211 offices, and 259 studio flats. End-use water audit with specific end-use metering were also performed in 7 commercial establishments, 3 offices, and 6 studio flats. Toilet flushing had the highest rate of consumption in both offices (57%) and studio flats (30%), although kitchen sinks accounted for the largest portion of the total water consumption in the building (38%). The restaurant was the activity that consumed the most water in the building (34%), followed by the studio flats (29%). A broad heterogeneity in consumption was observed among the evaluated establishments, influenced by the occupied area, number of employees, customer flow, and the degree of water dependency in the end-activities. The generated indicators provide subsidies for the dimensioning of building systems and assist in reflections on water consumption in mixed-use buildings, contributing to improve the prediction of urban water demand in the Federal District.
Keywords
Plumbing systems; Water consumption; Water end-uses; Water audit; Mixed-use buildings
Resumo
O principal objetivo deste estudo foi caracterizar o uso de água em edificações de uso misto em Brasília, Brasil, com base em suas características tipológicas e funcionais. Foram analisados os consumos mensais de água faturados no período de 2013 a 2019 em 181 estabelecimentos comerciais, 211 escritórios e 259 quitinetes. Também foram realizadas auditorias de uso final da água, com medições específicas por uso final, em 7 estabelecimentos comerciais, 3 escritórios e 6 quitinetes. As descargas sanitárias apresentaram as maiores taxas de consumo tanto nos escritórios (57%) quanto nas quitinetes (30%), embora as pias de cozinha tenham representado a maior parcela do consumo total de água do edifício (38%). O restaurante foi a atividade que mais consumiu água no edifício (34%), seguido pelas quitinetes (29%). Observou-se ampla heterogeneidade no consumo entre os estabelecimentos avaliados, influenciada pela área ocupada, número de funcionários, fluxo de clientes e grau de dependência de água nas atividades-fim. Os indicadores gerados fornecem subsídios para o dimensionamento de sistemas prediais e contribuem para a reflexão sobre o consumo de água em edificações de uso misto, auxiliando no aprimoramento da previsão da demanda urbana de água no Distrito Federal.
Palavras-chave
Instalações hidráulicas prediais; Consumo de água; Usos-finais de água; Auditoria do consumo de água; Edificações de uso misto
1 Introduction
Projections from the United Nations World Water Development Report indicate that global demand for water could grow by around 55% by 2050, driven by population growth, economic expansion and increased use in agriculture and industry. If current patterns of consumption, management and distribution are maintained, it is estimated that the world will face a supply deficit of approximately 40% by 2030 (UN, 2015). In this context, understanding water consumption patterns is essential to guide conservation measures and to establish water management programmes capable of reducing pressure on supply systems (Deoreo; Heaney; Mayer, 1996; Marinoski et al., 2014).
International studies on water use have been conducted mainly in single-family residential buildings, with important contributions in Australia (Beal; Makki; Stewart, 2014; Cook; Sharma; Chong, 2013; Makki et al., 2013, 2015; Talebpour et al., 2014; Willis et al., 2009, 2010, 2011, 2013) and other more specific studies in Germany, Italy, Sweden and the United Kingdom (Richter; Stamminger, 2012), Portugal (Lúcio; Silva; Sousa, 2019; Matos et al., 2013), India (Ramsey; Berglund; Goyal, 2017; Singh; Turkiya, 2013), the United Arab Emirates (Chowdhury et al., 2015), Iraq (Hussien; Memon; Savic, 2016), China (Jiang et al., 2016), Uganda (Muniina; Maksimovic; Graham, 2017), Libya (Alharsha; Memon; Farmani, 2019) and Sri Lanka (Sivakumaran; Aramaki, 2010). Of these, only Hussien, Memon and Savic (2016) and Alharsha, Memon and Farmani (2019) also assessed water consumption in apartments, in addition to single-family houses, but only through questionnaires. Apart from the Australian studies, none of these investigations used high-resolution instrumented monitoring, such as data loggers, to obtain data on water end-uses.
Regarding commercial buildings, international studies investigating water consumption in offices, such as those conducted in New Zealand in 93 buildings (Bint; Vale; Isaacs, 2014) and in Australia (Cook; Sharma; Gurung, 2014) remain limited. There is still no consensus on methodologies for data collection, processing and analysis, with a predominance of questionnaires and reliance on whole-building consumption data.
Studies on water use in commercial establishments have focused mainly on restaurants and supermarkets across USA (Dziegielewski et al., 2000). On large retail buildings in California, Gleick et al. (2003) applied flow-tracking analysis to estimate end uses by type of establishment, enabling the categorisation of consumption into specific uses.
Limitations in the international literature on mixed-use developments are also well documented. A systematic mapping conducted by Boeger (2022) identified a single relevant case study by Jordán-Cuebas et al. (2018). Although this study employed high-resolution metering to identify end uses, its scope was restricted to upper-floor residential units, leaving the functional interface between different building uses largely unexplored.
In Brazil, most research has likewise focused on residential buildings, with a balance between studies in single-family dwellings (Marinoski et al., 2014; Marinoski; Rupp; Ghisi, 2018; Sant’ana; Mazzega, 2018; Hammes; Ghisi; Thives, 2020) and apartments (Ghisi; Ferreira, 2007; Maykot; Ghisi, 2020; Sant’ana; Mazzega, 2018). Nevertheless, gaps remain for specific typologies, such as studio apartments (Bonfim; Sant’ana, 2021), as well as for other regions of the country, since most studies are concentrated in the state of Santa Catarina and the Federal District. Methodologically, there is broad agreement on the use of combined approaches, including general water consumption measurements, questionnaires, consumption diaries and researcher observations of consumption habits, to estimate consumption indicators and water end-uses.
Studies on offices have been conducted in Santa Catarina (Proença; Ghisi, 2010) and Brasília (Sant’ana et al., 2019), as well as in two public buildings on the UFPA campus in Pará (Campos Cardoso; Cavalcante Blanco; Duarte, 2020). In commercial establishments, investigations have addressed bakeries in the São Paulo Metropolitan Region (Gomez; Alves, 2000), a shopping centre in Rio de Janeiro (Nunes, 2006), fast food restaurants in São Paulo (Lima et al., 2016), and cafés in Brasília (Totugui et al., 2019).
Overall, the literature highlights a lack of detailed end-use data for commercial and mixed-use typologies, limiting the understanding of relationships between water consumption, building characteristics, occupancy patterns and functional uses. In addition, several authors report limitations in the accuracy of commonly used methods, particularly for estimating end uses.
In the Federal District of Brazil, approximately 83.84% of water consumption occurs in the residential sector and 9.47% in the commercial sector. The Plano Piloto Administrative Region presents the highest total water consumption in the Federal District (25 million m³/yr) and concentrates the highest commercial (5.5 million m³/yr) and public (4.5 million m³/yr) demands. It also ranks among the five regions with the highest residential per capita consumption, at approximately 180 L/p/d (CPDF, 2021). This context reinforces the relevance of investigating water-use patterns in urban typologies that combine residential and commercial functions, such as the mixed-use buildings of Comércio Local Norte (CLN), located in the Plano Piloto Administrative Region in Brasília, Brazil.
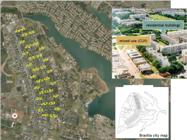
The selection of CLN is further justified by its distinctive urban configuration. The Plano Piloto, designed by Lúcio Costa, integrated commerce and housing at the local scale by locating commercial facilities adjacent to each superblock (Costa, 1957), typically composed of four or five buildings along collector roads (Figure 1). In Asa Norte, CLN buildings are characterised by commercial uses on the ground and basement floors and offices or studio flats on the upper floors. This typology, present in more than 200 buildings, has also been replicated in newer developments in the Federal District, such as Sudoeste and Noroeste, and represents a defining element of Brasília’s urban fabric.
A detailed understanding of water consumption in these buildings is essential for proper system sizing, evaluation of water-efficiency programmes, demand forecasting and integrated water resource management. It also supports the formulation of public policies aimed at urban sustainability (Santana; Sant’Ana, 2021).
2 Method
To achieve the objective of the study, the research was developed in two main stages. Section 2.1 presents the methods adopted for the typological and functional characterisation of CLN mixed-use buildings, based on documentary analysis, on-site technical surveys and consultations with institutional representatives responsible for the operation of residential, commercial or common areas. Section 2.2 describes the water consumption analysis, carried out through two complementary approaches:
-
an urban-scale assessment based on historical water consumption data; and
-
a building-scale investigation focused on the characterisation of water end-uses using water auditing techniques.
2.1 Typological and functional characterisation
As a starting point, a comparative documentary analysis of urban projects and standards published by the Federal District Government since the 1960s was carried out, followed by a qualitative and quantitative survey of 260 mixed-use buildings distributed across 58 blocks of the CLN (marked in yellow in Figure 1). The survey collected information on construction period, built area, number of floors, and the distribution of commercial, office and studio flat uses.
Local planning regulations in Brasília are highly prescriptive. As a result, floor areas are not approximate design values but are legally established and largely standardised across buildings of this typology. These buildings typically have square floor plans (26 m × 26 m), full lot coverage (100%), and a total height of 9 m, with a total built area of 2,563 m², distributed among the basement (784 m²), ground floor (676 m²), mezzanine (400 m²), and first floor (676 m²).
Due to regulatory changes over time, different building configurations coexist in the CLN. However, the analysis focuses on the current and most prevalent building type, which represents approximately 77% of the surveyed stock and is illustrated in Figure 2, consisting of a representative building-type configuration, with offices on the mezzanine floor, studio flats on the first floor, and commercial establishments on the ground floor.

To complement the characterisation, georeferenced data from GeoPortal (SEDUH, 2025) and Google Maps (Google Maps, 2025), including Street View, were combined with on-site technical surveys and consultations with institutional informants responsible for residential, commercial and common areas. These procedures enabled the identification of activity types and the estimation of fixed populations (employees and residents) and floating populations (customers), based on operational and occupancy information at the building level.
Commercial activities were classified according to categories established by the Federal District Trade Federation for Goods, Services and Tourism (FCBSTDF, 2016), which organises the sector into two main groups:
-
retail; and
-
services.
To further disaggregate activities within each group, classifications from IBGE (2015, 2025) were also adopted. Although originally designed to describe economic activities, these classifications were adapted for the purposes of water-consumption analysis. The integration of both references resulted in the activity classification presented in Table 1.
2.2 Analysis of water consumption and end-uses
The first stage of the analysis was conducted at the urban scale, based on historical records of monthly billed water consumption between 2013 and 2019, provided by the local water utility. The final sample comprised 181 commercial establishments, 211 offices and 259 studio flats with individual water metering, as well as 84 buildings with collective metering on the upper floors.
Only units presenting complete and consistent consumption records over the analysed period were retained. Units with missing, inconsistent or unreliable data were excluded prior to the definition of the final sample, including cases of incomplete billing series, inconsistencies identified in the utility company’s records, or insufficient technical-operational information to allow adequate characterisation of the unit, such as aggregated occupancy data or information on the type of activity carried out.
By cross-referencing billed consumption data, built area, and information on occupancy and operational characteristics of the units, as previously described in Section 2.1, per capita water consumption indicators (litres per person per day, L/p/d) and area-based indicators (litres per square metre per day, L/m²/d) were calculated. Subsequently, the results were grouped by type of activity, allowing the derivation of representative average values for each indicator. This approach supported the characterisation of mixed-use CLN buildings in Asa Norte, as well as the characterisation of establishments by activity within these buildings.
In the characterisation of establishments by activity, in addition to per capita and area-based indicators, specific water consumption indicators associated with the core activities of certain types of commerce and services were defined to capture their operational particularities. This approach is consistent with previous studies that have analysed water consumption across different commercial and service typologies (Barthichoto et al., 2013; Beal; Santos, 2011; Dziegielewski et al., 1993, 2000; Lima et al., 2016; Miller; Miller, 1983; PMC, 1995). For this purpose, average daily operational variables directly or indirectly related to water consumption were considered, including the number of customers served in food establishments, the number of meals served in restaurants, and the number of hair washes performed in beauty salons.
The second stage of the analysis consisted of a building-scale case study, aimed at characterising water end-uses and deepening the understanding of consumption patterns within a mixed-use building. Water consumption audits were carried out in a total of sixteen units, comprising seven commercial establishments, three office units and six studio flats, following prior authorisation by the respective building administrators or institutional representatives.
The audits consisted of the installation of measurement devices at all end-uses within each unit, using flow meters coupled with data logger modules, as illustrated in Figure 3.
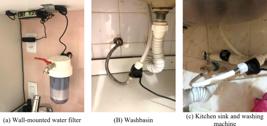
Continuous monitoring was carried out for periods ranging from 7 to 20 days, enabling the recording of water volumes associated with different end-uses, such as taps, showers, bidet sprays, toilet flushes, washing machines, dishwashers, wall-mounted drinking water filters and hair-washing basins. From these measurements, data on flow rate, duration and frequency of use of each device were obtained, allowing the estimation of consumption and the derivation of specific end-use indicators. During each monitoring campaign, all water-consuming devices present in the audited unit were monitored simultaneously, ensuring consistency between the recorded volumes and a single operational period. The water audits were conducted between May and October, corresponding mostly to the dry season (austral winter) in the Federal District.
In addition to the data collected through the consumption audits, building administrators or institutional representatives responsible for each commercial establishment, office and residential unit provided information on monthly billed water consumption, average daily occupancy of the fixed population (comprising employees and residents), estimated floating population in the case of food stores, and specific operational variables, such as the average daily number of meals served in restaurants and the average daily number of hair washes in beauty salons. These data were used exclusively for the operational characterisation of the analysed units and for the construction of end-use water consumption indicators.
Based on the combination of volumes measured for each hydraulic fixture and the associated variables, the following end-use water consumption indicators were generated: litres per person per day (l/p/d); litres per customer per day (l/cust/d), applicable to food stores; litres per meal served per day (l/meal/d), applicable to restaurants; and litres per hair wash per day (l/wash/d), applicable to beauty salons.
The estimated average daily consumption (litres per day, l/d), obtained from sensor measurements for each end-use, was aggregated to obtain the total consumption of each unit. End-use consumption for the analysed mixed-use building was then estimated by summing the consumption of the monitored studio flats, offices and commercial establishments that comprise the building. This procedure enabled the estimation of total end-use consumption for each hydro-sanitary fixture within the building.
Subsequently, the estimated total average daily consumption was compared with the average daily consumption derived from the aggregation of monthly billed consumption data from all analysed units within the building. This comparison resulted in the relative discrepancy between billed and estimated average consumption, as defined in Equation 1. A correction factor was then calculated as the ratio between the billed average daily consumption and the estimated average daily end-use consumption (Equation 2). This factor was applied to both the estimated end-use demands and the derived indicators, adjusting them to the observed consumption levels and enabling the derivation of baseline end-use water demands and indicators for the analysed mixed-use building (Equations 3 and 4).
Where:
is the relative discrepancy;
is the estimated average daily water consumption (l/d); and
is the billed average daily water consumption (l/d).
Where:
is the water consumption correction factor;
is the billed average daily water consumption (l/d); and
is the estimated average daily water consumption (l/d).
Where:
is the baseline water demand (l/d);
is the water consumption correction factor; and
is the estimated average daily water consumption (l/d).
Where:
is the baseline water consumption indicator;
is the estimated water consumption indicator; and
is the water consumption correction factor.
Throughout the methodological procedures, water consumption was analysed, acknowledging the inherent variability associated with commercial activities and mixed-use buildings. For this reason, the analytical framework was structured around activity-based grouping and end-use disaggregation, allowing quantitative indicators to be derived from measured operational conditions at both unit and building scales. The generation of per capita, area-based, and end-use-specific indicators aimed to capture consumption patterns linked to the functional characteristics of each activity, rather than to establish uniform or generalised values. Data treatment focused on descriptive statistical analysis to support the interpretation of heterogeneous datasets and the construction of baseline water demand and consumption indicators representative of the analysed case study. Comparisons with values reported in previous studies were employed solely to contextualise the results within the existing literature for similar activity types.
3 Results and discussions
3.1 Typological and functional characterisation
The results highlight the functional diversity of mixed-use buildings in the CLN, despite their typological standardisation due to strict urban planning regulations common in the listed perimeter. This diversity reflects the coexistence of residential, commercial, and service activities, with direct implications for water consumption patterns.
Upper floors were predominantly occupied by commercial premises and studio flats. Commercial spaces were mainly offices (60%), but also included beauty services (12%), education (8%), health (8%), retail (8%), and maintenance or repairs (4%). The ground floor and basement had a balanced distribution between commercial activities (45%) and services (55%).
The typical composition comprised beauty salons (27%), clothing stores (20%), restaurants (11%), drugstores (10%), food stores (7%), other retail (7%), and other services (7%). The remaining 11% included bakeries (4%), bars (2%), gyms (2%), vehicle stores (1%), building material stores (1%), snack bars or cafés (1%), pet shops (1%), and laundries (1%). Table 2 summarises these characteristics, providing an overview of the main activities in CLN mixed-use buildings.
On average, commercial establishments recorded the highest monthly consumption per store (12.4 m³), surpassing offices (4.8 m³) and studio flats (4.4 m³). This higher volume is related to the larger average built area (87.8 m²), larger populations (fixed and floating), and the presence of activities with high water demand, such as restaurants, food stores, beauty salons, and drugstores.
In addition to higher absolute consumption, commercial establishments exhibited considerable heterogeneity. Food-related activities tend to intensify water use, whereas other sectors, such as clothing stores and other retail and service activities, demand volumes close to the utility's minimum monthly billing. In studio flats, the average fixed population of one person and the absence of a floating population explain the higher per capita indicator. Despite lower absolute consumption, all water use in these units is carried out by a single individual.
These contrasts demonstrate that analysis by broad use categories (commercial, residential, offices) can mask specific patterns. This reinforces the need for detailed segmentation to better understand consumption in commercial settings, guiding water efficiency measures and the sizing of building systems. Table 3 presents water consumption indicators by commercial activity. The wide range between minimum and maximum values reflects the operational heterogeneity of establishments within the same activity category.
Characteristics and water consumption indicators of commercial establishments by activity in the CLN
By comparing the two commercial categories, it was observed that daily water consumption in service establishments was, on average, higher than in commercial establishments, with restaurants and beauty salons standing out. Restaurants and beauty salons recorded the highest indicators per area (7.4 and 6.6 l/m²/d, respectively). This pattern is directly related to the nature of the activities, which involve food preparation or constant cleaning. Retail activities, such as clothing stores (2.3 l/m²/d) and other retail (2.2 l/m²/d), reflected operational processes that are less dependent on water. The exception was drugstores, which exhibited high per capita water consumption (103.9 l/p/d) and per area consumption (5.2 l/m²/d), possibly due to their high occupancy rates (24 hours a day, 7 days a week).
Table 4 presents a comparison between the water consumption indicators obtained for CLN mixed-use building and values reported in previous national and international studies for selected commercial and service activities. Reported values reflect differences in operational characteristics, adopted metrics, sampling strategies, types of activities performed, and local contextual conditions, including regional, cultural, and behavioural practices that directly influence water use.
Comparison of water consumption indicators in commercial establishments between literature data and the CLN case study
For food stores, area-based water consumption observed in CLN buildings exceeded the ranges reported by Dziegielewski et al. (2000), highlighting the influence of operational and spatial characteristics not fully captured by generic building indicators. Food stores in CLN commonly combine retail with on-site handling of fresh products, internal cleaning routines, and auxiliary services, which tend to increase water demand compared to establishments focused on dry goods or supported by centralised supply chains. Differences in store size, integration within mixed-use buildings, opening hours, and operational intensity further contribute to higher water consumption per unit area.
Restaurants exhibited substantial variability across studies, both in magnitude and in the indicators adopted. International studies have reported consumption using different reference variables, such as employees, seats, customers, floor area, or meals served, while Brazilian studies have predominantly adopted “meals served”, which aligns more closely with local operational practices. Although the indicator expressed in litres per meal per day showed consistency with values reported in the literature, direct comparability remains limited due to the heterogeneous nature of the category “restaurants”, which encompasses establishments with distinct service formats, operational routines, and production processes.
Differences in service type, meal composition, culinary specialisation, establishment size, number of employees, physical layout, sampling strategies, climate, and cultural cleaning practices are key factors influencing variability in restaurant water consumption. Dziegielewski et al. (2000), for example, reported the highest daily water consumption in Chinese restaurants (approximately 58,595 l/d) and the lowest in fast food restaurants (around 15,425 l/d). This contrast was attributed to operational practices, such as the continuous use of running water for washing hot pots in Chinese restaurants, whereas fast food establishments often rely on pre-prepared ingredients and simplified food preparation processes, resulting in lower water demand. These findings reinforce that restaurant water consumption is primarily driven by end-use practices and operational logic rather than solely by scale or occupancy, highlighting the importance of indicators that reflect dominant water-use activities.
Regarding beauty salons, Miller and Miller (1983) reported building-level water consumption indicators expressed per chair per day, representing an important early reference for this type of establishment. Although conducted in the early 1980s, the study remains relevant as a foundational characterisation of water use in service activities, despite subsequent changes in technologies and service profiles. However, such indicators do not capture differences in operational routines, service profiles, or activity composition.
In the Brazilian context, beauty salons typically present a limited number of chairs, moderate customer turnover, and a wide range of services, many of which do not involve direct water use. As a result, indicators based solely on the number of chairs may not adequately represent consumption dynamics. Water consumption was therefore analysed based on operational variables observed in the establishments, allowing it to be associated with the services effectively performed, the fixed population, and the floor area. This approach contributes to the discussion on the adequacy of indicators for service activities and reinforces the need to align consumption metrics with local operational practices rather than exclusively with static building parameters.
The literature review indicates a limited number of studies presenting detailed water consumption indicators for different types of commercial and service establishments. This gap reinforces the need to expand research on non-residential water use to improve understanding of urban water demand and to support more accurate water management strategies and public policies, particularly through the development of locally adjusted indicators.
3.2 Analysis of water consumption and end-uses
The mixed-use building analysed, selected as a building-scale case study for water consumption and end-use analysis, has a fixed population of 162 people, distributed across 19 studio flats (19 p/d), 7 offices (35 p/d), one food store (50 p/d), two clothing stores (6 p/d), one drugstore (12 p/d), one restaurant (12 p/d), two beauty salons (24 p/d), other retail (3 p/d), and other services (1 p/d). These values were obtained from on-site audits conducted in the selected units, as described in Section 2.2.
Estimated water consumption for the building was 287.06 m³ per month (9,568.80 l/d), while billed consumption reported by the water utility was 305.48 m³ per month (10,043.06 l/d), corresponding to a relative discrepancy of −5%.
Previous studies relying on surveys, diaries, and indirect estimation methods commonly report larger acceptable discrepancies between estimated and measured consumption. For example, Marinoski, Rupp, and Ghisi (2018) adopted a tolerance range of ±25%, obtaining differences from −16% to +20% between estimated end-use consumption and utility-measured values, while Sant’Ana and Mazzega (2018) adopted a tolerance range of ±20%. Discrepancies are inherent to indirect approaches and can be influenced by sample size, diversity of water uses, and occupant behaviour. In this context, the discrepancy observed in the present study indicates a high level of agreement between sensor-based end-use estimates and billed consumption, supporting the robustness of the proposed methodology for estimating end-use water consumption in mixed-use buildings.
Results in Table 5 suggests that the highest water consumption rates were in kitchen sinks (38%), followed by toilet flushes (18%), showers (12%), washbasins (10%), and dishwashers (8%). The highest demand was observed in activities related to food preparation and trade, mainly consisting of kitchen sinks and dishwashers. These activities, associated with the restaurant and food store, had estimated consumptions of 3,288.98 l/d and 1,676.75 l/d, respectively, accounting for more than 50% of the building's total consumption.
Washbasins accounted for a high percentage of building consumption, reaching values close to those of showers. This result is mainly due to the two beauty salons, which together totalled 554 l/d (277 l/d each), where some washbasins were used for hair procedures, chemical preparation, and cleaning of utensils, increasing both frequency and duration of use.
Regarding showers, although they consume more water per use, the total daily volume was similar to that of washbasins. Studio flats accounted for the largest share, with 802.9 l/d, followed by the restaurant with 372.2 l/d. In the two clothing stores, usage was minimal (0.6 l/d) and, as reported by users, intended exclusively for cleaning the environment rather than bathing. A similar situation was observed in offices, where occasional use of the hygienic shower was associated with specific cleaning activities rather than personal hygiene.
To characterise the relationship between activities and water consumption, specific average operational variables were adopted: 500 customers per day in the food store, 300 meals per day in the restaurant, and 18 hair washes per day in each beauty salon. Comparison of these variables with the respective volumes measured in each end-use allowed calculation of the specific indicators presented in Table 6, expressed as litres per customer per day (l/cust/d) for the food store, litres per meal per day (l/meal/d) for the restaurant, and litres per wash per day (l/wash/d) for the beauty salon. These parameters enabled interpretation of daily operations and understanding of consumption patterns associated with each end-use.
Table 6 presents a summary of end-use water results by activity in CLN mixed-use buildings. “Other” uses refer to occasional leaks detected during measurements or to specific fixtures with insignificant consumption.
The nineteen studio flats together account for 26.2% of the building’s total water consumption. In this typology, water use is predominantly associated with sanitation and personal hygiene, with toilet flushing (30%) and showers (28.6%) representing the largest shares, followed by washing machines (13.7%), which require substantial volumes per cycle. The absence of appliances such as dishwashers results in a consumption profile consistent with single-occupancy studio flats, where meal preparation and dishwashing are limited, leading to low water use at kitchen sinks (17.4 l/d). The relatively high per capita consumption is primarily driven by the low occupancy rate of these units, which inflates individual indicators and highlights the sensitivity of residential water consumption metrics to occupancy structure in compact mixed-use typologies in the Federal District.
The seven offices account for 10.8% of the building’s total water consumption and exhibit relatively low daily demand (70.2 l/d), particularly when compared with the average daily consumption of the analysed commercial establishments (818.8 l/d) and studio flats (147.9 l/d). Water use is mainly concentrated in toilet flushing (57.4%) and washbasins (17.2%), reflecting the limited reliance on water typical of office activities. The absence of full kitchens, with water use restricted to occasional pantry sink activities such as basic utensil washing, further contributes to this consumption pattern. The indicators obtained highlight the small scale and low operational intensity of these units, reinforcing the need to consider size, occupancy, and functional use when interpreting water consumption in mixed-use CLN buildings.
The nine commercial establishments account for 63% of the building’s total water consumption, with retail and service activities contributing 25% (36.17 l/p/d) and 38% (105.11 l/p/d), respectively, resulting in an average per capita demand of 59.79 l/p/d. Despite the smaller number of service establishments, their cumulative consumption is markedly higher, indicating that activity type is a more influential determinant of water demand than the number of units, floor area, or workforce size. Water use in service establishments—particularly restaurants and beauty salons—is dominated by operational, water-intensive end uses such as kitchen sinks, dishwashers, and hair washing. In contrast, retail activities exhibit lower consumption, largely associated with sanitary uses and cleaning. Food stores represent an exception within the retail category, showing higher demand due to the frequent use of kitchen sinks for handling and washing fresh products. Overall, the results demonstrate that end-use composition, rather than occupancy, is the primary driver of water demand in commercial units.
It is important to note that the consumption attributed to the washing machine (61.2 l/d) in the restaurant was lower than the minimum volume expected for a typical washing machine cycle. This result reflects the sporadic and uneven use observed in this establishment, where the machine is operated only occasionally. Consequently, when calculating the daily average over the total monitored period, the estimated consumption was substantially reduced due to the low frequency of operation. Tables 7 and 8 compare water consumption indicators and end-use shares obtained in the CLN case study with values reported in the literature for residential and office buildings.
Comparison of water consumption indicators and end-use shares in residential buildings between literature data and the CLN case study
Comparison of water consumption indicators and end-use shares in office buildings between literature data and the CLN case study
For the studio flats, the average per capita consumption (147.92 l/p/d) is consistent with values reported for residential typologies in previous studies, including Marinoski et al. (2014) and Marinoski, Rupp, and Ghisi (2018) in Santa Catarina, and Sant’Ana and Mazzega (2018) in the Federal District, which focused on low- and lower-middle-income households. However, the value is closer to that reported by Creder (2006) for single-family residences (150 l/p/d) than for apartments (200 l/p/d). This similarity with lower-income ranges is observed despite the higher average household income in the present sample, ranging between five and ten minimum wages – a profile consistent with the income levels reported for Asa Norte residents by Companhia de Planejamento do Distrito Federal (2019). These findings demonstrate that water consumption in studio flats remains underexplored, given its distinctive characteristics compared with other residential typologies.
For offices within the CLN mixed-use building, the average per capita consumption (31.6 L/p/d) is lower than the range reported by Proença and Ghisi (2010) (34.9–101.6 L/p/d), but higher than the values observed by Campos Cardoso, Cavalcante Blanco and Duarte (2020). Toilet flushing was the main end use (57.4%), consistent with Proença and Ghisi (2010), who reported shares between 52% and 84.6%. In contrast, Bint, Vale and Isaacs (2014) found a lower proportion (25.6%), due to the significant contribution of water-cooled HVAC systems (25% of total consumption). Washbasin use (17.8%) is consistent with both Proença and Ghisi (2010) and the average reported by Bint, Vale and Isaacs (2014).
Overall, office water consumption is characterised by low per capita demand and a limited set of end-uses, with toilet flushing consistently representing the main component, as widely reported in the literature. The observed end-use composition aligns with previous studies, indicating that water demand in office environments is predominantly driven by basic sanitary needs. Variations in consumption levels could be associated with differences in building scale and functional use.
Table 9 presents a comparison of water end-use indicators per fixture and appliance in commercial establishments, allowing the CLN results to be contextualized against existing empirical evidence.
Comparison of water end-use indicators in commercial establishments between literature data and the CLN case study
Dziegielewski et al. (2000), when analysing restaurants in Irvine, Phoenix, and Santa Monica (USA), identified the highest water demands in faucets, followed by dishwashers. Comparison between studies indicates structural consistency in restaurant water-use patterns, with the predominance of kitchen-related end uses over sanitary uses, despite differences in absolute values resulting from scale, service volume, and operational practices.
For food stores, Dziegielewski et al. (2000) did not provide a detailed disaggregation of end uses, except for toilet flushing, which limits direct comparison. In addition, the establishments analysed in the present study operate at a significantly smaller scale. These findings highlight the scarcity of studies offering detailed end-use breakdowns across different commercial typologies, thereby constraining the development of robust, activity-specific, and comparable water-use indicators.
Dziegielewski et al. (2000) reported both billed and measured water consumption, allowing calculation of relative discrepancies for the analysed restaurants, which ranged from 0.30% to 2.29%. For the supermarkets assessed in their study, billed consumption data were not available, preventing evaluation of discrepancies between measured and billed values. Among the studies reviewed, only Totugui et al. (2019), who characterised water end uses and established consumption indicators for a café in Brasília, explicitly reported the discrepancy between measured and billed consumption, which reached 11%.
Figure 4 shows the percentage consumption of each activity in the building. The restaurant had the highest water consumption (3,289 l/d), followed by the combined consumption of the 19 studio flats (2,810.40 l/d), with each unit consuming 147.9 l/d. In third place was the food store, with a consumption of 1,676.8 l/d. The two beauty salons totalled 966 l/d, while the seven offices recorded a total of 491.36 l/d. The remaining activities – clothing stores, drugstore, other retail, and other services – each contributed less than 2% of the building's total water consumption.

Water consumption data for commercial and service typologies exhibit high variability, as they are strongly influenced by operational practices, usage patterns, and functional characteristics that are difficult to standardise. In the mixed-use buildings analysed, this heterogeneity is reflected in the indicators obtained, which should therefore be interpreted as representative of the studied sample. Nevertheless, disaggregation by activity type and end use proved essential for identifying key drivers of consumption and for establishing robust references within the specific urban context of the Federal District.
The results reinforce the direct influence of activity type on water-use intensity and highlight the need for detailed end-use analyses across different commercial activities and building typologies. Furthermore, significant variations in consumption profiles were observed between units due to differences in floor area, occupancy, and function. Given the dynamic occupancy patterns typical of mixed-use buildings, the adoption of critical demand scenarios in system design is recommended, ensuring operational flexibility and minimising the need for future system adaptations.
4 Conclusions
Water consumption at the building scale and by end use in mixed-use buildings in Comércio Local Norte (CLN), Brasília, Brazil, was characterised, focusing on the predominant and normatively standardised building configuration in the sector. On average, the typical building includes nine commercial establishments on the ground and basement levels, seven offices on the mezzanine, and nineteen studio flats on the first floor.
Commercial establishments accounted for the highest absolute consumption volumes, while studio flats presented the highest per capita indicators, due to continuous occupancy and the types of water-consuming activities performed. Offices, although less intensive, exhibited patterns consistent with previous studies, with consumption predominantly in toilet flushes and lower per capita indicators than activities with greater water dependence. Restaurants, food stores, and beauty salons recorded the highest indicators per area, reflecting processes requiring intensive water use. Comparisons with Brazilian and international studies confirmed that the main determinant of consumption is the type of activity performed, rather than built area or number of users.
At the building scale, toilet flushes are the fixtures consuming the most water in both studio flats (30%) and offices (57%), whereas across the building, kitchen sinks predominate (38%), reflecting the presence of food-related establishments. These patterns reflect the functional heterogeneity of this building type, influenced by occupied area, number of employees, customer flow, and degree of dependence on water in core activities.
Mixed-use buildings exhibit high consumption variability due to operational diversity and the presence of a floating population. Water consumption in commercial activities varies substantially both between commerce and services and within activity classifications. The primary determinant of these differences is activity type, as functions have distinct and unequal water demands. In addition, the limited literature on commercial end uses reinforces the need for more detailed studies characterising consumption within specific typologies, such as different types of restaurants (self-service, fast food, à la carte) and food stores (markets, fruit and vegetable stores, beverage, tobacco, and frozen food outlets).
Characterisation of CLN mixed-use building usage, occupancy patterns, and per capita and area-based indicators supports improvements in urban water demand management in the Federal District. End-use data can also inform hydraulic system design and support the development of public policies and private initiatives aimed at water conservation in existing and future mixed-use buildings.
Overall, disaggregated analysis by activity and end use provides robust evidence of water-demand patterns in mixed-use buildings, strengthening the empirical basis for applied assessments in urban contexts with similar typological characteristics. The indicators are specific to the analysed context and reflect its inherent functional diversity.
The main limitations are related to the diversity of activities and the difficulty of achieving broad participation in end-use audits, given the technical complexity of instrumented installations and the time required to obtain representative datasets. Although total building consumption was robust, end-use audits were conducted in a more limited number of units. Nevertheless, the audited sample is comparable to that reported in national and international studies.
Future research could incorporate sensitivity analyses related to sample size and diversity of water uses, as proposed by Proença and Ghisi (2010), to further assess representativeness and refine end-use estimation at the building scale. Application of such procedures to sensor-based datasets would improve generalisability and strengthen methodological consistency.
-
Declaration of Generative AI and AI-Assisted Technologies in the Writing Process
DeepL Translator tool was used in the process of translating the original draft in Portuguese to English. The authors reviewed and edited the text as needed and assume full responsibility for the content of the published article.
-
Financial Support
Funding was obtained by the University of Brasília DPI/DPG Call nº 03/2021, Grant Number 23106.115169/2021-13, University of Brasília PPG-FAU Call nº 16/2025, Grant Number 23106.090960/2025-37 and Regulatory Agency for Water, Energy and Basic Sanitation of the Federal District - ADASA Award Number 197.000.977.
-
TOTUGUI, N.; BOEGER, L.; SANT’ANA, D. Water use analysis in mixed-use buildings in Brasília, Brazil. Ambiente Construído, Porto Alegre, v. 26, e152295, jan./dez. 2026. ISSN 1678-8621 Associação Nacional de Tecnologia do Ambiente Construído. http://dx.doi.org/10.1590/s1678-86212026000100972
Data Availability Statement
Data supporting the findings of this study are available from the corresponding author upon reasonable request.
References
- AFONSO, A. B. S. Contributos para o dimensionamento de redes de águas em edifícios especiais: aplicação de modelos matemáticos. Porto, 2001. Tese (Doutorado em Engenharia Civil) – Faculdade de Engenharia, Universidade do Porto, Porto, 2001.
- ALHARSHA, I.; MEMON, F. A.; FARMANI, R. An assessment of per capita water consumption in Sirte, Libya. In: NEW TRENDS in urban drainage modelling. Cham: Springer, 2019.
- ALHARSHA, I.; MEMON, F.; FARMANI, R. An assessment of per capita water consumption in Sirte, Libya. In: GREEN Energy and Technology. London: Springer, 2019.
-
AREAL, A. [Aerial photograph of SQN 213]. Available: https://mapio.net/images-p/2161002.jpg Access: May 20, 2021.
» https://mapio.net/images-p/2161002.jpg - BARTHICHOTO, M. et al Responsabilidade ambiental: perfil das práticas de sustentabilidade desenvolvidas em unidades produtoras de refeições do bairro de Higienópolis, município de São Paulo. Qualitas Revista Eletrônica, v. 14, n. 1, p. 1-12, 2013.
- BEAL, C. D.; MAKKI, A. A.; STEWART, R. A. What does rebounding water use look like? An examination of post-drought and post-flood water end-use demand in Queensland, Australia. Water Science and Technology: Water Supply, v. 14, n. 4, p. 561–568, 2014.
- BEAL, C. R.; SANTOS, R. F. Estudo sobre o consumo de água em restaurantes na cidade de Cascavel - PR. Revista Brasileira de Energias Renováveis, v. 1, p. 42-52, out. 2011.
- BERENHAUSER, C. J. B.; PULICI, C. Previsão de consumo de água por tipo de ocupação do imóvel. In: CONGRESSO BRASILEIRO DE ENGENHARIA SANITÁRIA E AMBIENTAL, 12., Balneário Camboriú, 1983. Anais […] Rio de Janeiro: ABES, 1983.
- BINT, L.; VALE, R.; ISAACS, N. Water efficiency in office buildings. In: VALE, R.; VALE, B. (ed.). Water efficiency in buildings: theory and practice. Chichester: John Wiley & Sons, 2014.
- BOEGER, L. Consumo de água em quitinetes e salas comerciais: uma análise da ocupação e dos usos finais de água em edifícios do Comércio Local Norte, Brasília-DF. Brasília, 2022. 201 f. Dissertação (Mestrado em Arquitetura e Urbanismo) – Faculdade de Arquitetura e Urbanismo, Universidade de Brasília, Brasília, 2022.
- BONFIM, B. C. S.; SANT’ANA, D. Análise dos usos finais de água de uma quitinete em Brasília. In: SANT’ANA, D. (org.). Água e o ambiente construído Ponta Grossa: Atena Editora, 2021.
- CAMPOS CARDOSO, R. N.; CAVALCANTE BLANCO, C. J.; DUARTE, J. M. Technical and financial feasibility of rainwater harvesting systems in public buildings in Amazon, Brazil. Journal of Cleaner Production, v. 260, 2020.
- CHOWDHURY, R. K. et al. Quantitative assessment of residential water end uses and greywater generation in the City of Al Ain. Water Science and Technology: Water Supply, v. 15, n. 1, p. 114–123, 2015.
- COMPANHIA DE PLANEJAMENTO DO DISTRITO FEDERAL. Pesquisa Distrital por Amostra de Domicílios (PDAD): Plano Piloto – 2018. Brasília: Codeplan, 2019.
- COMPANHIA DE PLANEJAMENTO DO DISTRITO FEDERAL. Consumo de água tratada no Distrito Federal: um retrato pós crise hídrica. Technical Note. Brasília: CODEPLAN, 2021.
- COSTA, L. Relatório do Plano Piloto de Brasília. 1957. Reprint. Brasília: IPHAN, 2018.
- COOK, S.; SHARMA, A. K.; CHONG, M. Performance analysis of a communal residential rainwater system for potable supply: a case study in Brisbane, Australia. Water Resources Management, v. 27, n. 14, p. 4865–4876, 2013.
- COOK, S.; SHARMA, A. K.; GURUNG, T. R. Evaluation of alternative water sources for commercial buildings: A case study in Brisbane, Australia. Resources, Conservation and Recycling, v. 89, p. 86–93, 2014.
- CREDER, H. Instalações hidráulicas e sanitárias 6. ed. Rio de Janeiro: LTC, 2006.
- DEOREO, W. B.; HEANEY, J. P. P.; MAYER, P. P. W. Flow trace analysis to assess water use. American Water Works Association, v. 88, n. 1, p. 79–90, 1996.
- DZIEGIELEWSKI, B. et al. Commercial and institutional end uses of water Denver: AWWA Research Foundation; American Water Works Association, 2000.
- DZIEGIELEWSKI, B. et al. Evaluation of urban water conservation programs: a procedures manual. Carbondale: Planning and Management Consultants, 1993. Prepared for the California Urban Water Agencies.
- FEDERAÇÃO DO COMÉRCIO DE BENS, SERVIÇOS E TURISMO DO DISTRITO FEDERAL. Revista Fecomércio-DF Brasília: Sistema Fecomércio-DF, 2016. n. 215.
- GHISI, E.; FERREIRA, D. F. Potential for potable water savings by using rainwater and greywater in a multi-story residential building in southern Brazil. Building and Environment, v. 42, n. 7, p. 2512–2522, 2007.
- GLEICK, P. P. H. et al. Waste not, want not: the potential for urban water conservation in California. Oakland: Pacific Institute, 2003.
- GOMEZ, J.; ALVES, W. Final water consumption in building installations using the flow-rate trace. In: INTERNATIONAL SYMPOSIUM ON WATER SUPPLY AND DRAINAGE FOR BUILDINGS, 26., São Paulo, 2000. Proceedings [...] São Paulo: USP, 2000.
-
GOOGLE MAPS. [Map of the Superquadras Norte location, Brasília-DF]. Available: https://www.google.com.br/maps/@-15.7590562,-47.8820733,6509m Access: 4 Jun. 2025.
» https://www.google.com.br/maps/@-15.7590562,-47.8820733,6509m - HAMMES, G.; GHISI, E.; THIVES, L. P. P. Water end-uses and rainwater harvesting: a case study in Brazil. Urban Water Journal, v. 17, n. 2, p. 177–183, 2020.
- HUSSIEN, W. A.; MEMON, F. A.; SAVIC, D. A. Assessing and Modelling the Influence of Household Characteristics on Per capita Water Consumption. Water Resources Management, v. 30, n. 9, p. 2931–2955, 2016.
- INSTITUTO BRASILEIRO DE GEOGRAFIA E ESTATÍSTICA. Classificação Nacional de Atividades Econômicas (CNAE): versão 2.0. 2nd ed. Rio de Janeiro: IBGE, 2015.
- INSTITUTO BRASILEIRO DE GEOGRAFIA E ESTATÍSTICA. Classificação Nacional de Atividades Econômicas (CNAE 2.0): online database. Rio de Janeiro: IBGE, 2025.
- JIANG, S. et al. Residential water and energy nexus for conservation and management: A case study of Tianjin. International Journal of Hydrogen Energy, v. 41, n. 35, p. 15919–15929, 2016.
- JORDÁN-CUEBAS, F. et al. Understanding apartment end-use water consumption in two green residential multistory buildings. Journal of Water Resources Planning and Management, v. 144, n. 4, p. 04018009, 2018.
- LIMA, B. C. et al. Sistema de Medição Individualizada de Água: Estudo de Caso de Edifício Comercial em São Paulo. REEC - Revista Eletrônica de Engenharia Civil, v. 11, n. 3, p. 56–66, 2016.
- LÚCIO, C.; SILVA, C. M.; SOUSA, V. A scale-adaptive method for urban rainwater harvesting simulation. Environmental Science and Pollution Research, v. 26, n. 16, p. 16401–16414, 2019.
- MAKKI, A. A. et al. Novel bottom-up urban water demand forecasting model: Revealing the determinants, drivers and predictors of residential indoor end-use consumption. Resources, Conservation and Recycling, v. 95, p. 15–37, 2015.
- MAKKI, A. A. et al. Revealing the determinants of shower water end use consumption: Enabling better targeted urban water conservation strategies. Journal of Cleaner Production, v. 60, p. 129–146, 2013.
- MARINOSKI, A. K. et al. Water end-uses in low-income houses in Southern Brazil. Water, v. 6, n. 7, p. 1985–1999, 2014.
- MARINOSKI, A. K.; RUPP, R. F.; GHISI, E. Environmental benefit analysis of strategies for potable water savings in residential buildings. Journal of Environmental Management, v. 206, p. 28–39, 2018.
- MATOS, C. et al. Domestic water uses: characterization of daily cycles in the north region of Portugal. Science of the Total Environment, v. 458–460, p. 444–450, 2013.
- MAYKOT, J. K.; GHISI, E. Assessment of a rainwater harvesting system in a multi-story residential building in Brazil. Water, v. 12, n. 2, p. 546, 2020.
- MILLER, J. E.; MILLER, M. A. Forecasting municipal and industrial water use Fort Belvoir: U.S. Army Corps of Engineers, 1983. (IWR Research Report 83R-3).
- MUNIINA, K.; MAKSIMOVIC, C.; GRAHAM, N. A novel approach for estimating urban water end use characteristics of cities in the developing world. Urban Water Journal, v. 14, n. 7, p. 750–757, 2017.
- NUNES, R. T. S. Conservação da água em edifícios comerciais: potencial de uso racional e reuso em Shopping Center Rio de Janeiro, 2006. 144 f. Dissertação (Mestrado em Engenharia, Ciências em Planejamento Energético) – Universidade Federal do Rio de Janeiro, Rio de Janeiro, 2006.
- PEDROSO, V. M. R. Manual dos Sistemas Prediais de Distribuição e Drenagem de Águas Lisboa: LNEC, 2007.
- PLANNING AND MANAGEMENT CONSULTANTS. IWR-MAIN 6.1 water demand analysis software: user’s manual and system description. Carbondale: Planning and Management Consultants, 1995.
- PROENÇA, L. C.; GHISI, E. Water end-uses in Brazilian office buildings. Resources, Conservation and Recycling, v. 54, n. 8, p. 489–500, 2010.
- RAMSEY, E.; BERGLUND, E. Z.; GOYAL, R. The impact of demographic factors, beliefs, and social influences on residential water consumption and implications for non-price policies in urban India. Water, v. 9, n. 11, p. 1–21, 2017.
- RICHTER, C. P. P.; STAMMINGER, R. Water Consumption in the Kitchen: a case study in four European countries. Water Resources Management, v. 26, n. 6, p. 1639–1649, 2012.
- SANT’ANA, D.; MAZZEGA, P. Socioeconomic analysis of domestic water end-use consumption in the Federal District, Brazil. Sustainable Water Resources Management, v. 4, n. 4, p. 921–936, 2018.
- SANT'ANA, D. et al. Reúso-DF: viabilidade técnica, ambiental e econômica do aproveitamento de águas pluviais e do reúso de águas cinzas em edificações não-residenciais no Distrito Federal. Relatório Técnico 6/2019. Brasília: Universidade de Brasília, 2019.
- SANTANA, L. F.; SANT’ANA, D. Técnicas de auditoria do consumo de água em edificações. In: SIMPÓSIO NACIONAL DE SISTEMAS PREDIAIS, 2., Porto Alegre, 2021. Proceedings [...] Porto Alegre: ANTAC, 2021.
- SECRETARIA DE ESTADO DE DESENVOLVIMENTO URBANO E HABITAÇÃO DO DISTRITO FEDERAL. Informação Técnica PLC PPCUB: Anexo X PURP TP2 – Superquadras e Áreas de Vizinhança. Brasília: SEDUH, 2019.
- SECRETARIA DE ESTADO DE DESENVOLVIMENTO URBANO E HABITAÇÃO DO DISTRITO FEDERAL. GeoPortal: Infraestrutura de Dados Espaciais – IDE/DF: online database. Brasília: SEDUH, 2025.
- SINGH, O.; TURKIYA, S. A survey of household domestic water consumption patterns in rural semi-arid village, India. GeoJournal, v. 78, n. 2, p. 777–790, 2013.
- SIVAKUMARAN, S.; ARAMAKI, T. Estimation of household water end use in Trincomalee, Sri Lanka. Water International, v. 35, n. 1, p. 78–87, 2010.
- SOUZA, D. P. P.; SANTOS, R. K.; SANTOS, R. F. Estimativa do consumo de água em restaurantes na cidade de Cascavel – PR. Acta Iguazu, v. 1, n. 3, p. 50-63, 2012.
- TALEBPOUR, M. R. et al. Water and energy nexus of residential rainwater tanks at an end use level: case of Australia. Energy and Buildings, v. 80, p. 195–207, 2014.
- TOTUGUI, N. et al. Caracterização dos usos-finais de água de edifícios comerciais: estudo de caso de um café em Brasília-DF. In: SIMPÓSIO NACIONAL DE SISTEMAS PREDIAIS, 1., Porto Alegre, 2019. Proceedings [...] Porto Alegre: ANTAC, 2019.
- UNITED NATIONS. The United Nations World Water Development Report. Paris: UNESCO, 2015.
- WAGGETT, R.; AROTSKY, C. Water key performance indicators and benchmarks for offices and hotels. London: CIRIA, 2006.
- WILLIS, R. et al. Gold coast domestic water end use study. Water, v. 36, n. 6, p. 84–90, 2009.
- WILLIS, R. M. et al. Alarming visual display monitors affecting shower end use water and energy conservation in Australian residential households. Resources, Conservation and Recycling, v. 54, n. 12, p. 1117–1127, 2010.
- WILLIS, R. M. et al. End-use water consumption in households: Impact of sociodemographic factors and efficient devices. Journal of Cleaner Production, v. 60, p. 107–115, 2013.
- WILLIS, R. M. et al. Quantifying the influence of environmental and water conservation attitudes on household end use water consumption. Journal of Environmental Management, v. 92, n. 8, p. 1996–2009, 2011.
Edited by
-
Editor in-chief:
Enedir Ghisi

 Source:

