
 Integrated analysis of physical and behavioral drivers of water consumption in university student housing: a study via post-occupancy evaluation and telemetry
Abstract
This study aims to analyze the physical and behavioral factors influencing household water consumption in an university student housing (USH) facility, integrating Post-Occupancy Evaluation (POE) and telemetry monitoring to identify variables that modulate water demand. This combined methodology was utilized to identify the main physical and socio-demographic factors that modulate water demand. The telemetry system revealed and enabled the rapid correction of critical leaks in flush valves, which were causing excessive consumption, resulting in the stabilization of the Per Capita Consumption Index (CI). This CI was then correlated with the residents' socioeconomic data and consumption habits, collected via the questionnaire. The walkthrough confirmed the presence of construction pathologies (waterproofing failure) and project gaps (vague technical memoranda). The POE indicated that while the number of residents influences total consumption, age does not correlate with the per capita CI, though gender appears to be a modulating factor. The main user demand is the installation of additional showers, and the high subsidy rate, coupled with the students’ previous housing context, suggests the need for awareness campaigns to combat behavioral waste.
Keywords
Post-Occupancy Evaluation; Telemetry; Water management; Leaks; University housing
Resumo
Este estudo tem como objetivo analisar os fatores físicos e comportamentais que influenciam o consumo de água doméstico em uma Moradia Universitária (MU), integrando Avaliação Pós-Ocupação (APO) e monitoramento por telemetria para identificar variáveis que modulam a demanda hídrica. Essa metodologia combinada foi utilizada para identificar os principais fatores físicos e sociodemográficos que modulam a demanda por água. A telemetria revelou e permitiu a rápida correção de vazamentos críticos em válvulas de descarga, que causavam consumo excessivo, resultando na estabilização do Índice de Consumo (IC per capita), o qual foi correlacionado com os dados socioeconômicos e hábitos de consumo dos moradores, coletados por questionário. O Walkthrough confirmou a presença de patologias construtivas (falha na impermeabilização) e lacunas em projeto (memoriais vagos). A APO indicou que, embora o número de moradores influencie o consumo total, a idade não é correlacionada com o IC per capita, mas o gênero sugere ser um fator modulador. A principal demanda dos usuários é a instalação de chuveiros adicionais, e a alta taxa de subsídio associada à origem da moradia anterior dos estudantes sugere a necessidade de campanhas de conscientização para combater o desperdício comportamental.
Palavras-chave
Avaliação Pós-Ocupação; Telemetria; Gestão hídrica; Vazamentos; Moradia universitária
1 Introduction
The rising demand for water resources, driven by accelerated urbanization and climate change, has highlighted the necessity for efficient water management, particularly in buildings designed for collective use (United Nations, 2022). In Brazil, this challenge is aggravated by the loss of approximately 38% of treated water within the supply system (SNIS, 2024), which compromises water sustainability. This high rate of loss often extends to internal building systems, manifesting as a critical problem beyond public networks. have established that consumption is influenced by both socio-demographic factors (e.g., age, gender, and occupancy) and physical factors (e.g., construction characteristics and the quality of building systems). However, research integrating these determinants in specific collective contexts, such as university housing, remains scarce. In university student housing (USH), the relationship between users and the built environment is unique; the residence is not merely a dwelling but part of a public educational institution operating under defined coexistence rules (Barros et al., 2017). This specific target audience may require distinct design parameters compared to standard residential buildings.
As highlighted by Barreto (2008), understanding water consumption patterns in residential buildings requires more than just technical analysis; it demands an investigation into end-use profiles and user behavior, which are influenced by socioeconomic factors and the types of appliances installed.
Despite investments in sustainable campus practices, the operation of student residences has received less attention than the planning, design, and construction phases (Ning; Chen, 2016). In higher education, the operation of USH significantly influences an institution's competitiveness (Hou et al., 2020) – referring to its capacity to effectively attract, retain, and support students – thereby impacting the perceived quality of the university experience. Therefore, evaluating whether these facilities meet user expectations and if their systems function efficiently is crucial.
In this context, Post-Occupancy Evaluation (POE) emerges as a vital tool. POE is a systematic process that analyzes a building's performance and its suitability for user needs after occupation (Romero; Vianna, 2002). By employing methods such as questionnaires, technical walkthroughs, project analysis, and on-site measurements, POE transcends architectural functionality to include human experience. This method captures the complexity of human interaction with built spaces, which is valuable in USH given the heterogeneity of resident profiles. Systematic observation allows for continuous design improvement, resulting in more inclusive projects adapted to real needs (Villa et al., 2015; Oliveira et al., 2023). This practice is vital for evolving technical standards, especially regarding the performance of sanitary hydraulic systems, which are historically a major source of building pathologies.
As noted by Cominato et al. (2023), the effectiveness of resource conservation systems in social housing is closely linked to user perception and behavior. Their study emphasizes that even when sustainable technologies are present, the lack of user engagement or understanding of the system can lead to sub-optimal performance, a phenomenon also observed in university environments where the lack of direct costs for the student may diminish the perceived value of conservation.
The POE analysis can be supplemented by precise quantitative data, such as information on water and energy consumption, often through a process known as documentary survey. Inefficient water consumption in buildings, whether due to behavioral waste by users or physical losses (leaks), can be detected more readily by real-time monitoring methods. Telemetry is a technology that enables efficient water management by allowing the remote collection and transmission of data, quickly identifying anomalies in water flow, preventing operational failures, and quantifying losses. Combining user perception (POE) with the accuracy of consumption data (Telemetry) allows for a robust diagnosis regarding the influence of socio-demographic factors and physical failures.
Technical failures in water installations are a significant source of building pathologies. According to Carretero-Ayuso et al. (2020), plumbing and sewage systems are among the most frequent subjects of user complaints due to construction deficiencies, highlighting that leakages and humidity issues represent a large portion of identified faults in residential buildings.
Given this context, this paper aims to analyze the physical (pathologies and leakages) and behavioral (socioeconomic profile and usage habits) factors that influence water consumption in a university residence. To achieve this, a hybrid approach is used, combining the quantitative rigor of telemetry with the qualitative analysis of POE, seeking to provide a basis for efficient water management in subsidized collective-use buildings.
2 Methodology
The present case study was conducted at the Moradia Universitária do Cerrado (MUC), an infrastructure linked to the Federal University of Catalão (UFCAT), located in the municipality of Catalão, Goiás. The MUC consists of a four-story building, totaling 23 apartments, and has a full capacity for 128 university students. The building also features a reception area and an administrative office. The methodology employed a combined approach, integrating both qualitative and quantitative data collection, as detailed in the following sections.
The research was conducted through an integrated methodological framework divided into four complementary phases to ensure full reproducibility and data triangulation:
-
Phase 1: Documentary Research and Technical Analysis. Initially, the building's technical memory, including plumbing and electrical design projects, was reviewed to identify the hydraulic configuration of the 23 residential units. This phase established the baseline for understanding the central solar heating system and the absence of a recirculation loop;
-
Phase 2: Technical Walkthrough and Physical Inspection. A physical inspection was performed to identify construction pathologies and operational anomalies. During this stage, spot-check measurements of the hot water system were conducted using a digital immersion thermometer (± 0.5 ºC accuracy) at 5 distinct points during morning peak hours to evaluate thermal stabilization and waiting times;
-
Phase 3: Post-Occupancy Evaluation (POE). User perception and consumption habits were collected through structured questionnaires. This qualitative data provided the basis for socio-demographic characterization (gender and age) and for identifying behavioral patterns that influence water demand. all the steps taken here comply with Resolution 466/2012 (Brazil, 2012), which stipulates that all research projects involving human beings must be assessed by the Comitê de Ética em Pesquisa (CEP) (Research Ethics Committee), evaluated in accordance with the Certificate of Presentation of Ethical Appreciation (CAAE) number 83139324.2.0000.0164); and
-
Phase 4: Telemetry Monitoring and Data Processing. Water consumption was monitored at 1-hour intervals using high-sensitivity meters (Qmin= 10 L/h) coupled with magnetic sensors. The data processing followed these sub-steps: Validation: Exclusion of units with hardware failure. Leakage Filtering: Identification of nocturnal minimum flow (10 L/h) between 1:00 a.m. and 5:00 A.M. for four consecutive hours to isolate physical losses from behavioral use. Index Calculation: The Per Capita Consumption Index (CI) was calculated. The CI represents an important performance metric, as it translates absolute consumption into a per capita rate, essential for comparing water use among apartments with different occupancy levels and for evaluating the water efficiency of the building as a whole. For each apartment, the Consumption Index was calculated using Equation 1:
Where:
CI is the Consumption Index (L/person·day);
Vtotal is the total volume of water consumed during the period (L);
Nres is the number of residents (hab); and
tmon is the number of monitored days (d).
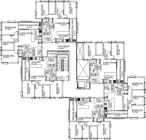
To provide a comprehensive understanding of the building's hydraulic configuration and pressure distribution, Figure 1 presents the architectural floor plan of a typical level, identifying the monitored apartments. Complementarily, Figure 2 shows a vertical section of the building, detailing the water storage and distribution infrastructure. The elevated water tank (upper reservoir) is positioned with its base 13.10 meters above the ground level, serving as the primary head for the distribution risers. For the apartments on the top floor (covering level), the available static pressure at the showerheads is 1.90 meters of water column (m.w.c.), representing the critical pressure point of the system. The section also illustrates the hot water storage (boiler), the main headers, and the distribution lines for both cold and hot water systems, tracing the flow from the storage units to the points of use within the apartments.

Schematic vertical section of the building showing the elevated water tank, boiler, and water distribution risers
2.1 Post-Occupancy Evaluation (POE)
The Post-Occupancy Evaluation was applied with the aim of surveying the residents' socio-demographic data and collecting their perceptions regarding the housing infrastructure and water usage. For this purpose, questionnaires were administered to the apartment residents. The participation was voluntary and anonymous. The questionnaire was initially administered electronically, with a link made available in the building residents' messaging application group, and was subsequently applied in person, by approaching residents in the building's hall. The questionnaires covered socio-demographic data (age, gender, number of residents per apartment), users' perception of the cold and hot water building installations, including the assessment of satisfaction with water pressure at specific points of use, satisfaction with the heating system, observation of the occurrence of leaks, and the general perception of the functioning and comfort of the hydraulic system and the environment.
Parallel to the questionnaire administration, the study adopted other POE techniques, such as the walkthrough and the analysis of the design projects for the building's Cold Water and Hot Water systems. The Walkthrough technique (or Technical Inspection) is a method for collecting qualitative and technical data widely utilized in building POE. It is, essentially, a systematic, on-site inspection carried out by specialists or researchers, with the objective of observing, registering, and evaluating the physical and functional conditions of a built environment after its occupation – in the case of this study, restricted to the inspection of the water building systems. Inspections were conducted on the Cold Water Building System and the Hot Water Building System to verify the installation's conformity with the original design, the quality of materials and finish, the detection of visible leaks, and the assessment of maintenance performed. The technical inspection (walkthrough) focused on the following specific aspects of the systems:
-
pathology identification: search for signs of corrosion, infiltrations, moisture stains, or leaks in connections, piping, and reservoirs (if accessible);
-
accessibility and operation: verification of the ease of access to registers, water meters, and other components for operation and maintenance;
-
equipment condition: visual assessment of critical components, such as valves, pumps, and the heating system; and
-
project comparison: comparison between what was installed in loco and what is documented in the original designs (drawings and descriptive memoranda).
The analysis of the design projects sought to complement the Walkthrough by obtaining data on the system typology, dimensioning, and flow/pressure prediction, which are essential for understanding any user dissatisfaction reported in the questionnaire (such as low water pressure). The combination of the technical inspection and documentary analysis aims to provide an objective physical basis for interpreting the consumption data and the residents' satisfaction perceptions.
Predetermined checklists were utilized to standardize the evaluation. The record was supplemented with notes, photographs, and annotations on the observed positive and negative aspects. Within the context of POE, the walkthrough is an important complementary tool for confronting the subjective perceptions of users (collected via questionnaires and interviews) with the technical reality of the building.
2.2 Telemetry and water consumption monitoring
For the collection of quantitative consumption data, the building's telemetry system was utilized. The existing system in the building is the "Smart32" brand, and was activated initially on January 19, 2025, for half of the building's apartments. Due to technical constraints, the remaining units were only integrated into the system on March 22, 2025. Consequently, to ensure data consistency across all units, the complete sampling series analyzed in this study covers the period from March 23, 2025, to May 20, 2025, during which all data included in this research were recorded. It employs remote monitoring software, installed and configured on a dedicated computer, establishing a direct connection with the two main data concentrators, named "Smartgate X". Each of these concentrators was responsible for collecting and storing consumption information from approximately half of the 23 apartments that constitute the housing facility, ensuring comprehensive and redundant coverage.
The water meters whose data are collected by the system were individually calibrated and possess a nominal flow rate (Qn) of 2.5 m³/h, a minimum flow rate (Qmin) of 10 L/h, and a nominal pressure (Pn) of 1 MPa. The calibration of the water meters was performed through direct measurement using a volumetric comparison method. This procedure involved passing a known volume of water through the devices and comparing the readings with standardized graduated containers (vessels of known volume). The tests were conducted at different flow rates to ensure accuracy across the operational range, confirming that the deviation remained within the limits established by technical standards. The system continuously monitors the consumption of cold water and hot Water, allowing remote access to the consumption data. Monitoring was conducted over a continuous period, with a focus on the month of April 2025. The consumption monitoring aimed to identify user usage patterns at different scales (daily, weekly, and monthly), enabling the identification of consumption peaks and usage trends. The data discretization interval was set at 1 hour, which is the minimum storage resolution provided by the telemetry system’s charts and tables, although the equipment is capable of indicating instantaneous consumption for real-time monitoring.
It is important to highlight that due to leaks identified as early as March, corrective interventions were carried out on the cold water systems on April 7th and 10th by the university's maintenance team, successfully containing the water loss. Based on the consumption anomalies detected by the telemetry system, specific maintenance was performed on the hydraulic systems of the apartments that showed the highest or most inconsistent consumption levels.
2.3 Data analysis
The data collected through the POE (socio-demographic and perception) and telemetry (water consumption) were integrated for analysis. The analysis of the telemetry data focused on quantifying consumption and identifying usage patterns. To investigate the relationship between the socio-demographic variables (obtained through the POE) and water consumption (telemetry data), several statistical analyses were employed, including the calculation of the Pearson correlation coefficient (r) and its respective significance test (p-value), using the R-Studio software. The objective was to identify the influence of specific resident factors and environmental characteristics on water consumption, in addition to demonstrating the consumption reduction achieved post-intervention.
To ensure the reliability of the behavioral analysis, a clear distinction was made between actual consumption (user habits) and physical losses (leakage). Based on the nocturnal minimum flow detected via telemetry (Phase 4) and technical walkthroughs, units with a CI exceeding 250 L/person·day were flagged as 'leak-driven outliers. The threshold of 250 L/capita·day for identifying 'leak-driven outliers' was established using a hybrid criterion. The primary indicator was the nocturnal continuous flow (minimum flow > 10 L/h for four consecutive hours) detected via telemetry and subsequently confirmed by the university’s maintenance team as localized leaks in flush valves. The CI value of 250 L/capita·day serves as a secondary screening benchmark, as it represents more than double the average consumption reported for university student housing in similar Brazilian contexts (approximately 100-110 L/capita·day) and exceeds the upper limit for high-standard residential consumption established by the World Health Organization (WHO).
These extreme values were predominantly caused by faulty flush valves, as confirmed by the university’s maintenance team. Consequently, the statistical correlation between socio-demographic factors and water use was performed twice:
-
including all data to quantify the total system impact; and
-
excluding leak-driven outliers to isolate true behavioral patterns. This sensitivity analysis prevents physical pathologies from skewing the interpretation of resident habits.
The exploratory gender analysis was conducted using a multi-step control procedure to isolate behavioral drivers from environmental and operational noise. First, the dataset was stratified by apartment type (standard typical units) and occupancy levels, using the Per Capita Consumption Index (CI) to normalize demand. Second, temporal filtering was applied to exclude recess periods and holidays, focusing solely on the academic term to ensure a stable user routine. Third, all leak-driven outliers (identified via nocturnal flow analysis) were removed from this specific sub-analysis. By filtering these confounders, the comparison between male and female residents reflects actual usage habits rather than building pathologies or variations in occupancy.
3 Results and discussion
3.1 Technical inspections (walkthrough) and documentary survey
The documentary investigation confirmed that the finalization of the architectural and sanitary hydraulic designs for the building occurred in 2019, the year that preceded and marked the start of construction activities. A crucial point to be highlighted is that, despite being a relatively contemporary construction, the project could not incorporate the technical guidelines established by the most recent version of Brazilian Standard NBR 5626 (ABNT, 2020). This standard, published after the project's conception, represents a significant advancement in Brazilian building engineering, notably by introducing methodological innovations. Among these innovations, the explicit recommendation that the dimensioning of systems be based on real consumption data (and not just tabulated reference values) stands out, along with a substantially greater emphasis on the effective performance of the systems, with a direct focus on user satisfaction and comfort. The non-conformity of the project with this new performance-centric approach can, in theory, be a factor explaining some of the dissatisfaction and discrepancies observed in loco, as detailed later in this section.
Regarding the internal configuration of the building, a mixed apartment typology was observed, with variable layouts and number of bathrooms, which directly impacts water demand. The apartments located on the ground floor, adapted for Persons with Disabilities (PwD), measure 72.71 m² and are notable for including two bathrooms, despite having only two bedrooms. This arrangement is a factor that influences the consumption analysis. In contrast, the standard apartments on the other floors maintain a similar area (76.71 m²), but their internal organization is distinct: they feature three bedrooms, but only one bathroom, which is equipped with two sanitary bowls and one shower.
The standard apartment type, which concentrates the majority of the resident population, possesses a single bathroom, which is equipped with two sanitary bowls, two countertop faucets, and one shower. Furthermore, the adjacent service balcony functions as a service area, containing a laundry sink and a washing machine. This concentration of use points in a single environment, serving up to six users, is an important factor for the simultaneity analysis and for evaluating system performance during peak usage moments. The distribution and composition of these elements in the space can be visualized in Figure 3, which displays the detailed floor plan of the standard apartment type.


All housing units are complete, including a living room, dining/kitchen area, and a service area equipped with a 13 kg washing machine, all furniture supplied by the University. Given the subsidized nature of the water supply, the institution's designers incorporated strategic measures to mitigate waste. These measures include the Individualized Metering System (IMS) for cold water, hot water, and energy in each apartment, the acquisition of a remote consumption monitoring system (telemetry), and the installation of water-saving fixtures, such as pressure-activated, self-closing faucets in the bathrooms. The effectiveness of these faucets, however, depends on regular maintenance (specifically adjusting the closing spring), a critical factor for conservation. Figure 4 displays a self-closing faucet and a general view of one of the ground-floor bathrooms.
The building's hydraulic infrastructure comprises a potable water storage system consisting of an upper tank with 20,720 L and a lower tank with 36,000 L. The latter was designed to supply both the current building and a future one. Regarding the provision of hot water, the system is centralized, utilizing a 5,000 liter storage tank (boiler). This is integrated with an extensive Solar Heating System (SHS), which uses 100 collector plates. It is noteworthy that the SHS circulation mechanism underwent significant modification: the initial design predicted natural thermosiphon circulation (recirculation by gravity due to the difference in water density). However, throughout 2023, the system's efficiency was improved through various interventions. These changes included the installation of a recirculation pump to force the flow, the insertion of pressure relief valves, the replacement of piping materials (from CPVC to PEX in the segment between the boiler and the plates, and in the connection between the plates), and the exchange of the complementary electric heater for one of higher power (Silva; Paula, 2023).
The system includes a thermostat that manages the activation of the backup heating. When solar irradiance is insufficient to maintain the desired temperature, the thermostat engages the complementary system, which is powered by the conventional electrical grid. It is important to emphasize that, in the housing facility, the showers represent the sole points of consumption fed by the hot water system. Figure 5 shows some of the SHS collector plates, as well as the boiler and the interconnecting PEX piping.

The building’s hydraulic system is organized into two main distribution sectors. From the upper reservoirs and boiler, two sets of main pipes – one for potable cold water and one for hot water – supply the building. These feed four vertical risers: two located in a shaft serving the eastern wing, and two in a western shaft, each supplying half of the apartments per floor.
The hot water system was designed without a recirculation loop at the end of the risers. The absence of a return point potentially increases the waiting time for hot water to reach the most distant consumption points from the central boiler. To evaluate this, a measurement protocol was conducted during technical inspections: the time elapsed between the activation of the shower valve and the arrival of water at a stable temperature was recorded using a digital stopwatch.
Regarding the hot water system performance, the classification of the service as 'sufficient' was based on spot-check measurements conducted during the technical walkthrough. The measurement protocol involved sampling five distinct points of use (showers) at different floor levels during the morning peak period (between 7:00 a.m. and 8:00 a.m.). Using a digital immersion thermometer (accuracy ±pm 0.5 ºC), the stabilized water temperature reached an average of 40.5 ºC, which falls within the thermal comfort range for domestic hygiene (38 ºC to 42 ºC). The waiting time for thermal stabilization ranged from 35 to 50 seconds. While these values satisfy the immediate comfort requirements of the residents – as confirmed by the POE – they represent a significant source of 'start-up' water waste. In a subsidized environment where occupants do not pay for individual consumption, this waiting period often results in the discharge of several liters of potable water into the sewage system before the user begins the shower, emphasizing a critical point for future plumbing interventions and the installation of recirculating pumps or better pipe insulation.
Regarding the CWBS the design specifies a 32 mm pumping line connecting the lower and upper water tanks. The distribution starts with a main header (110 mm diameter) that branches into 85 mm and 75 mm sub-headers. From these, two 75 mm risers descend through the floors, reducing to 50 mm at the ground floor level. After passing through individual meters, the PVC piping enters each apartment with a 32 mm diameter, branching out to reach the points of use (sinks, showers, and washing machines) with 25 mm pipes. To facilitate maintenance, the entire piping network is installed within the ceiling void (above the plasterboard), with no components embedded in the floor slabs. The cold and hot water systems in the MUC facility feature a technical design aimed at ensuring adequate performance and serviceability for collective use. However, the hot water distribution lacks a recirculation system, a common design gap in collective social housing that directly contributes to 'start-up' water waste. As discussed in the literature (Sborz et al., 2022), the absence of recirculation means that water must be discharged until the thermal transient is overcome, affecting both user comfort and resource conservation. Furthermore, the reliance on a single central solar heating system with limited distribution control reinforces the findings of Carretero-Ayuso et al. (2020), where deficiencies in project specifications often lead to operational anomalies and increased leakage risk in multi-unit buildings.
The descriptive memoranda referring to both the HWBS and CWBS revealed themselves to be excessively superficial. Limiting themselves to listing the types of materials employed, these documents lack crucial information about the project parameters and dimensioning adopted, such as guaranteed minimum flow rates, service pressures, or calculation methods. In contrast, the only document that offered robust technical detailing was the memorandum for the fire prevention and fighting system.
This documentary gap in the main hydraulic systems represents a significant obstacle (a notable negative point) for the management of the building. The absence of this data not only impedes the execution of in-depth research like the present one, which seeks to correlate design and performance, but also complicates and increases the cost of future interventions, modifications, or enhancements. The lack of a detailed history prevents the comprehension of the original project intent and hinders the taking of informed technical decisions.
The technical visits (walkthrough) to the building, performed on 01/13/2025 and 03/24/2025, aimed to validate conformity and maintenance conditions. It was verified that the ease of access for maintenance is well resolved: both the reservoirs (lower and upper) and the individual water meters for each apartment are located in ample spaces and in the main corridors of the floors. Generally, valves, lift pumps, faucets, and registers were in good condition and watertight. However, the only points of failure detected were in the flush valves of seven apartments (201, 203, 204, 206, 301, 403, 405), establishing these valves as the main focus of leaks in the building and demanding a plan for constant and rigorous maintenance and observation.
During the technical inspection (walkthrough), the generalized occurrence of infiltrations in various wet areas was identified, notably in the bathrooms and service areas of the apartments. These structural leaks are consistently attributed to deficiency in the execution or failure of the waterproofing of the subfloor in these areas. The immediate effect of these infiltrations is the accentuated degradation of the plaster ceiling on the immediately lower floor, compromising the aesthetics and integrity of the environment. At the time of this study, the UFCAT maintenance team had already carried out a specific on-site inspection with the purpose of elaborating a technical opinion and defining the corrective action plan. The walkthrough also detected the presence of moisture stains and infiltration on the masonry of the second-floor hall. This pathological manifestation was correlated with a specific leak in the cold water piping that was embedded in the wall. The occurrence of leaks in non-exposed piping represents a greater risk, as it requires disruptive interventions in the structure for access and repair, increasing costs and maintenance time.
The findings from the technical walkthroughs and inspections were systematized to provide a clear diagnosis of the building's pathological manifestations. Table 1 synthesizes the occurrences, identifying the locations, the nature of the anomalies, and the required or performed corrective actions
Synthesis of pathological manifestations and anomalies identified during the technical walkthroughs
Figure 6 highlights the building's critical pathological manifestations. In (A), arrows indicate localized moisture stains and paint peeling caused by constant infiltration from embedded piping. Image (B) captures the continuous water flow in the flush valve – a silent leak identified via telemetry – where the reflective sheen on the porcelain confirms the failure of the sealing mechanism; and (C) and (D) the degradation and holes in the plaster ceiling of the lower floor, resulting from waterproofing deficiencies.

(A) Wall infiltration caused by leakage; (B) Leaking flush valve, (C) and (D) Infiltrations and holes in the plaster ceilings
The set of these observations reinforces the imperative need for a twofold intervention plan: addressing both the corrective maintenance of defective hydraulic components and the implementation of structural sealing solutions to ensure the long-term durability and integrity of the building.
Figure 7 illustrates stalactite formation on the slab surface, a phenomenon resulting from continuous water percolation through the concrete. These formations originated from leaks in the bathroom floor directly above the entrance hall, where a failure in the waterproofing system allowed water to infiltrate the substrate. As the water percolates through the cementitious matrix, it leaches calcium hydroxide [Ca(OH)2], which reacts with atmospheric carbon dioxide (CO2) to form calcium carbonate (CaCO3) deposits. Additionally, a degraded section of the ceiling is visible where an opening was made to provide access for the maintenance of a leaking siphoned drain, further confirming the extent of the infiltration issues in this area.

(A) Stalactite formation on the slab due to water percolation; (B) Ceiling damage caused by a siphoned drain
The occurrence of waterproofing failures and plumbing anomalies observed in this University Housing facility aligns with the findings of Carretero-Ayuso et al. (2020). Their research indicates that a lack of technical rigor during the design and execution phases often leads to recurrent maintenance issues, such as those identified in the technical walkthrough of this study, which ultimately contribute to water losses and structural degradation.
3.2 Analysis of consumption data collected by the telemetry system
The telemetry system was configured with a temporal resolution of 1-hour intervals, which allowed for the monitoring of daily consumption cycles and the identification of atypical nocturnal patterns. Data aggregation involved pulses transmitted from magnetic sensors to a gateway, with the readings subsequently stored in an SQL database for analysis. Continuous use, indicative of leaks, was inferred when a non-zero flow rate was maintained for at least four consecutive hours during the period of lowest expected activity (1:00 a.m. to 5:00 a.m.), using a threshold of ≥ 10 L/h. The meters used in this study have a minimum flow rate (Qmin) of 10 L/h. This low detection threshold was essential for identifying the persistent leaks in flush valves that, while not always reaching high instantaneous flow, resulted in significant daily volumes. Regarding data integrity, one of the 23 residential units experienced a transmitter failure during the first month. This unit (apartment 405) was excluded from the initial comparative analysis to maintain the rigor of the dataset, resulting in a consistent sample of 22 apartments for the statistical correlations.
The remote consumption monitoring, carried out through the building's telemetry system, began on March 23rd, and revealed excessive consumption in apartments such as 102 (at least 510 L/h), apartment 401 (100 L/h continuous consumption), and 402 (140 L/h). These large volumes were recorded continuously, even at night or without occupation, which is a strong indication of large-scale leaks. Apartment 101 also presented small leaks (10 L/h continuous consumption). No leaks were detected in the other apartments. Apartment 405 could not be monitored due to a defective transmitter. Upon becoming aware of these leaks, the university's maintenance team was dispatched to the site, carrying out interventions, including the replacement of flush valves and faucets in some apartments (including 401 and 402), which occurred on April 10, 2025, with a previous action in apartment 102 on April 7, 2025. It was found that water losses resulted from malfunctioning flush valves, which caused a continuous and high flow. Following the maintenance, consumption in these apartments was normalized. Figure 8 contains the graph of daily cold water consumption in some of the main apartments, and shows a clear decrease in consumption in apartment 102 starting from April 7, and in apartments 401 and 402 starting from April 10. These apartments, which contained large-scale leaks before the repairs, underwent a sharp decrease, falling to normal consumption levels, in the range of 1,000 to 1,500 L/day.

The identification of excessive consumption due to faulty flush valves reinforces the findings of Barreto (2008), who noted that the technical condition of sanitary appliances is a critical factor in domestic water conservation. The rapid detection and correction of these leaks via telemetry proved essential to stabilize the consumption index, avoiding the 'invisible' losses typical in collective housing.
The technical issues identified during the walkthrough, such as waterproofing failures and leaking valves, and confirmed by the telemetry system, align with the findings of Cominato et al. (2023), who reported that post-occupancy failures in building systems often stem from a gap between design intentions and actual operational maintenance. This reinforces the need for integrated analysis to ensure that building services meet the users' needs without promoting waste.
To definitively validate the volume reduction and observe the sustainability of the new usage pattern after leak elimination and the conclusion of the academic recess, the telemetry monitoring was extended through May 2025.
Apartment 102, which was the main focus of corrective actions due to the most severe leak, demonstrated a notable and lasting stabilization in its daily consumption pattern. Records predominantly indicated volumes under 500 liters per day, with occasional peaks below 1,000 liters/day (exceptions noted only on May 3rd and 23rd). The consistent maintenance of this new consumption level, several times below the previous one, confirms the success of the corrective intervention in the hydraulic system.
A significant normalization in water usage patterns was also observed in apartments 401 and 402, units that previously had high consumption rates due to losses. During most of May, the daily consumption recorded in these units consistently ranged from 500 L/day to 1,000 L/day, as illustrated in Figure 9.

Considering that apartments 401 and 402 each have an occupancy of five residents, the per capita consumption (CI) for these units during May stabilized at an efficient rate, ranging between 100 and 200 liters per habitant per day (L/person·day), reinforcing the effectiveness of using the telemetry system in loss management.
From the continuous monitoring, the quantification of water consumption at different intervals became possible. Using the raw water volume data provided by the telemetry system and the number of residents allocated in each apartment during the study period, the Consumption Index (CI) calculation was performed in each apartment.
In addition to the individualized unit analysis, the Consumption Index (CI) was also calculated for the building in general, representing the average consumption per inhabitant per day (L/person·day) for the entire building. This aggregated value serves as a reference parameter for university management and allows for a direct comparison with national and international averages for consumption in buildings of similar typology. The detailed behavior of these indices in the monitored months can be observed in the graph presented in Figure 10.

The daily per capita consumption observed in this University housing facility aligns with variations reported in Brazilian residential studies. For instance, Barreto (2008) identified that per capita consumption can vary significantly depending on the household profile, emphasizing that the shower and kitchen taps are often the primary end-use points, which correlates with the high demand for more showers reported by the residents in this study.
The remote monitoring data confirmed the absence of significant HWBS losses in all residential units, suggesting the good condition and watertightness of the internal hot water distribution network. Daily hot water use in most apartments remained predominantly below the 200 liters per day (L/day) mark.
However, sporadic records in some units reached up to 400 L/day. These peaks can be attributed to longer bathing patterns or the high number of occupants at those times. A distinct pattern was verified in apartment 201, which exhibited persistently higher hot water consumption values. This discrepancy is likely a reflection of the unit's higher occupancy rate, an element already recognized to substantially influence overall water demand. Additionally, it is important to underline that the repairs executed on April 10th – which mainly focused on correcting cold water leaks in flush valves and faucets – did not cause notable modifications in the hot water consumption profile. Such a finding reinforces the conclusion that the HWBS did not have significant losses, maintaining its integrity.
The Consumption Indicators (CI) recorded via telemetry and shown in Figure 8 – 200, 190, and 235 L/person·day for March, April, and May, respectively – are consistent with patterns observed in semi-permanent residential settings, such as university housing. According to Otrubina et al. (2025), students often exhibit higher and more variable consumption compared to single-family households, largely due to the absence of direct utility costs. This is further supported by Barreto (2008) and Sborz et al. (2022), who emphasize that water demand in social and collective housing is heavily modulated by user behavior and socio-demographic factors rather than technical efficiency alone. The observed fluctuations, particularly the peak in May, may be attributed to end-of-semester academic pressures and distinct social rhythms, which often prioritize convenience over conservation. Furthermore, the high per capita values align with the findings of Cominato et al. (2023), who noted that when users do not perceive the direct cost of resources, there is a diminished incentive for saving. Additionally, the technical anomalies identified in the walkthrough, such as those discussed by Carretero-Ayuso et al. (2020), regarding plumbing faults and user complaints, explain how even small undetected leaks can inflate these daily indicators in a collective environment.
Hot water usage is restricted exclusively to the showers. Regarding the distribution mechanism, each shower point was equipped with two distinct pressure valves for managing the cold and hot water mixture, allowing the user to precisely adjust the desired temperature. This flexibility in mixture control is a factor that inherently contributes to the variability identified in hot water consumption among the apartments, as it reflects individual temperature preferences. Figure 11 shows the daily hot water consumption volume for selected apartments in April 2025, demonstrating low variation in consumption during the period.
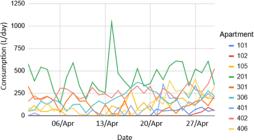
The consumed volumes also remained within standards, and no leaks were identified in the hot water system, as there was no continuous consumption in the hourly consumption graphs, with the number of water meter activations being few and at well-defined times each day, coinciding with the times when residents usually took showers before leaving or after arriving from their academic activities.
3.3 Socio-demographic profile of residents and correlation with collected consumption data
A total of 21 residents, distributed across different apartments, were interviewed. It is noted that, as participation was voluntary, there was a low participation rate in the survey, given that approximately 110 people resided in the building at the time of the study. Considering the population of 110 residents, the sample of 21 respondents results in a sampling error of approximately 19% for a 95% confidence level. While this error margin exceeds the conventional 5% or 10% used in large-scale social surveys, the sample represents 19% of the total population. In the context of building performance research and case studies with voluntary participation, such a sample provides relevant exploratory insights into user behavior and consumption patterns, although it cannot be strictly generalized as a statistically representative profile of the entire population. The majority of the interviewed MUC residents are young adults, 66.7% between 21 and 30 years old, and a slight male predominance (52.4%). The general quantitative distribution of residents per apartment and per gender (Figure 12) shows a male predominance, and the presence of mixed, female-only, or male-only apartments. The capacity of the apartments varies, being four people in the ground-floor apartments (adapted for PwD), and six people per apartment on the other floors.
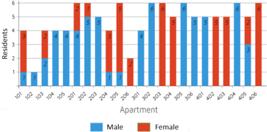
The analysis of the socio-demographic profile of the MUC occupants revealed that the residents' educational level does not demonstrate being a significant discriminating factor for establishing distinct water consumption patterns. This finding stems from the notable homogeneity in the study population's educational background: the majority of interviewees (85.7%) are pursuing higher education, and the remaining fraction (14.3%) are dedicated to postgraduate programs.
This uniformity in academic background implies that educational level, by itself, is not a robust explanatory variable for variations in per capita consumption. Thus, it is suggested that other elements, such as behavioral dynamics (user habits) and the physical conditions of the building and its systems, are what exert a preponderant influence on individual water demand in the housing. In contrast, a horizontal comparison of the consumption recorded in April raised indications that the gender of the residents may play a role in modulating water usage.
Housing units occupied exclusively by women (apartments 303 and 406) demonstrated lower water consumption profiles compared to those occupied only by men (apartments 302, 305, and 404). Although this disparity was qualitatively evident in the daily consumption curves throughout April – with female-occupied units consistently remaining below the male-occupied baselines – the results must be interpreted with caution. The short duration of the monitoring period and the limited number of single-gender units prevent a definitive quantitative generalization. Furthermore, external factors may have influenced the results, such as the academic recess that occurred during part of the study period, potentially altering occupancy patterns and daily routines. Therefore, while these findings suggest intrinsic differences in consumption habits between genders, longitudinal studies over a longer period and with a larger sample size are necessary to confirm these trends and isolate seasonal variables.
Such variations may be attributable to potentially more economical usage patterns or the adoption of differentiated hygiene and cleaning routines between men and women. Given the relevance of this distinction for water management, this finding requires further investigation in future studies that can isolate and quantify the behavioral impact of gender.
The comparative detail of the daily water consumption profile between exclusively male and exclusively female apartments can be visualized in Figure 13.

Comparison of total cold water consumption in April 2025: apartments occupied exclusively by men (302, 305, 404) and exclusively by women (303, 406)
The relationship between the average age of residents and per capita consumption was also investigated. Table 2 shows the average age of residents in each apartment and the average daily per capita consumption (L/person·day), calculated based on the monthly totals. The table shows that some apartments exhibited exceptionally high consumption (water losses due to leakage).
For instance, apartment 102 (where a leakage affected both April and May figures) and apartment 206, which showed high consumption specifically in May due to a malfunction in the flush valve.
The average ages ranged from 20 years to over 29 years across the apartments. The Pearson Correlation Coefficient (r) and the respective Significance Test (p-value) were calculated using the R-Studio program to evaluate the statistical significance of the linear correlation between the two variables Average Age and average daily per capita cold water consumption in April for the 22 apartments. For this test, the null hypothesis (H0) is that there is no linear correlation between the variables in the population (ρ=0), and the alternative hypothesis (H1) is that a correlation exists (ρ≠0). The results obtained were:
-
Pearson Correlation Coefficient (r) ≈−0,117; and
-
P-value ≈0,596.
Regarding the Pearson Correlation Coefficient (r): The value of r indicates a very weak negative correlation (almost negligible) between the average age of residents and per capita water consumption in April. The negative sign suggests that, if there is any trend, it would be that a slight increase in average age is associated with a slight decrease in per capita consumption, but the magnitude is so small that the relationship is practically non-existent. As for the p-value, approximately 0.596, this is greater than the adopted significance level of 0.05 (or 5%). This means that the correlation of -0.117 observed in the apartment sample is not statistically significant.
The same analysis was performed comparing the May data with the average ages, yielding similar results (r ≈−0.063 and p-value ≈ 0.771), reinforcing the idea that the age of the residents, by itself, does not appear to be a determining factor in per capita water consumption in this university housing. It was concluded from this investigation that a larger sample would be necessary to obtain a more precise correlation analysis.
Due to the non-normal distribution of water consumption data and the presence of extreme values caused by leakage, the Spearman’s rank correlation (ρ) was employed alongside Pearson’s r. Spearman’s method is more robust to outliers and does not require the assumption of normality, making it more appropriate for identifying monotonic relationships between socio-demographic variables and water demand. The statistical analysis revealed no significant correlation between age and the Per Capita Consumption Index (CI). The initial Pearson coefficient was corroborated by the Spearman’s correlation (ρ ≈ -0.08; p > 0.05), confirming that even after accounting for the non-normal distribution of the data, the variables remain independent. This suggests that, in this specific university housing context, other drivers such as building pathologies and occupancy levels exert a much more dominant influence on water demand than the residents' age. Furthermore, gender-based comparisons are treated as exploratory, with results controlled for potential confounders such as occupancy levels and apartment types. As part of a sensitivity analysis, correlations were calculated both with and without leak-driven outliers to ensure the reliability of behavioral inferences.
In this regard, it is worth noting that the observations made regarding the potential influence of socio-demographic factors, such as gender and age, on water consumption patterns should be viewed as an initial exploratory analysis. To achieve statistically robust and reliable conclusions, the collection of a larger volume of data over an extended period is indispensable.
Additionally, an element that introduces considerable methodological complexity into advanced statistical analyses is the high occupancy turnover in university housing. The frequent rotation of residents, including the entry and exit of new occupants and occasional apartment changes throughout the study period, makes it difficult to standardize variables and maintain a fixed consumption history per unit, requiring more sophisticated statistical methods to isolate the influence of these factors.
The findings of this study regarding the influence of the number of residents on total consumption, while age showed no significant correlation with per capita indices, are consistent with the global trends synthesized by Sborz et al. (2022). Their review indicates that while household size is a primary driver of total demand, individual consumption patterns are more strongly modulated by specific habits and the presence of subsidies or lack of financial responsibility for water costs. This methodological complexity is further reinforced by Otrubina et al. (2025), who note that university housing represents a unique 'semi-permanent' residential context where fluctuating occupancy and student routines create high variability in water use data. Similarly, Jonge et al. (2022) highlight that the lack of information on actual consumption in collective student housing often stems from these dynamic occupancy patterns, which differ significantly from standard residential models and require localized, high-resolution monitoring to accurately isolate behavioral influences from technical performance.
3.4 Satisfaction with hydraulic system elements
In addition to surveying socio-demographic data, the applied POE questionnaire sought to ascertain residents' satisfaction regarding the CWBS and HWBS.
Regarding water pressure, the chart presented in Figure 14 reveals that 38% are satisfied, while 33% consider it regular. There is, however, a portion of dissatisfied (9.5%) and very dissatisfied (4.5%), which may be associated with the unequal distribution of pressure among the apartments, especially those located on the upper floors. This physical factor directly impacts consumption behavior, potentially leading to longer showers or attempts to reuse water to compensate for these limitations.

The satisfaction survey data with the MUC water heating system demonstrates expressive approval. Combining the "Very Satisfied" and "Satisfied" categories, 76% of residents are satisfied with the service. Although a portion of 19% classifies it as "Regular," and only 5% are "Dissatisfied." These results indicate that the MUC water heating system predominantly meets user expectations. However, it should be highlighted that the MUC heating system is of the solar type, with a conventional backup system, which, during 2023, experienced problems with low water temperatures in the showers and delays in the arrival of heated water. At that time, there were several complaints that led the maintenance team and the University's Infrastructure Secretariat to make several alterations to the Solar Heating System (SHS), which resolved the cited issues, according to studies conducted (Silva; Paula, 2023). Nevertheless, it must be emphasized that the system requires periodic maintenance to prevent problems with abrupt temperature variations and insufficient heating. Thus, the current SHS at the MUC differs from what is stipulated in the original building plans.
The "Previous Housing Situation" may also affect the volume of water used by residents. The following data were extracted from the applied questionnaire regarding their previous residences: of the total respondents, the majority (71.4%) reported having resided in rented properties before moving to the MUC. This data suggests that the interviewed students were already inserted into the urban real estate market, likely in a context of economic vulnerability or high housing costs, which reinforces the social relevance of public university housing. Almost one-fifth of the residents (19.0%) came from a rural area dwelling. This proportion points to the diversity of the students' origins and the need for adaptation to a new urban environment, which may influence the use and perception of the MUC's building systems and infrastructure.
Finally, a residual portion (9.5%) of the students resided in owner-occupied housing before entering the MUC, indicating that the move to the university residence, even for this group, was motivated by factors such as the pursuit of proximity to the campus or the need for student support. This distribution reveals that the MUC primarily serves a public that depended on costly rented housing, acting as a factor in mitigating housing costs for the vast majority of its residents. In many rented homes (especially in large urban centers or buildings), water metering can be collective or the tariff may be passed on at a fixed rate, without individual metering. Residents coming from rentals with collective metering or a fixed tariff may have less awareness of the cost and volume of water consumed individually. Upon moving to the MUC, where water is subsidized by the university and, theoretically, without a direct tariff for them, this lack of concern about the direct cost may persist, leading to higher consumption than if they had to pay individually.
Residents of rural origin may bring with them higher consumption habits (if accustomed to abundance and low cost) or, conversely, more economical habits (if accustomed to scarcity or the need to "fetch" water). Residents of owner-occupied properties generally pay their water bills directly and, therefore, have a direct financial incentive to monitor and control their consumption. There is a higher probability of having already developed saving habits. Regarding the general quality of the hydraulic installations in the bathrooms and kitchens, the interviewees mostly opined that they were good or excellent (72%), only 19% considered them regular, and 9% considered them poor, as shown in Figure 15. It is important to note that none of the questions in the questionnaire were mandatory, which is why some of the charts have a sum less than 100%.

In addition to satisfaction with the sanitary hydraulic systems, interviewees were asked about the quality of the materials and finish of the hydraulic equipment (faucets, showers, registers, and flush valves). The results are in Figure 16 and show that the majority classifies this equipment as good.

Resident satisfaction regarding plumbing fixtures (faucets, showers, valves, and flush systems)
This result may be somewhat surprising, as recurrent leaks were detected in items such as the flush valves. However, this positive perception can be explained by the fact that the users' quality assessment of the materials is primarily based on aesthetic and visual aspects (finish and general appearance) and immediate functionality (whether the equipment turns on and off correctly), and not necessarily on the long-term technical durability or watertightness of the component.
In other words, residents perceive the equipment as good quality because it is visually appealing and functions at the moment of use. The problem of leakage in the flush valves is an issue of performance and maintenance that is not always evident or attributed to "poor quality" of the material by the lay user, but rather to a sealing failure or a need for repair. This contrast reinforces the importance of combining the subjective perception of the Post-Occupancy Evaluation with the technical inspection (walkthrough) and objective monitoring (telemetry) for a complete diagnosis of the building.
With the objective of understanding the environmental awareness and water resource usage habits of the residents, the questionnaire included a section dedicated to the water-saving practices adopted in daily life. The results, presented in the graph "What do you do to save water?" (Figure 17), reveal a high adherence to low-effort and routine conservation practices.

The majority of interviewees affirmed adopting essential faucet-closing measures during hygiene activities: 80% said they lather dishes with the faucet off, and another 80% indicated brushing their teeth following the same practice. However, a significantly lower adherence is observed to habits that require greater behavioral change or logistical planning: only 43% of residents affirmed taking quick showers (lasting less than 5 minutes). The practice of reusing washing machine water is adopted by 19% of interviewees. Only 9% reported the habit of utilizing the washing machine at the maximum level, optimizing water usage. A key finding is that 29% of interviewees admitted not saving water. This percentage is relevant and may be associated with the perception that, in housing with water subsidized by the university, the financial incentive for the economy is non-existent. Finally, residents were also questioned about the most desired improvements to the building's cold and hot water systems, the results of which are illustrated in the annexed chart (Figure 18).

The most expressive result points to the desire to increase the number of showers in the apartments, a request endorsed by 62% of interviewees. This demand is comprehensible, given the high occupancy density of the units (six residents in standard apartments) and the existence of only one shower per apartment. Other relevant suggestions include:
-
increasing pressure in kitchen faucets, which was cited by 43% of residents, indicating dissatisfaction with the functionality of these points of use;
-
improve the stability of the HWBS (Hot Water Building System) temperature, mentioned by 29%, suggesting that, despite the improvements made in 2023, temperature variations still occur during showering;
-
more frequent maintenance on the systems, a desire expressed by 19% of residents; and
-
the installation of an artesian well in the building, suggested by a minority portion (9%), possibly aiming to reduce operational costs or ensure water autonomy, considering that water shortages have occurred in the neighborhood with some frequency.
These direct user suggestions (POE) provide a priority map for management and planning future interventions and projects in the housing, focusing on improving perceived functionality and comfort.
This study provides insights into water management in university housing; however, it possesses inherent limitations regarding the generalizability of its findings. First, the subsidized housing context – where students do not bear the direct costs of utility bills – creates a specific consumption behavior that may not represent conventional residential markets. Methodological complexities also arise from high occupancy turnover and residency variability, which challenge the standardization of consumption variables over time. Furthermore, the short monitoring period, combined with academic recesses, can drastically alter demand patterns and potentially mask the long-term impact of maintenance interventions. Technically, the instrumentation failure in one unit and the potential for underreporting minor drips due to the meters' Qmin (10 L/h) are acknowledged. Finally, the presence of leak-driven distortions, such as the defective flush valves identified, significantly skewed initial data, requiring careful filtering to distinguish between behavioral consumption and physical losses. These factors underscore the complexity of managing resources in collective housing and suggest that future research should incorporate longer monitoring cycles and comparative analyses across different subsidy models. Furthermore, while Carretero-Ayuso et al. (2020) emphasize that many water-related faults stem from design gaps, this study demonstrates that integrating telemetry with user feedback (POE) allows for the early detection of these 'invisible' failures, such as malfunctioning flush valves, before they escalate into major building pathologies.
The results obtained demonstrate that, although the efficiency of the installations has been significantly improved and the detection of losses, such as leaks, has become more effective, the sustainability of resources in buildings like the MUC goes beyond merely technical aspects.
Key Findings and Implications:
-
occupancy impact: a central finding was that residential units with a greater number of occupants registered a higher total volume of water consumption. However, when analyzing the Consumption Index (CI – consumption per inhabitant per day), there was no significant variation directly linked to the number of residents. This suggests that the distribution of indirect costs or the perception of shared use is not necessarily raising per capita consumption disproportionately.
-
effectiveness of telemetry: the use of individual meters and the telemetry system was fundamental for management. The rapid identification and correction of leaks, for example, resulted in a reduction of up to 78% in consumption in critical apartments.
-
human and behavioral factors: the need for preventive maintenance of equipment and the continuous education of residents on the rational use of water and energy emerge as critical components. Since water is subsidized, the consumption culture (Costa et al., 2024), influenced by previous housing (e.g., collective metering), becomes a significant challenging factor for conservation.
Therefore, the active involvement of residents and the awareness of responsibility in the use of resources emerge as indispensable strategies for the maintenance and enhancement of the achieved efficiency benefits. Future efforts should focus on the integration between technology (monitoring) and behavior (educational campaigns).
4 Conclusions
This case study, which applied the POE integrated with telemetry monitoring, provided a multifaceted diagnosis of the performance of the sanitary hydraulic systems and the influence of socio-demographic factors on water consumption. The integration of telemetry and POE at the MUC can be useful in evaluating the factors that influence water demand. The system allowed for the identification and correction of significant leaks. Although the number of residents influences total consumption, the average age showed no significant correlation with per capita consumption. Satisfaction with the hydraulic equipment (faucets, showers, registers) is high, but water pressure still generates dissatisfaction (15% dissatisfied). The previous housing situation (71.4% rented) may influence consumption habits in the current housing. The majority of residents reported adopting at least one habit to save water in daily life, and many suggested that the main measure to improve comfort is the installation of an additional shower in the apartment, as well as improving the pressure in the kitchen faucet. The study has limitations due to the heterogeneity and turnover of residents and academic recesses. Preventive maintenance and awareness campaigns for rational water use are recommended.
-
SILVA, R. E.; PAULA, H. M. Integrated analysis of physical and behavioral drivers of water consumption in university student housing: a study via post-occupancy evaluation and telemetry. Ambiente Construído, Porto Alegre, v. 26, e152273, jan./dez. 2026. ISSN 1678-8621 Associação Nacional de Tecnologia do Ambiente Construído. http://dx.doi.org/10.1590/s1678-86212026000100978
-
Declaration of Generative AI and AI-Assisted Technologies in the Writing Process
Not applicable.
-
Financial Support
Not applicable.
Data Availability Statement:
The data that support the findings of this study are available from the corresponding author, upon reasonable request.
References
- ASSOCIAÇÃO BRASILEIRA DE NORMAS TÉCNICAS. NBR 5626: potable water systems within buildings: design, installation, operation and maintenance. Rio de Janeiro, 2020.
- BARRETO, D. Perfil do consumo residencial e usos finais da água. Ambiente Construído, Porto Alegre, v. 8, n. 2, p. 23-40, abr./jun. 2008.
- BARROS, D. et al A APO como base para a programação arquitetônica de uma residência universitária. In: ENCONTRO DE SUSTENTABILIDADE EM PROJETO, 5., Florianópolis, 2017. Anais [...] Florianópolis: UFSC/VIRTUHAB, 2017.
-
BRASIL. Conselho Nacional de Saúde. Resolução nº 466, de 12 de dezembro de 2012. Brasília: Ministério da Saúde, 2012. Available: http://conselho.saude.gov.br/resolucoes/2012/Reso466.pdf Access: Jan. 4, 2024.
» http://conselho.saude.gov.br/resolucoes/2012/Reso466.pdf - CARRETERO-AYUSO, M. J. et al Occurrence of faults in water installations of residential buildings: an analysis based on user complaints. Journal of Building Engineering, v. 27, p. 100, 2020.
- COMINATO, G. et al Percepção dos usuários de sistema de aquecimento solar de água em habitações de interesse social. Paranoá, n. 34, p. 1-19, 2023.
- COSTA, S. et al Understanding residential water demand: insights from a survey in a Mediterranean city. Urban Water Journal, v. 21, n. 4, p. 521-537, 2024.
- DE JONGE, L. et al Water use in collective student housing. In: WDSA/CCWI JOINT CONFERENCE, 2., Valencia, 2022. Proceedings [...] Valencia, 2022.
- HOU, H. et al Gap theory based post-occupancy evaluation (GTbPOE) of dormitory building performance: A case study and a comparative analysis. Building and Environment, v. 185, 2020.
- NING, Y.; CHEN, J. Improving residential satisfaction of university dormitories through post-occupancy evaluation in China: a socio-technical system approach. Sustainability, v. 8, n. 10, p. 1050, 2016.
- OLIVEIRA, L. A. et al Desempenho das edificações: projeto, construção e manutenção. Rio de Janeiro: LTC, 2023.
- OTRUBINA, K. T. et al Understanding water consumption in a semi-permanent residential context through university student housing showers. Environmental Research: Infrastructure and Sustainability, v. 5, 2025.
- ROMERO, M.; VIANNA, M. Avaliação pós-ocupação de conjuntos habitacionais: estudo de caso em São Paulo. Revista Brasileira de Estudos Urbanos e Regionais, v. 4, n. 1, p. 9-22, 2002.
- SBORZ, J. et al A review on domestic hot water consumption in social housing. Water, v. 14, n. 17, p. 2699, 2022.
- SILVA, R. E. R.; PAULA, H. M. Monitoramento do consumo de água em moradia universitária: estudo de caso na UFCAT em Catalão-GO. In: SIMPÓSIO NACIONAL DE SISTEMAS PREDIAIS, 3., Porto Alegre, 2023. Anais [...] Porto Alegre: ANTAC, 2023.
- SISTEMA NACIONAL DE INFORMAÇÕES SOBRE SANEAMENTO. Diagnóstico dos Serviços de Água e Esgotos 2023 Brasília: Ministério das Cidades, 2024.
-
UNITED NATIONS. The United Nations World Water Development Report 2022: groundwater: making the invisible visible. Paris: UNESCO, 2022. Available: https://unesdoc.unesco.org/ark:/48223/pf0000380721 Access: 15 Apr. 2025.
» https://unesdoc.unesco.org/ark:/48223/pf0000380721 - VILLA, S. B. et al Avaliação pós-ocupação no Programa Minha Casa Minha Vida: uma experiência metodológica. Uberlândia: UFU/PROEX, 2015.
Edited by
-
Editor in-chief:
Enedir Ghisi
-
Guest editor:
Daniel Sant’Ana


