Integrated analysis of hygrothermal performance, CO2 concentration, and filamentous fungi growth in social housing in Bioclimatic Zone 2R
Abstract
The study evaluates indoor air quality in social housing units located in Pelotas/RS, considering the proliferation of filamentous fungi and the concentration of carbon dioxide in two indoor environments of a building with cast-in-place concrete walls. The research was developed through computational simulations using the EnergyPlus, WUFI - 2Pro, and WUFI - Bio software, with the thermal properties of the concrete obtained from laboratory tests. The building’s solar orientation was considered to define the most critical internal walls in terms of radiation incidence and indoor hygrothermal conditions. The results indicated differences in the hygrothermal performance of the analyzed internal surfaces, with a greater propensity for the occurrence of internal surface condensation and moisture-related degradation processes, such as the promotion of fungal growth. The isopleth analysis showed relevant variations in surface moisture levels throughout the simulated period, indicating favorable conditions for the growth of filamentous fungi and reinforcing the need for strategies such as adequate ventilation and the use of materials and coatings with better hygrothermal performance. It was also observed that increasing the temperature setpoint from 19 °C to 25 °C intensifies the risk of fungal proliferation and CO2 concentration, especially in scenarios without ventilation.
Keywords
Filamentous fungi; Hygrothermal performance; Indoor air quality; Residential building; Cast-in-place concrete
Resumo
O estudo avalia a qualidade do ar interior em habitações de interesse social localizadas em Pelotas/RS, considerando a proliferação de fungos filamentosos e a concentração de dióxido de carbono em dois ambientes internos de uma edificação com paredes de concreto moldadas in loco. A pesquisa foi desenvolvida por meio de simulações computacionais, utilizando os programas EnergyPlus, WUFI-Pro e WUFI-Bio, com propriedades térmicas do concreto obtidas a partir de ensaios laboratoriais. A orientação solar da edificação foi considerada para a definição das paredes internas mais críticas quanto à incidência de radiação e às condições higrotérmicas internas. Os resultados indicaram diferenças no desempenho higrotérmico das superfícies internas analisadas, sendo observada maior propensão à ocorrência de condensação superficial interna e a processos de degradação associados à umidade, como o favorecimento ao crescimento fúngico. A análise das isopletas evidenciou variações relevantes nos níveis de umidade superficial ao longo do período simulado, indicando condições favoráveis ao crescimento de fungos filamentosos e reforçando a necessidade de estratégias como ventilação adequada e o uso de materiais e revestimentos com melhor desempenho higrotérmico. Observou-se, ainda, que o aumento do set point de temperatura de 19 °C para 25 °C intensifica o risco de proliferação fúngica e a concentração de CO2, especialmente em cenários sem ventilação.
Palavras-chave
Fungos filamentosos; Desempenho higrotérmico; Qualidade do ar interior; Edificação residencial; Concreto moldado in loco
1 Introduction
Indoor air quality (IAQ) is a critical factor for environmental comfort and occupant health, particularly in Social Interest Housing (SIH), which often suffers from excessive humidity and inadequate ventilation. In buildings constructed with cast-in-place concrete walls, a technique widely adopted for its cost-effectiveness and rapid execution, the low thermal resistance of the building envelope and the absence of thermal insulation can contribute to surface condensation and the growth of filamentous fungi (Duarte, 2023; Guerra et al., 2012). The presence of these microorganisms degrades building materials and compromises air quality, leading to respiratory issues, allergies, and general environmental discomfort, especially among vulnerable populations (Zanoni, 2015).
Given the limited financial resources available for maintenance in SIH developments, it is essential to adopt construction strategies that integrate moisture control, effective ventilation, and protective coatings to ensure healthier and more durable indoor environments (Duarte, 2023). The hygrothermal performance of building, referring to the simultaneous transport of heat and moisture through building components, is a key aspect in evaluating these phenomena (CIB, 2012; Zanoni, 2015). In Brazil, research on this topic has advanced through field measurements (Dantas; Zanoni, 2020; Zanoni et al., 2020), surface condensation analysis (Buligon, 2021; Pires, 2020), and studies on mold growth (Afonso, 2018), highlighting the influence of climate on facade degradation (Nascimento, 2016; Von Eye et al., 2017) and indoor moisture risks (Morishita et al., 2016; Morishita, 2020).
In addition to humidity and fungi, carbon dioxide (CO2) is another relevant parameter in IAQ assessment. Although not toxic at typical residential concentrations, CO2 is widely used as an indirect indicator of ventilation efficiency. Elevated CO2 levels, often above 1,000 ppm, suggest insufficient air exchange and potential accumulation of harmful contaminants such as volatile organic compounds and bioaerosols (Persily; Jonge, 2017). High concentrations are also associated with fatigue, headaches, and impaired cognitive performance (Allen et al., 2016; Satish et al., 2012). Therefore, CO2 monitoring provides an important diagnostic tool for identifying critical ventilation conditions in low-income housing.
Ventilation plays a fundamental role in IAQ management by simultaneously diluting occupant-generated CO2 and removing indoor humidity and airborne fungal spores. Recent studies have shown that environments with elevated CO2 concentrations tend to have higher fungal loads, a result of insufficient ventilation (Vornanen-Winqvist et al., 2018; Kacprzak et al., 2022). However, excessive ventilation in humid climates may increase indoor relative humidity, thereby promoting microbial growth. These findings underscore the need to balance ventilation rates, moisture control, and energy efficiency to ensure healthy and sustainable indoor environments (Hesaraki; Myhren; Holmberg, 2015).
In this context, the present study investigates IAQ in SIH units located in Pelotas, RS, with a focus on the proliferation of filamentous fungi and the influence of CO2 concentration, ventilation, and hygrothermal behavior in cast-in-place concrete buildings. The research aims to establish the impacts of moisture, ventilation efficiency, and contaminant accumulation in low-income housing, supporting the development of construction strategies that promote healthier, more durable, and energy-efficient indoor environments.
The proposed evaluation was based on simulations carried out using two different software programs: EnergyPlus 9.6 and WUFI Pro 6.7. EnergyPlus was used to determine indoor climate conditions, which were subsequently employed as input data for WUFI Pro, in addition to evaluating CO2 concentration. WUFI Pro, in turn, was applied to analyze the hygrothermal performance of the building.
2 Theoretical framework
2.1 Indoor air quality and health
IAQ is defined by the chemical, physical, and biological composition of air in enclosed environments, directly influencing occupant health, comfort, and productivity (Sundell, 2017). Epidemiological studies show that urban populations spend approximately 90% of their time indoors (Klepeis et al., 2001), making exposure to indoor pollutants a significant risk factor for respiratory, cardiovascular, and neurological diseases (Wargocki; Wyon, 2017).
Indoor pollutants are generally classified into three main categories:
-
gaseous chemical contaminants (e.g., CO2, volatile organic compounds (VOCs), NOₓ, ozone);
-
particulate matter (PM₂.₅, PM₁₀); and
-
bioaerosols (e.g., bacteria, fungi, viruses, dust mites) (Jones, 1999; Després, 2012).
Each category presents distinct dispersion and deposition mechanisms, as well as specific health impacts, thereby requiring targeted control and monitoring strategies (Nazaroff, 2013).
The World Health Organization (WHO) estimates that exposure to indoor pollutants accounts for approximately 3.2 million premature deaths annually, particularly in developing countries where biomass-based heating and cooking systems are common (WHO, 2025). In developed countries, poor IAQ is often linked to Sick Building Syndrome (SBS), which is characterized by nonspecific symptoms such as headaches, fatigue, mucosal irritation, and concentration difficulties (Redlich; Sparer; Cullen, 1997).
2.2 CO2 as a ventilation indicator
CO2 is a colorless and odorless gas naturally present in the Earth's atmosphere at concentrations of approximately 425 ppm in 2025 (NOAA, 2025). In indoor environments, its levels rise primarily due to human respiration and can easily exceed 1,000 ppm in poorly ventilated spaces (Persily; Jonge, 2017). A sedentary adult produces approximately 0.3 to 0.5 L/min of CO2, which can lead to indoor concentrations above 2,000 ppm in densely occupied settings such as classrooms, offices, and residential spaces without adequate ventilation (Dorizas et al., 2015; Fisk, 2017).
As mentioned in the introduction, although CO2 has low toxicity under typical occupancy conditions, it is widely used as an indirect indicator of ventilation efficiency, as its concentration reflects the balance between generation and removal through air exchange (Apte; Fisk; Daisey, 2000). High CO2 levels suggest insufficient ventilation and may correlate with the accumulation of other indoor pollutants, such as volatile organic compounds (VOCs) and particulate matter.
Experimental studies have shown that moderately elevated CO2 concentrations negatively affect cognitive performance and occupant well-being. Allen et al. (2016) reported significant reductions in cognitive task performance at 1,000 ppm compared to 600 ppm, with more pronounced declines observed at 2,500 ppm. These findings support the reference thresholds established by international standards, such as Standard 62.1 (ASHRAE, 2022), EN 16798-1 (ECS, 2019), and Brazilian standard NBR 17037 (ABNT, 2023a), which recommend maintaining indoor CO2 concentrations below 1,000 ppm.
CO2 is commonly employed as a proxy for estimating ventilation rates in occupied spaces, as its concentration reflects the dynamic balance between metabolic generation, outdoor air dilution, and infiltration (Emmerich; Persily, 2001). The steady-state CO2 concentration (Css) can be related to the per-person ventilation rate (Vp) according to the mass-balance equation (Equation 1):
Where Css is the steady-state indoor CO2 concentration (ppm), Cout is the outdoor CO2 concentration (approximately 420 ppm), G is the CO2 generation rate per person (L/h), and Vp is the ventilation rate per person (m³/h·person). This relationship forms the basis for demand-controlled ventilation (DCV) systems, in which air renewal rates are dynamically adjusted to maintain CO2 concentrations below predefined setpoints, typically between 800 and 1,000 ppm (Apte; Fisk; Daisey, 2000; Fisk; Almeida, 1998).
In SIH, where natural ventilation and high occupancy densities are common, CO2 monitoring represents a low-cost and effective tool for diagnosing ventilation deficiencies and informing design improvements, particularly regarding the sizing and placement of openings.
2.3 Fungal bioaerosols and hygrothermal performance
Fungi account for a significant proportion of indoor bioaerosols and are primarily dispersed through spores microscopic reproductive structures (1–30 μm) capable of remaining suspended in the air for extended periods (Reponen et al., 2001).
The most commonly detected fungal genera in indoor environments include Cladosporium, Penicillium, Aspergillus, Alternaria, and Aureobasidium (Kacprzak et al., 2022; Ilies et al., 2025). Microbiological surveys in schools, homes, and hospitals typically report concentrations ranging from 100 to 1,000 CFU/m³ (colony-forming units per cubic meter), with peaks above 5,000 CFU/m³ in environments with moisture issues or insufficient ventilation (Rao et al., 2007; Sautour et al., 2009).
Ventilation influences fungal growth primarily by regulating indoor relative humidity and removing airborne spores. In humid climates, excessive ventilation may introduce additional moisture, increasing indoor RH, whereas in dry climates, proper ventilation can reduce humidity from indoor sources such as breathing, cooking, and bathing (Hesaraki; Myhren; Holmberg, 2015).
In SIH, particularly those built with cast-in-place concrete walls, the risk of indoor humidity is elevated due to the low vapor permeability and high thermal inertia of the material. These properties promote surface condensation and create favorable conditions for fungal colonization, especially when ventilation is inadequate. Analyzing the hygrothermal performance of these wall systems, following the guidelines of CIB W040 (CIB, 2012), is essential to understanding the balance between heat transfer, moisture storage, and ventilation performance.
Brazilian studies have reinforced the relevance of this approach. Zanoni et al. (2020) and Dantas and Zanoni (2020) evaluated the impact of humidity on facade durability and thermal performance. Buligon (2021) and Pires (2020) analyzed surface condensation in various building systems, while Afonso (2018) and Nascimento (2016) examined mold growth and material degradation as a function of climate and construction characteristics. These investigations highlight the need to integrate ventilation, thermal performance, and moisture control to ensure healthy living conditions in low-income housing.
2.4 Ventilation and contaminant control
Ventilation is the primary mechanism for controlling gaseous and biological contaminants in indoor environments. Its effectiveness depends on both the air exchange rate and distribution efficiency, which determine the ability to dilute CO2 and remove suspended particles, including fungal spores (Etheridge; Sandberg, 1996).
National and international standards emphasize the importance of adequate ventilation to balance air quality, comfort, and energy efficiency. Brazilian standard NBR 17037 (ABNT, 2023a) and Annex 86 of the International Energy Agency (IEA) recommend maintaining CO2 concentrations below 800 – 1,000 ppm and relative humidity below 60 % to prevent fungal growth. Ventilation design and the sizing of openings should aim to achieve a balance between thermal comfort, health, and energy consumption, particularly in dwellings without mechanical air conditioning.
2.5 Integration of ventilation, CO2, and fungi in SIH
Although CO2 and fungi are distinct in nature, being a gaseous and a biological particulate contaminant, respectively, both are strongly influenced by ventilation conditions. The relationship between indoor CO2 concentrations and fungal load indirectly reflects ventilation performance and hygrothermal conditions. Field studies have shown that environments with high CO2 concentrations tend to exhibit elevated spore counts, indicating insufficient air exchange (Vornanen-Winqvist et al., 2018; Kacprzak et al., 2022). Interventions using hybrid ventilation systems have led to simultaneous reductions in CO2 and the elimination of pathogenic fungi such as Trichoderma citrinoviride, reinforcing the role of ventilation as a key strategy for integrated contaminant control.
However, increasing ventilation must be approached cautiously. In humid regions such as Pelotas (RS), introducing outdoor air may raise indoor humidity, thereby recreating conditions favorable to microbial growth. The challenge lies in defining ventilation rates that keep CO2 levels below 1,000 ppm and relative humidity under 60 %, while also ensuring comfort and energy efficiency. This integrated approach is essential for developing ventilation strategies that effectively reduce gas concentrations and prevent biological degradation in SIH buildings.
3 Method
3.1 Definition of the object of study
The case study corresponds to a real single-family social housing (SH) unit, located in a residential subdivision in the municipality of Pelotas, Rio Grande do Sul, and situated in Bioclimatic Zone 2R (BZ2R), according to NBR 15220-3 (ABNT, 2024), which defines the Brazilian bioclimatic zoning based on regional climatic characteristics and provides reference parameters for thermal performance analyses and computational simulations.
The external climatic conditions of Pelotas are classified as humid subtropical, characterized by high summer temperatures and a relatively homogeneous distribution of rainfall throughout the year. According to meteorological records from INMET (2026), the municipality presents an average annual air temperature of around 18 °C, associated with high average levels of relative humidity, exceeding 80%.
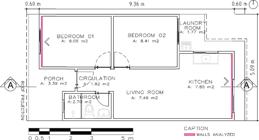
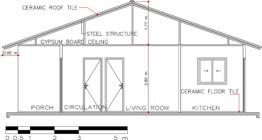
The single-story semi-detached house has a total floor area of 40.48 m² and a ceiling height of 2.80 m, comprising an integrated living/dining room, an integrated kitchen, two bedrooms, one bathroom, and an external service area. The walls analyzed in this study were the external walls of Bedroom 1 (BDRM.1), facing west (front façade), and of the living room/kitchen (LR/KIT), facing east (rear façade). Figure 1 presents the floor plan of the building, indicating the analyzed walls; Figure 2 shows the building section; and Figures 3a and 3b illustrate the front and rear façades, respectively.

The analyzed housing unit was selected for being part of the set of 12 social housing units evaluated by Duarte (2023) in the municipality of Pelotas/RS. The choice of this case study is based on its typological and constructive representativeness in relation to the social housing implemented in the city, especially those located in horizontal housing developments, as well as on the adoption of the cast-in-place concrete construction system, a technique that presents a recurrence of construction pathologies in the study region, including the development of fungi.
3.2 Characterization of the building envelope
The building was constructed using a cast-in-place concrete system, with internal and external acrylic plaster. The roof consists of ceramic tiles, an air layer, and plasterboard ceiling. The floor is finished with ceramic tiles over a screed layer, and openings are made of aluminum frames with 3 mm single glazing. The physical properties of the envelope materials were defined according to values provided in NBR 10456 (ABNT, 2022) and NBR 15220-2 (ABNT, 2005), and were consistently applied in both simulation tools, as presented in Table 1.
Regarding the hygrothermal properties of concrete, key parameters such as water vapor resistance factor, liquid water absorption coefficient, and sorption isotherms were derived from laboratory tests conducted by Beber et al. (2023), as shown in Table 2. The hygrothermal properties of the acrylic mass coating were defined according to the standard parameters recommended by WUFI-Pro 7.1. An additional diffusion resistance (sd-value) of 0.3 m was adopted.
3.3 Simulation of indoor environmental conditions and CO2 concentration using the EnergyPlus software
For the EnergyPlus simulations, the building geometry was modeled in SketchUp 2017 using the Euclid 0.9.4.4 plugin. The model was oriented along the east–west axis, as this orientation shows greater susceptibility to fungal development, as indicated by Duarte (2023).
The simulations were conducted considering Bioclimatic Zone 2R, as defined by NBR 15220-3 (ABNT, 2024), using the climate file for Pelotas (Leitzke et al., 2018). Internal heat and moisture gains were defined following the Preliminary Proposal of the ABNT Standard “Computational Simulation of the Hygrothermal Performance of Walls – Procedure” (ABNT, 2023b; Bernardes, 2024).
The model adopted use and occupancy parameters in accordance with NBR 15575-1 (ABNT, 2021), as well as natural ventilation, with an initial reference indoor temperature of 19 °C for the determination of indoor climate conditions. Subsequently, in order to assess the influence of window-opening schedules on indoor CO2 concentration, additional simulations were carried out with reference indoor temperatures of 21 °C, 23 °C, and 25 °C.
The selection of the setpoints of 21 °C, 23 °C, and 25 °C is based on normative references and on studies conducted under local climatic conditions. The values of 21 °C and 23 °C were adopted in accordance with NBR 15575-1 (ABNT, 2021), which establishes these temperatures as reference values for heating and cooling in the evaluation of the thermal performance of residential buildings. The 25 °C setpoint was included based on Martins et al. (2009), who identified this temperature as being associated with better thermal comfort conditions in housing units in the city of Pelotas.
Outdoor CO2 variation was based on monthly global estimates for 2023 provided by Lan, Tans and Thoning (2025), presented in Table 3.
Lan, Tans and Thoning (2025) provide monthly global average CO2 concentrations based on data collected over marine surfaces since 1979. These estimates are derived from air samples collected at locations where the samples are predominantly composed of well-mixed marine boundary layer (MBL) air and are considered representative of a large volume of the atmosphere (Global Monitoring Laboratory, 2025). These sampling sites are typically located in remote, sea-level regions under the influence of oceanic air masses (Global Monitoring Laboratory, 2025). Although the dataset specifically refers to marine surface conditions, its use in this study was considered appropriate, as typical outdoor CO2 concentrations generally range between 300 and 500 ppm (ASHRAE, 2010), consistent with the values presented in Table 4.
The output variables considered for the characterization of the indoor climate were indoor air temperature and relative humidity, expressed, respectively, in degrees Celsius (°C) and percentage (%), and requested on an hourly basis throughout the year. The output variable related to CO2 is expressed in parts per million (ppm) and was analyzed on an hourly and monthly basis over the year, adopting 1,000 ppm as the upper reference limit for indoor environments, based on the literature review presented in this study. The variables were analyzed on an hourly basis over one year.
The data generated by EnergyPlus were organized and processed in spreadsheets using Microsoft Excel software, enabling the analysis of results and the creation of graphs for better data visualization. Temperature and humidity information was transferred from the EnergyPlus output files to a specific WUFI Pro spreadsheet, which was used for the characterization and input of indoor climate conditions in the software.
3.4 Moisture modeling using WUFI-Pro and WUFI-Bio
For the second simulation, WUFI Pro 6.7 was used to analyze the hygrothermal performance of the building’s east and west façades, performing transient simulations of coupled heat and moisture transport in the building components, resulting in temperature and humidity data. The WUFI®-Bio module, integrated into WUFI-Pro, was then applied to estimate the risk of filamentous fungal growth on the surfaces, using the obtained hygrothermal results and comparing them with the critical limits for fungal growth defined for the materials. The construction system was modeled as shown in Figure 4.

The simulation covered a three-year period, with the final year used for analysis after moisture equilibrium was reached. Using the same climate file and indoor conditions obtained from EnergyPlus 9.6, with coupled heat and moisture transport configured. The analysis focused on the east and west facades, which represent the front and rear elevations of the building and are directly exposed to solar radiation. This configuration was essential to accurately reflect real-world solar exposure and thermal performance conditions.
In WUFI Pro 6.7, driving rain exposure was configured according to Standard 160 (ASHRAE, 2021), and simulations were performed on an hourly basis, allowing for precise adaptation to local climatic conditions.
The results of the simulations carried out in WUFI® Pro were organized and analyzed through the graphs generated by the platform itself, allowing a detailed evaluation of the hygrothermal behavior of the building envelope over the simulated period. Variations in temperature and humidity across the different wall layers could be visualized, assisting in the identification of critical performance conditions.
In addition, WUFI® Pro provides specific risk indicators used to assess the potential for surface condensation and filamentous fungal growth, based on the accumulation or dissipation of moisture in the materials throughout the seasons of the year. In this way, the software enables continuous monitoring of the wall’s hygrothermal performance and the prediction of possible moisture-related pathologies, such as persistent condensation and biological growth.
In the isopleth graphs used to assess the risk of fungal growth, the LIM B I and LIM B II curves represent critical limits of relative humidity and temperature, according to the Sedlbauer model. Conditions below the LIM B I curve indicate the absence of risk of fungal growth, even under prolonged exposure. When the simulations exceed the LIM B II curve, there is potential for fungal growth even in more resistant materials, indicating a high risk from both a hygrothermal performance and an indoor air quality perspective.
4 Results and discussion
4.1 Filamentous Fungi: condensation and hygrothermal behavior
Table 5 presents the results for the risk of filamentous fungi formation on the internal surface of the external walls in Bedroom 1 (west-facing, front facade) and the living room/kitchen (east-facing, rear facade), across the five simulated models. The results were evaluated based on the occurrence of threshold conditions established by Standard 160 (ASHRAE, 2021) and DIN 4108-8 (DIN, 2022).
Standard 160 (ASHRAE, 2021) defines fungal growth risk according to three criteria: relative humidity (RH) above 80% for 30 consecutive days; RH above 98% for 7 consecutive days; and a critical condition of RH at 100% for 24 hours. The DIN 4108-8 (DIN, 2022) standard considers the risk of fungal proliferation when RH reaches or exceeds 80% for at least 12 hours over five consecutive days.
Among the simulated scenarios, the model with a window-opening setpoint of 19 °C showed the lowest risk values. In this model, the 80% RH for 30 days criterion was triggered only 4 times in Bedroom 1 and 5 times in the living room/kitchen, while all other models showed six or more occurrences. According to the DIN 4108-8 (DIN, 2022) analysis for Bedroom 1, the 19 °C setpoint model recorded 44 occurrences of the critical RH condition, whereas the remaining models showed 49 or more occurrences.
The results clearly indicate that higher window-opening setpoints are associated with increased risk of filamentous fungi growth, with the worst-case scenario corresponding to the non-ventilated model. Lower setpoints led to more frequent window opening, allowing for greater air exchange and lower humidity accumulation in the interior spaces. The model with a 19 °C setpoint enabled longer periods of natural ventilation, reducing the frequency of high humidity conditions and, consequently, the potential for fungal proliferation.
Overall, the results indicate that increasing the window-opening temperature setpoint from 19 °C to 25 °C is associated with a progressive increase in the frequency of high relative humidity conditions at the interior surface of the external walls, thereby intensifying the risk of filamentous fungi growth. This behavior is consistent with findings reported by Hesaraki, Myhren and Holmberg (2015), who observed that reduced ventilation rates in humid climates tend to promote indoor moisture accumulation. In the present case, this response is further influenced by using cast-in-place concrete walls, which are characterized by high moisture storage capacity and low vapor permeability, as reported by Afonso (2018) and Duarte (2023). These material properties contribute to delayed moisture release, increasing the sensitivity of the indoor environment to reductions in ventilation frequency. Although the introduction of outdoor air in humid climates is commonly associated with increased indoor humidity, the results indicate that, for the climate of Pelotas (ZB 2R), the air exchange provided by natural ventilation was sufficient to reduce surface humidity peaks and fungal growth risk, particularly during periods of lower indoor temperatures.
To provide a detailed graphical analysis of the wall with the best performance according to Stqndard 160 (ASHRAE, 2021) and DIN 4108-8 (DIN, 2022) criteria, the following figures present the risk of surface condensation and filamentous fungi formation for the selected building typology and construction system. Figure 5 shows the temperature, relative humidity, and dew point temperature on the internal surface of the external wall over the final year of analysis, for both the Bedroom 1 (west-facing, front facade) (Figure 5a) and living room/kitchen (east-facing, rear facade) (Figure 5b).

In both solar orientations, a surface condensation risk is observed when the dew point temperature exceeds the surface temperature, particularly when accompanied by relative humidity levels above 80%. This behavior is evident during periods of lower surface temperatures, when the proximity between surface temperature and dew point increases the occurrence of surface condensation.
During the winter, the surface temperature (red line) drops significantly, frequently fluctuating between 13 °C and 22 °C. This period of lower temperatures coincides with an increase in relative humidity (blue line), which behaves inversely to temperature and often reaches values as high as 90%. The dew point temperature (purple line) remained below the surface temperature throughout most of the year, except during late winter and spring. In these months, the dew point occasionally surpassed the surface temperature, indicating potential surface condensation, especially on colder surfaces during the winter period when relative humidity exceeded 80%, as shown in the simulation outputs.
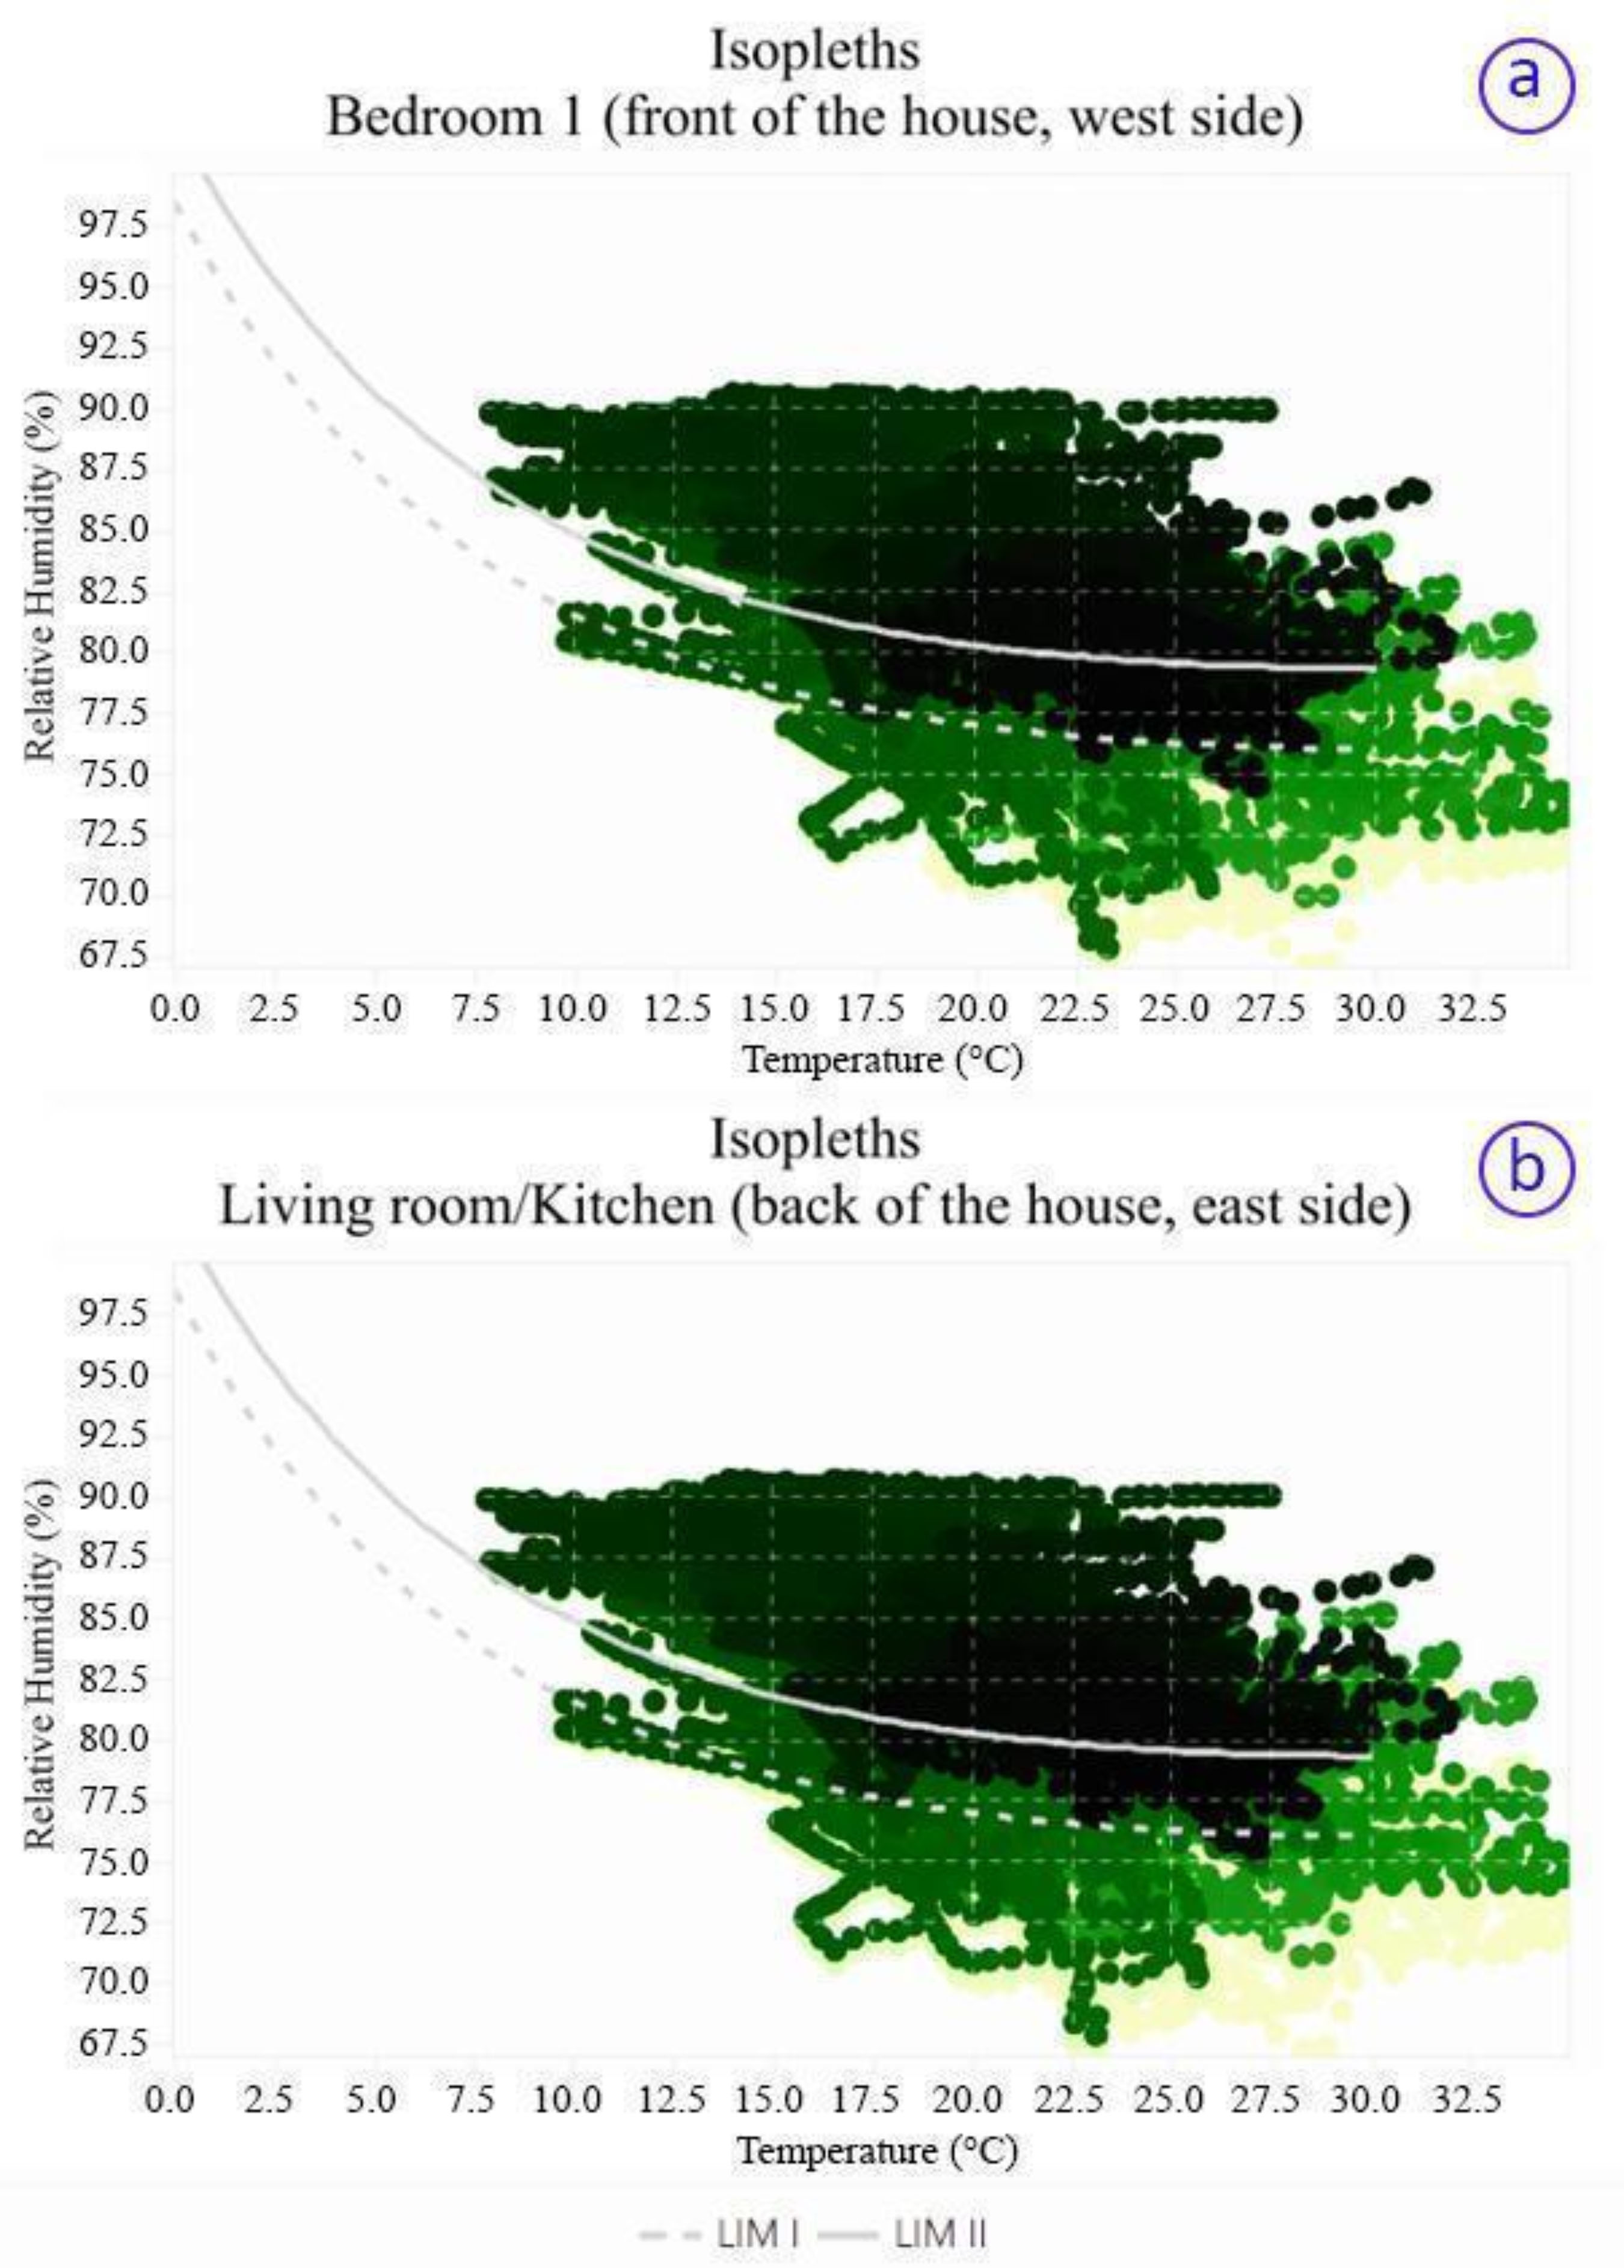
Figure 6 presents the isopleth diagrams illustrating the risk of filamentous fungi formation on the interior surface of the Bedroom 1 (west-facing) (Figure 6a) and living room/kitchen (east-facing) (Figure 6b) walls. According to Schmidt (2019), the limiting curves LIM B I and LIM B II define acceptable temperature and humidity thresholds for different types of building materials. Values exceeding these curves suggest conditions that may increase the likelihood of biological growth, surface or interstitial condensation, and, consequently, compromise the thermal performance and durability of building components.
Isopleth diagrams – Filamentous fungi formation on the west facade (front of the dwelling) and east facade (back of the dwelling)
The point clouds in the diagrams visualize the distribution of simulated surface conditions over time, with each point representing an hourly simulation output. The color scale indicates the progression over the simulation period: yellow points correspond to the beginning of the analysis (first year), green points indicate intermediate conditions, and black points represent the final year.
On the east facade (back of the dwelling), the concentration of data points approaching or exceeding the LIM B I and LIM B II threshold curves indicates a persistent exposure of the interior surface to combined temperature and humidity conditions favorable to filamentous fungi growth. This behavior is particularly associated with periods of elevated relative humidity combined with moderate surface temperatures, which are commonly identified in the literature as critical conditions for biological colonization (Schmidt, 2019; Afonso, 2018). Similar patterns were reported by Zanoni et al. (2020) and Buligon (2021), who observed that facade systems with higher moisture storage capacity tend to exhibit prolonged residence times within critical isopleth regions, even in the absence of continuous surface condensation.
On the west facade (front of the dwelling), a comparable tendency is observed, with a significant concentration of points exceeding the LIM B II curve, particularly within relative humidity ranges between 80% and 90%. This result is consistent with findings reported by Duarte (2023), who demonstrated that cast-in-place concrete wall systems in humid climates present an increased susceptibility to fungal growth due to delayed moisture release and high thermal inertia. In both orientations, the persistence of surface conditions within the critical isopleth zones highlights the combined influence of material properties, climatic exposure, and ventilation patterns on fungal growth risk.
Therefore, both facades, east and west, exhibit a significant risk of filamentous fungi formation. This underscores the need for facade design strategies that improve moisture management, including enhanced ventilation control, appropriate surface treatments, and construction systems with more favorable hygrothermal response, as also recommended in previous studies on low-income housing in humid climates such as Morishita et al. (2016) and Zanoni et al. (2020).
4.2 Carbon dioxide (CO2)
Figure 7 shows the monthly average indoor CO2 concentration in Bedroom 1 and the living room/kitchen throughout the year. The results clearly demonstrate the critical role of natural ventilation in reducing indoor CO2 levels. The model without window opening exhibited significantly higher concentrations compared to the ventilated scenarios. However, even in the models with natural ventilation, the threshold of 1,000 ppm established by NBR 17037 (ABNT, 2023a) was exceeded during the colder months (May to August), when external temperatures were lower and window opening is typically reduced. It is also noteworthy that the CO2 concentration profiles for Bedroom 1 and the living room/kitchen are similar, with no substantial differences observed between the two spaces. These results highlight that ventilation is the determining factor in controlling CO2 accumulation, particularly during winter, when reliance on natural air exchange tends to decrease.

Average Carbon Dioxide (CO2) concentration in Bedroom 1 and Living Room/Kitchen over one year
Table 6 presents the annual number of hours in which indoor CO2 concentrations in Bedroom 1 (west-facing facade) and the living room/kitchen (east-facing facade) exceeded thresholds of 1,000, 2,000, 3,000, 4,000, and 5,000 ppm. These results are shown as a function of the window-opening temperature setpoints (19, 21, 23, and 25 °C) and a scenario without natural ventilation.
In the absence of natural ventilation, CO2 concentration exceeded the maximum limit of 1,000 ppm, as defined by NBR 17037 (ABNT, 2023a), for nearly the entire year in both rooms. The number of hours in which CO2 levels remained below 1,000 ppm progressively decreased as the window-opening setpoint increased, that is, as the duration of ventilation was reduced.
Even with a setpoint of 19 °C, the 1,000 ppm threshold was exceeded for approximately 30% of the year in both indoor environments. Furthermore, much of this period coincided with the occupancy of the dwelling, particularly during night time hours, when lower outdoor temperatures are more common and window opening is less likely to occur.
The issue of higher CO2 concentration during night time hours is further illustrated in Figure 8 and Figure 9, which show the average variation in indoor CO2 concentration in Bedroom 1 and the living room/kitchen during the winter solstice (June 21) and summer solstice (December 21), respectively. In both figures, the outdoor temperature (dashed line) is shown on the right-hand axis. It is observed that, between 12AM and 6AM, even during summer solstice the CO2 concentration overtakes 1,000 ppm. This result is similar to those presented in the work from Huang et al. (2020), where the authors found an average of 1448 ppm in the 93 studied bedrooms. Those bedrooms were from residential buildings located in Shanghai and the measures were taken during the night (between midnight and 6 am) when doors and windows were closed.

Average Carbon Dioxide (CO2) concentration in Bedroom 1 and Living Room/Kitchen during the winter solstice (June 21)

Average Carbon Dioxide (CO2) concentration in Bedroom 1 and Living Room/Kitchen during the summer solstice (December 21)
During the winter solstice, between 1:00 AM and 8:00 AM, a drop in outdoor temperature is accompanied by a noticeable increase in indoor CO2 concentrations. As the temperature rises after 8:00 AM, CO2 levels begin to decrease. Nevertheless, the recorded concentrations during this period remain above 3,000 ppm, indicating a significant reduction in air renewal during the colder hours of the day.
During the summer period, all models with natural ventilation maintained CO2 concentrations well below 1,000 ppm, except for the non-ventilated scenario. This behavior is attributed to outdoor temperatures remaining above 19 °C for most of the day, allowing for more frequent window opening. Among the ventilated models, the greatest variation in CO2 concentration was observed in the setpoint 25 °C scenario, which showed a peak in the concentration curve around 7:00 AM.
5 Conclusions
This study aimed to evaluate the hygrothermal performance and indoor air quality (IAQ) of a Social Interest Housing (SIH) unit located in Pelotas, Brazil (Bioclimatic Zone 2R), constructed with cast-in-place concrete walls. The research specifically investigated the risk of filamentous fungi formation and the accumulation of carbon dioxide (CO2) under varying ventilation conditions and window-opening temperature setpoints, using dynamic simulation tools.
The findings revealed that both fungal growth risk and indoor CO2 concentrations worsened with increased temperature setpoints, from 19 °C to 25 °C (due to the increased time that windows are left open), and were most critical under non-ventilated conditions. Models with lower setpoints led to fewer instances of high humidity and CO2 accumulation, highlighting the benefits of more frequent natural ventilation. However, even in the most favorable scenario (19 °C), the results indicated conditions that exceeded the thresholds recommended by ASHRAE and NBR 17037, posing potential health risks to occupants due to poor indoor air quality. The isopleth analysis further indicates that this risk is primarily associated with the recurrent exposure of interior surfaces to critical hygrothermal conditions, rather than isolated extreme events.
The external walls, particularly in the selected east and west facades, showed high susceptibility to moisture retention and inadequate air renewal, emphasizing the need for design interventions. To mitigate these risks, it is essential to adopt construction systems and surface treatments that combine lower moisture storage capacity, adequate vapor diffusion control, and effective natural or mechanical ventilation. Additionally, continuous visual monitoring of critical surfaces is recommended in order to verify possible appearance of mold or moisture points.
In this context, by integrating hygrothermal simulation, isopleth-based fungal risk assessment, and CO2 analysis, this study contributes to a more comprehensive evaluation of indoor environmental quality in Social Interest Housing (SIH), highlighting the limitations of relying solely on ventilation strategies in humid climates.
Although the analysis was conducted for a specific housing typology, the adopted construction system, climatic conditions, and occupancy patterns are representative of Social Interest Housing (SIH) located in Brazilian Bioclimatic Zone 2R. These results contribute to a better understanding of how building envelope characteristics, local climate, and occupant behavior interact to affect IAQ and durability in SIH. They also provide technical guidance for selecting construction systems and materials in humid regions, supporting efforts to minimize moisture-related pathologies and promote healthier, more efficient residential environments. Future work could involve on-site measurements of CO2 concentration and humidity for comparison with the simulation results, providing validation of the model and supporting more robust subsequent studies.
-
Declaration of Generative AI and AI-Assisted Technologies in the Writing Process
The authors used OpenAI's ChatGPT (version 4.5) in November 2024 to assist with language editing, grammar correction, and text organization. All AI-assisted content was subsequently reviewed and revised by the authors, who take full responsibility for the accuracy, originality, and integrity of the manuscript.
-
Financial Support
This study was financed in part by the Coordenação de Aperfeiçoamento de Pessoal de Nível Superior - Brasil (CAPES) - Finance Code 001.
-
BEBER, L. A.; FRANZ, L. A. dos S.; DUARTE, C. de M.; BERNARDES, L. C.; MELLER, G.; ZIEBELL, C. S.; SILVA, A. C. S. B. da; CUNHA, E. G. da; MENDES, N. Integrated analysis of hygrothermal performance, CO2 concentration, and occurrence of filamentous fungi in SIH in ZB2R. Ambiente Construído, Porto Alegre, v. 26, e151636, jan./dez. 2026. ISSN 1678-8621 Associação Nacional de Tecnologia do Ambiente Construído. http://dx.doi.org/10.1590/s1678-86212026000100996
Data Availability Statement
Data available on request.
References
- AFONSO, T. M. Desempenho higrotérmico de edificações e procedimentos para previsão de ocorrência de bolores em ambientes internos: estudo de caso em habitações construídas com paredes de concreto. Master (Engenharia Civil) - Departamento de Tecnologia em Construção de Edifícios, Instituto de Pesquisas Tecnológicas, São Paulo, 2018.
- ALLEN, J. G. et al. Associations of cognitive function scores with carbon dioxide, ventilation, and volatile organic compound exposures in office workers: a controlled exposure study of green and conventional office environments. Environmental Health Perspectives, v. 124, n. 6, p. 805-812, jun. 2016.
- AMERICAN SOCIETY OF HEATING, REFRIGERATING AND AIR-CONDITIONING ENGINEERS. Standard 62.1: ventilation for acceptable indoor air quality. Atlanta, 2010.
- AMERICAN SOCIETY OF HEATING, REFRIGERATING AND AIR-CONDITIONING ENGINEERS. Standard 160: criterie for moisture: control design analysis in buildings. Atlanta, 2021.
- AMERICAN SOCIETY OF HEATING, REFRIGERATING AND AIR-CONDITIONING ENGINEERS. Standard 62.1: ventilation and acceptable indoor air quality. Atlanta, 2022.
- APTE, M. G.; FISK, W. J.; DAISEY, J. M. Associations between indoor CO2 concentrations and sick building syndrome symptoms in U.S. office buildings: an analysis of the 1994-1996 base study data. Indoor Air, v. 10, n. 4, p. 246-257, dez. 2000.
- ASSOCIAÇÃO BRASILEIRA DE NORMAS TÉCNICAS. NBR 10456: materiais e produtos de construção: propriedades higrotérmicas: valores e procedimentos de projeto tabulados para determinar valores térmicos declarados e de projeto. Rio de Janeiro, 2022.
- ASSOCIAÇÃO BRASILEIRA DE NORMAS TÉCNICAS. NBR 15220-2: desempenho térmico de edificações. parte 2: componentes e elementos construtivos das edificações: resistência e transmitância térmica. Rio de Janeiro, 2005.
- ASSOCIAÇÃO BRASILEIRA DE NORMAS TÉCNICAS. NBR 15220-3: desempenho térmico de edificações: parte 3: zoneamento bioclimático por desempenho. Rio de Janeiro, 2024.
- ASSOCIAÇÃO BRASILEIRA DE NORMAS TÉCNICAS. NBR 15575-1: edificações habitacionais: desempenho: parte 1: requisitos gerais. Rio de Janeiro, 2021.
- ASSOCIAÇÃO BRASILEIRA DE NORMAS TÉCNICAS. NBR 17037: qualidade do ar interior em ambientes não residenciais climatizados artificialmente: padrões referenciais. Rio de Janeiro, 2023a.
- ASSOCIAÇÃO BRASILEIRA DE NORMAS TÉCNICAS. Rascunho do projeto de norma ABNT: simulação computacional do comportamento higrotérmico de paredes: procedimento. Rio de Janeiro, 2023b.
- BEBER, L. A. et al. Desempenho térmico de uma HIS no sul do país: analisando a transferência de calor e o transporte de umidade. In: CONGRESSO LATINO-AMERICANO DE SIMULAÇÃO DE EDIFÍCIOS, 7., Florianópolis, 2023. Anais [...] Florianópolis: IBPSA Latam, 2023.
- BERNARDES, L. C. Impacto da variação das condições de contorno no projeto de norma ABNT de simulação de transporte de umidade Mester (Arquitetura e Urbanismo) - Programa de Pós-Graduação em Arquitetura e Urbanismo, Universidade Federal de Pelotas. Pelotas, 2024.
- BULIGON, L. B. Comportamento higrotérmico e energético de painéis de vedação vertical externa em madeira para a Zona Bioclimática 2 Santa Maria, 2021. 145 f. Master (Engenharia Civil) - Programa de Pós-Graduação em Engenharia Civil, Universidade Federal de Santa Maria, Santa Maria, 2021.
- DANTAS, A. L. de F.; ZANONI, V. A. G. simulação computacional e medições in loco: um estudo do desempenho higrotérmico em um edifício alto em Brasília. In: CONGRESSO BRASILEIRO DE PATOLOGIA DAS CONSTRUÇÕES, 4., Fortaleza, 2020. Anais [...] Fortaleza, 2020.
- DESPRÉS, V. R. Primary biological aerosol particles in the atmosphere: a review. Tellus B: Chemical and Physical Meteorology, Stockholm, v. 64, p. 1-58, jan. 2012.
- DEUTSHCHES INSTITUT FÜR NORMUNG. DIN 4108-8: Wärmeschutz und Energie-Einsparung in Gebäuden: Teil 8: Vermeidung von Schimmelwachstum in Wohngebäuden. Berlin, 2022.
- DORIZAS, P. V. et al. An integrated evaluation study of the ventilation rate, the exposure and the indoor air quality in naturally ventilated classrooms in the Mediterranean region during spring. Science of The Total Environment, v. 502, p. 557–570, 2015.
- DUARTE, C. M. Simulação do comportamento higrotérmico de habitações de interesse social: análise do risco de fungos filamentosos. Pelotas, 2023. 194 f. Master (Arquitetura e Urbanismo) — Programa de Pós-Graduação em Arquitetura e Urbanismo, Universidade Federal de Pelotas, Pelotas, 2023.
-
EMMERICH, S. J.; PERSILY, A. K. State-of-the-art review of CO₂ demand controlled ventilation technology and application NISTIR 6729. Gaithersburg: National Institute of Standards and Technology, 2001. Available: https://tsapps.nist.gov/publication/get_pdf.cfm?pub_id=860846 Acess: 5 nov. 2025.
» https://tsapps.nist.gov/publication/get_pdf.cfm?pub_id=860846 - ETHERIDGE, D. W.; SANDBERG, M. Building ventilation: theory and measurement. Chichester: John Wiley & Sons, 1996.
- EUROPEAN COMMITTEE FOR STANDARDIZATION. EN 16798-1: energy performance of buildings: ventilation of buildings: part 1: Indoor environmental input parameters for design and assessment of energy performance of buildings addressing indoor air quality, thermal environment, lighting and acoustics. Brussels, 2019.
- FISK, W. J. The ventilation problem in schools: literature review. Indoor Air, v. 27, n. 6, p. 1039-1051, jul. 2017.
- FISK, W. J.; ALMEIDA, A. T. de. Sensor-based demand-controlled ventilation: a review. Energy and Buildings, v. 29, n. 1, p. 35-45, dez. 1998.
-
GLOBAL MONITORING LABORATORY. NOAA/GML calculation of global means Available: https://gml.noaa.gov/ccgg/about/global_means.html Access: 22 jan. 2025.
» https://gml.noaa.gov/ccgg/about/global_means.html - GUERRA, F. L. et al. Análise das condições favoráveis à formação de bolor em edificação histórica de Pelotas, RS, Brasil. Ambiente Construído, Porto Alegre, v. 12, n. 4, p. 7–23, out./dez. 2012.
- HESARAKI, A.; MYHREN, J. A.; HOLMBERG, S. Influence of different ventilation levels on indoor air quality and energy savings: a case study of a single-family house. Sustainable Cities and Society, v. 19, p. 165–172, 2015.
- HUANG, C. et al Association between nighttime air infiltration of bedroom and characteristics of residential building in Shanghai. In: INTERNATIONAL CONFERENCE ON ENERGY, ENVIRONMENT AND EARTH SCIENCES, Singapore, 2020. Proceedings [...] Singapore: Springer, 2020.
- ILIES, A. B. et al. Integrated analysis of indoor air quality and fungal microbiota in educational heritage buildings: implications for health and sustainability. Sustainability, v. 17, n. 3, p. 1091, jan. 2025.
-
INSTITUTO NACIONAL DE METEOROLOGIA. Normais climatológicas do Brasil Available: https://portal.inmet.gov.br/normais#. Access: 08 Jan. 2026.
» https://portal.inmet.gov.br/normais - JONES, A. P. Indoor air quality and health. Atmospheric Environment, v. 33, n. 28, p. 4535-4564, dez. 1999.
- KACPRZAK, M. et al. Cycles of carbon, nitrogen and phosphorus in poultry manure management technologies: environmental aspects. Critical Reviews in Environmental Science and Technology, v. 53, n. 8, p. 914-938, jul. 2022.
- KLEPEIS, N. et al. The National Human Activity Pattern Survey (NHAPS): a resource for assessing exposure to environmental pollutants. Journal of Exposure Science and Environmental Epidemiology, v. 11, n. 3, p. 231-252, jul. 2001.
- LAN, X.; TANS, P.; THONING, K. W. Trends in globally-averaged CO₂ determined from NOAA Global Monitoring Laboratory measurements. Version 2025-01. Boulder: NOAA Global Monitoring Laboratory, 2025.
- LEITZKE, R. K. et al. Optimization of the Traditional Method for Creating a Weather Simulation File: The Pelotas.epw Case. Journal of Civil Engineering and Architecture, v. 12, n. 10, 2018.
- MARTINS, D. J. et al Ensaio sobre a utilização da automação de aberturas na simulação do desempenho térmico de edificações. In: ENCONTRO NACIONAL, 10.; ENCONTRO LATINO-AMERICANO DE CONFORTO NO AMBIENTE CONSTRUÍDO, 6., Natal, 2009. Anais […] Natal: ENTAC, 2009.
- MORISHITA, et al. Issues about moisture in residential buildings of Brazil. In: CIB World Building Congress 2016, 20., Tampere, 2016. Proceedings […] Tampere: Tampere University of Technology, 2016.
- MORISHITA, C. On the assessment of potential moisture risks in residential buildings across Brazil Thesis - Programa de Pós-Graduação em Engenharia Mecânica, Pontifícia Universidade Católica do Paraná, Curitiba, 2020.
- NASCIMENTO, M. L. M. Aplicação da simulação higrotérmica na investigação da degradação de fachadas de edifícios 2016. xxi, 173 f., il. Master (Engenharia Civil) - Universidade de Brasília, Brasília, 2016.
-
NATIONAL OCEANIC AND ATMOSPHERIC ADMINISTRATION. Global monitoring laboratory: trends in atmospheric carbon dioxide. 2025. Available: https://gml.noaa.gov/webdata/ccgg/trends/co2/co2_mm_gl.txt Access: 27 out. 2025.
» https://gml.noaa.gov/webdata/ccgg/trends/co2/co2_mm_gl.txt - NAZAROFF, W. W. Four principles for achieving good indoor air quality. Indoor Air, v. 23, n. 5, p. 353-356, 13 set. 2013.
- PERSILY, A.; JONGE, L. de. Carbon dioxide generation rates for building occupants. Indoor Air, v. 27, n. 5, p. 868-879, abr. 2017.
- PIRES, J. R. Estimativa da condensação em edificações unifamiliares em território brasileiro: simulação higrotérmica computacional. Theis (Engenharia Civil) - Universidade do Vale do Rio dos Sinos, São Leopoldo, 2020.
- RADU, A. et al. CIB W040: heat, air and moisture transfer terminology, parameters and concepts. Porto: FEUP Edições, 2012. (CIB Publication, n. 369).
- RAO, C. Y. et al Characterization of airborne molds, endotoxins, and glucans in homes in new orleans after hurricanes Katrina and Rita. Applied and Environmental Microbiology, v. 73, n. 5, p. 1630-1634, mar. 2007.
- REDLICH, C.e A.; SPARER, J.; CULLEN, M. R. Sick-building syndrome. The Lancet, v. 349, n. 9057, p. 1013-1016, abr. 1997.
- REPONEN, T. et al. Aerodynamic versus physical size of spores: measurement and implication for respiratory deposition. Grana, v. 40, n. 3, p. 119-125, jan. 2001.
- SATISH, U. et al. Is CO2 an indoor pollutant? Direct effects of low-to-moderate CO2 concentrations on human decision-making performance. Environmental Health Perspectives, v. 120, n. 12, p. 1671-1677, dez. 2012.
- SAUTOUR, M. et al. Profiles and seasonal distribution of airborne fungi in indoor and outdoor environments at a French hospital. Science of the Total Environment, v. 407, n. 12, p. 3766-3771, jun. 2009.
-
SCHMIDT, T. On-line Help for WUFI Pro. Stuttgart: Fraunhofer Institute for Building Physics, 2019. Available: wufi.de Access: 28 Sep. 2025.
» wufi.de - SUNDELL, J. Reflections on the history of indoor air science, focusing on the last 50 years. Indoor Air, v. 27, n. 4, p. 708-724, fev. 2017.
- VON EYE, F. et al. Quantificação da ação do clima na degradação de fachadas em argamassa empregando a simulação higrotérmica. In: SIMPÓSIO BRASILEIRO DE TECNOLOGIA DAS ARGAMASSAS, 12., São Paulo, 2017. Anais [...] São Paulo, 2017.
- VORNANEN-WINQVIST, C. et al. Effects of ventilation improvement on measured and perceived indoor air quality in a school building with a hybrid ventilation system. International Journal of Environmental Research and Public Health, v. 15, n. 7, p. 1414, jul. 2018.
- WARGOCKI, P.; WYON, D. P. Ten questions concerning thermal and indoor air quality effects on the performance of office work and schoolwork. Building and Environment, v. 112, p. 359-366, fev. 2017.
-
WORLD HEALTH ORGANIZATION. Household air pollution and health. Geneva: WHO, 2025. Available: https://www.who.int/news-room/fact-sheets/detail/household-air-pollution-and-health Access: 8 Jan. 2026.
» https://www.who.int/news-room/fact-sheets/detail/household-air-pollution-and-health - ZANONI, V. A. G. et al Estudo higrotérmico na autoconstrução: simulação computacional e medições em campo. Ambiente Construído, Porto Alegre, v. 20, n. 3, p. 109–120, jul./set.2020.
- ZANONI, V. A. G. Influência dos agentes climáticos de degradação no comportamento higrotérmico de fachadas em Brasília Thesis (Arquitetura e Urbanismo) - Universidade de Brasília, Brasília, 2015.
Edited by
-
Editor-in-chief:
Enedir Ghisi

 Source:
 Source: Own elaboration (2026).
 Source: extracted from WUFI Pro 6.7 simulation and adapted by the authors (2025).