Determining the load-bearing capacity of the layers in 3D printing mortars
Abstract
This research aims to assess the sensitivity and repeatability of the Unconfined Uniaxial Compressive Test (UUCT) for characterizing fresh mortars used in 3D printing. Based on the test results, load-bearing capacity was simulated under practical conditions to determine the maximum printable height as a function of different levels of layer deformation. The experimental program included six mortar formulations with variations in the water/binder ratio and sand content. The mixtures were tested for axial compressive strength at four hydration times (15, 30, 60, and 90 minutes), resulting in 24 experimental conditions. Method repeatability was verified using 12 replicates of a single condition. The results demonstrated that the UUCT is sensitive to behavioral differences among mortars, with adequate accuracy and repeatability, achieving a coefficient of variation of 6%. Simulations indicated that the mortars supported deformations ranging from 10% to 24%, corresponding to maximum printable heights between 0.63 and 1.67 m. Therefore, the UUCT proved to be an effective tool not only for mortar characterization but also for planning and predicting on-site behavior in real-scale 3D printing applications.
Keywords
3D printing; Mortar; Fresh state; UUCT; Compressive strength
Resumo
Esta pesquisa visa avaliar a sensibilidade e a repetibilidade do método Unconfined Uniaxial Compressive Test (UUCT) na caracterização de argamassas para impressão 3D ainda no estado fresco e, a partir dos resultados, realizar uma simulação da capacidade de carga em aplicação prática, determinando a altura máxima de impressão em função de diferentes níveis de deformação das camadas. O programa experimental contemplou seis formulações de argamassa, variando a relação água/ligante e o teor de areia. As misturas foram submetidas a ensaios de resistência à compressão axial em quatro idades (15, 30, 60 e 90 minutos), totalizando 24 condições de análise. A repetibilidade do método foi verificada a partir de 12 réplicas de uma mesma condição experimental. Os resultados indicaram que o UUCT é sensível às diferenças de comportamento entre as argamassas analisadas, apresentando adequada acurácia e repetibilidade, com coeficiente de variação de 6%. As simulações mostraram que as argamassas suportaram deformações entre 10% e 24%, correspondendo a alturas de impressão entre 0,63 e 1,67 m. Dessa forma, o método UUCT demonstrou-se uma ferramenta eficaz tanto para a caracterização de argamassas quanto para o planejamento e a previsão do comportamento em aplicações reais de impressão 3D em obra.
Palavras-chave
Impressão 3D; Argamassa; Estado fresco; UUCT; Resistência à compressão
1 Introduction
The 3D mortar printing, also known as additive construction with cementitious materials, could be the most promising and effective alternative for industrializing civil construction. Increasingly addressed in research, this construction technique has been employed in several countries (Cai et al., 2024; Hosseeini et al., 2019; Panda; Tan, 2019). It can use an automated method to produce parts and walls with complex shapes, layer by layer.
This construction technology is a long and complex process that involves mixing and applying the material, including the pumping, extrusion, and stacking of the layers, which requires the fresh mortar to have specific properties, such as cohesion and resistance to segregation and exudation. After printing the mortar, while still in the fresh state, the material must have good shape stability due to the absence of a formwork system (lateral containment). As subsequent layers are deposited on the non-hardened extrusion bed, the mortar, not stiff yet, must support the increasing load of each printing cycle (Mohan et al., 2021).
The load-bearing capacity ensures that the lower layers can resist the weight of the overlying layers without excessive deformations to permit the printing process to continue. The Unconfined Uniaxial Compressive Test (UUCT) is a method to quantify the load-bearing capacity of the mortar and its evolution during the first ages (15 minutes to 1.5 hours). In this test, an unconfined sample of mortar in the fresh state is subjected to an axial compression loading. Thus, this method, which was adapted from a test for unconfined compressive strength of cohesive soil based on D2166 (ASTM, 2013), has been used to characterize 3D printing mortars (Zafar et al., 2025; Jia et al., 2025; Pott et al., 2023a; Tao et al., 2023; Wolfs; Bos; Salet, 2018).
Thus, the present research aims to analyze the sensitivity and repeatability of the UUCT method to evaluate the load-bearing capacity of different mortars for 3D printing, as well as to simulate load-bearing capacity calculation in a full-scale printing, by calculating the printing height as a function of varying deformation levels of the printed layers. This research is part of the increasing adoption of 3D printing in civil construction and could increase knowledge and strengthen 3D printing as a sustainable and industrialized alternative in the sector.
2 Theoretical framework
The industrialization process of civil construction seeks alternatives that provide greater safety, lower cost, architectural freedom, and time reduction. Different materials and techniques have already been developed for 3D printing in construction, presenting three basic classifications: Contour Crafting, D-shape, and 3D Concrete Printing (3DCP). Among these, 3DCP is the most widely used method in both research and practice. The elimination of formwork in this technique enables faster construction and significantly reduces material consumption and labor requirements (Zhang et al., 2025; Jaji et al., 2025; Shobajo, 2020; Buswell et al., 2018). In the 3DCP construction process, the properties of the mortar in its fresh state are decisive for obtaining high-quality parts. To ensure adequate workability, it is essential to carefully define the components and their respective proportions, combined with the study of the mixture's rheological behavior.
The mortar intended for additive manufacturing must exhibit properties compatible with all stages of the printing process, ensuring good performance from pumping to layer deposition. At the end of the process, the material must retain its homogeneity without compromising its structural integrity. In this context, thixotropy and yield stress are essential rheological properties for evaluating 3D printing mortars, with the reactive nature of cement adding complexity to the analysis (Khan, 2020; Kruger; Zeranka; Van Zijl, 2019; Roussel, 2006).
3 Thixotropy and yield stress of mortar for 3D printing
The fluidity of the mortar and the buildability of the layers in 3D printing stem from the material's thixotropic behavior (Khan, 2020). Thixotropy is the result of a flocculation and deflocculation process, which varies depending on whether the mortar is at rest or subjected to flow (Douba; Kawashima, 2021). During the rest period, the internal structuration intensifies with the dormant time. However, when the shear stress level is exceeded, deflocculation occurs, resulting in a more fluid mortar. This physical phenomenon, characteristic of thixotropy, is fully reversible (Roussel, 2006; Khan, 2020).
Through magnetic resonance imaging, it was verified that the reversible process predominates in the initial stages of cement hydration, up to approximately thirty minutes (Jarny et al., 2005). Within this interval, according to Roussel (2006), irreversible effects can be disregarded. However, at times exceeding this limit, changes in the mortar's behavior are attributed to the evolution of hydration products, thus being characterized as irreversible. According to Ma and Kawashima (2020), colloidal flocculation and C-S-H nucleation are responsible for the increase in interparticle interaction forces. This structuration process occurs when the cement paste remains at rest.
Roussel (2006) considers a thixotropic material to exhibit flocculation on the scale of minutes and deflocculation on the scale of seconds, at a shear rate varying from 1 to 10 s-1. Thus, when used in 3DCP, thixotropic fluids can be properly extruded through the printing nozzle and maintain the layer's shape, even after the deposition of several extrusion beds (Panda; Tan, 2019).
In a review conducted by Biricik and Mardani (2022), the authors found that, in general, the thixotropy of pastes and mortars increases with the addition of silica fume, blast-furnace slag, clay, calcined clay, viscosity-modifying admixtures, and cements with higher fineness. Conversely, the addition of fly ash, limestone powder, and water-reducing admixtures, along with an increase in the water-to-binder ratio, can reduce the thixotropy of cementitious systems.
In materials such as mortars used in 3D printing, exceeding the critical shear stress limit is not sufficient for the material to continue flowing. In addition to needing to overcome the static yield stress to initiate movement, the shear stress must remain above the dynamic yield stress for the flow to continue (Kruger; Zeranka; Van Zijl, 2019; Khan, 2020).
A low yield stress facilitates the pumping process but hinders 3D buildability, i.e., the stacking of layers (Khan, 2020). The shear stresses applied to cementitious materials must be kept at levels below the yield stress for the printed layer to remain at rest, so that it can support the increase in shear stress from subsequent extrusion beds. Cementitious materials exhibit an increase in yield stress over time, driven by structural build-up and the cement hydration process, thereby allowing the printed layer's shape to be maintained (Khan, 2020; Mechtcherine; Nerella, 2019).
The static yield stress is attributed to the material when it is at rest, while the dynamic yield stress is conferred to the fluid in motion. The difference between these two yield stresses represents the thixotropic behavior (Figure 1). This property of thixotropy is significant for extrusion-based 3D printing (Kruger; Zeranka; Van Zijl, 2019).

Evolution from static yield stress to dynamic yield stress (Kruger; Zeranka; Van Zijl, 2019)
Buildability is related to the structural build-up stage of the mortar; this property allows the lower layers to support the weight of subsequent layers without exhibiting large deformations or resulting in the collapse of the wall, as shown in Figure 2 (Zhang et al., 2025; Chang et al., 2023; Chen et al., 2020b).

Excessive deformation of the lower mortar layers after printing, showing poor printability (Chen et al., 2020b)
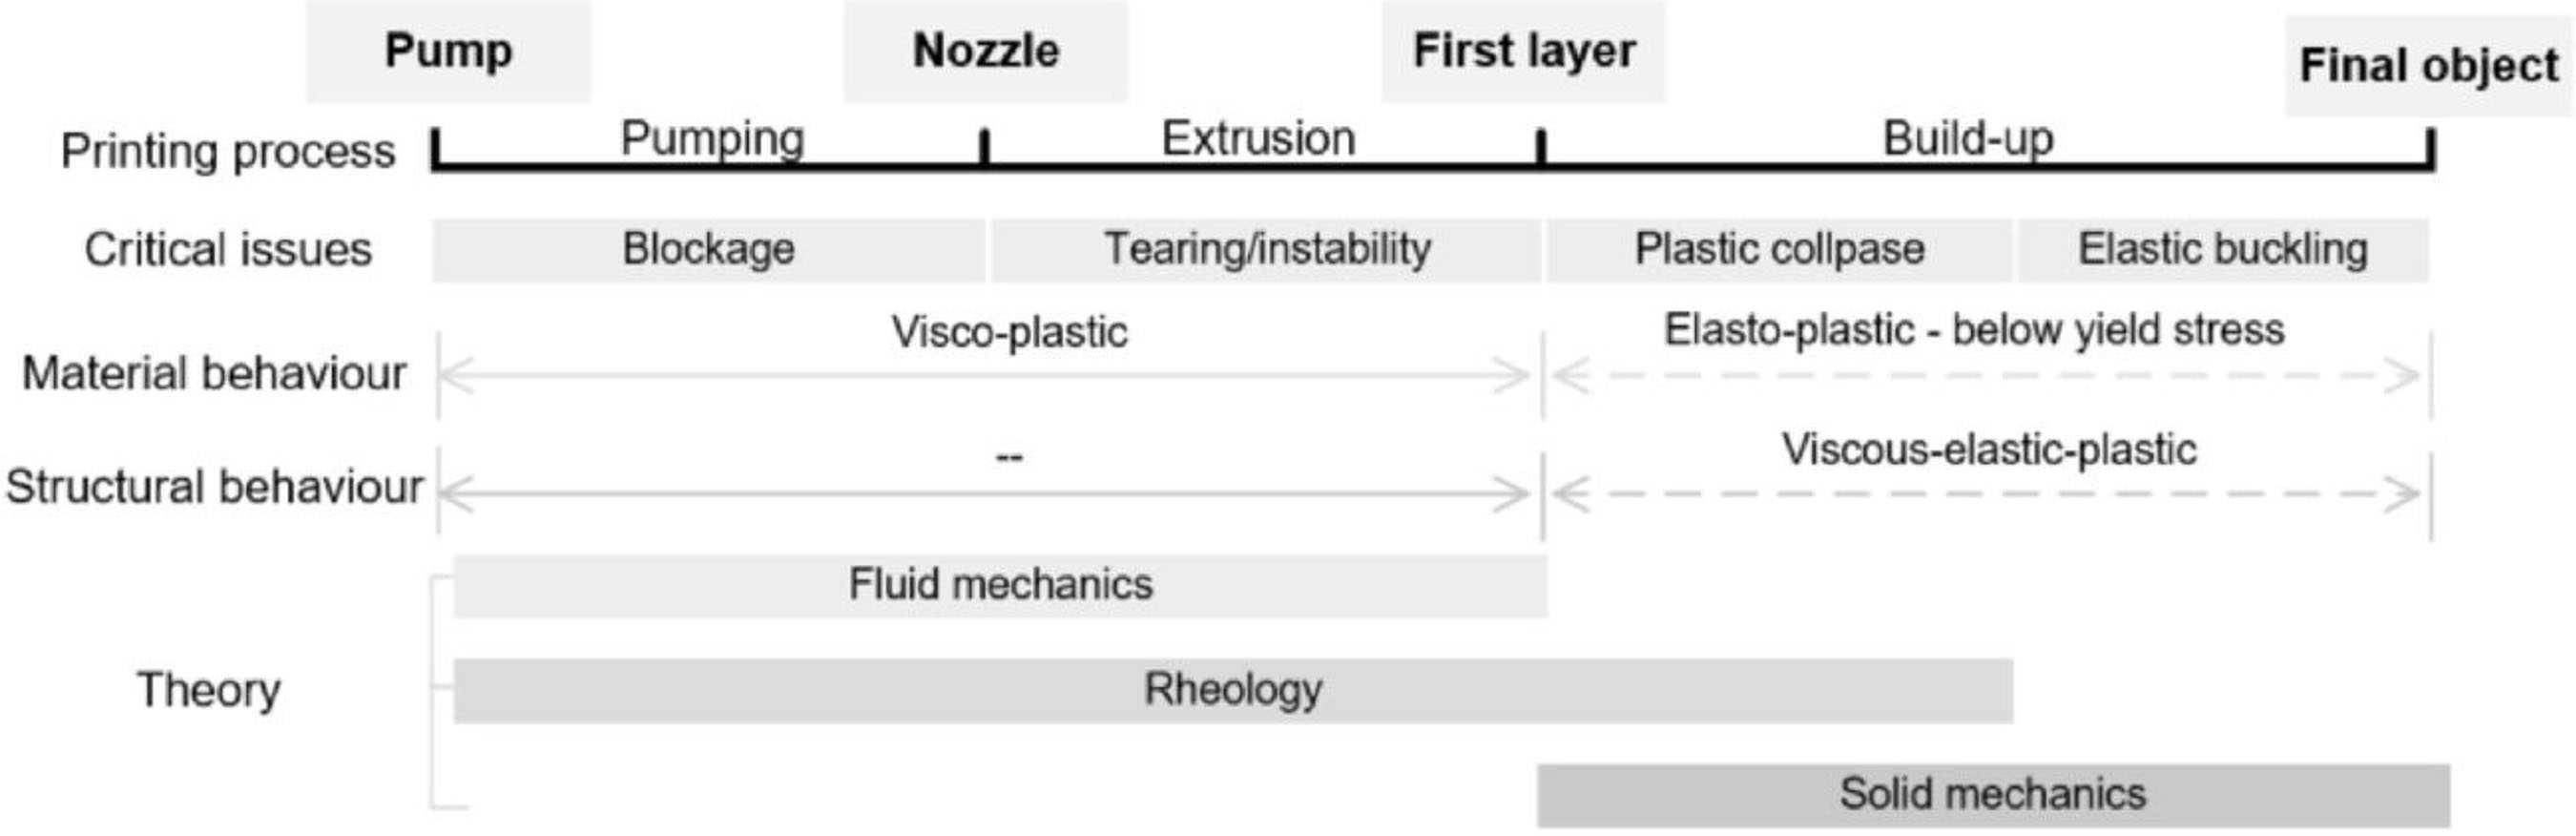
The main stages of the 3D printing process, associated with the required material behaviors and their respective governing theories, are outlined in Figure 3.

Thus, between the printing of the first and last layer, due to the absence of formwork, the mortar must be evaluated based on the theory of solid mechanics, requiring it to have sufficient initial stiffness and strength to support the weight generated by stacking. Two types of failure are reported in the literature: plastic collapse (strength) and elastic buckling (stability). Buckling occurs due to the structural instability of the object being printed, and plastic collapse results from material failure, ultimately leading to structural failure. For the 3D print not to collapse, the layers must have a strength compatible with the load increase from the deposition of new layers. Thus, the printing speed must be defined based on the strength gain of the mortar used in 3D printing (Chang et al., 2023).
According to Chang et al. (2023), the buildability of mortar can be assessed through experimental methods, analytical methods, and numerical models. The authors concluded that, among these approaches, experimental methods are the most reliable, although they require more material resources and time. Regarding the analytical method, a limitation was identified in its applicability to certain specific 3D printing geometries. Numerical methods, in turn, present restrictions in their application since they do not adequately represent the stages of additive manufacturing. Furthermore, it is noteworthy that most of the models analyzed assess printability as a function of stiffness and strength over time (Chen; Qian, 2025; Mogra et al., 2023).
Liu et al. (2022) emphasized the importance of adjusting the extrusion and feeding speed with the travel speed of the printing nozzle, as differences between these can result in varying levels of pressure that will affect the lower layers of the 3D print. Thus, the authors use the slope formed between the layers due to the crushing of the lower layers to evaluate buildability. The slope is calculated using the tangent of θ, obtained by defining a triangle between the height of the printed layers, the slope between the layer alignments, and the width difference between the last and the first layer, as illustrated in Figure 4.

An experimental method widely recognized in the literature as relevant for characterizing the buildability of mortars in 3DCP processes is the Unconfined Uniaxial Compressive Test - UUCT (Roussel; Lowke, 2022). This destructive test involves applying axial compressive loads to the mortar while it is still in the fresh state and without lateral confinement. The UUCT therefore enables the determination of the so-called green strength, as a function of the maximum deformation sustained by the material, providing valuable input for defining printing parameters, such as layer deposition speed, as well as for simulating the maximum number of stackable layers.
4 Experimental program
To analyze the sensitivity of the UUCT method for determining the load capacity of different mortars for the 3DCP process, two variables were defined:
-
mortar composition: six features of mortar, with widely varied composition and characteristics; and
-
load capacity evaluated at different times after mixing (cement hydration time): 15, 30, 60, and 90 minutes.
Thus, to assess the sensitivity of the method, 24 different conditions were evaluated. The mortar proportion that showed the best performance in the practical extrusion tests, combined with a fixed cement hydration time of 60 minutes, was adopted for the repeatability analysis. To simulate the maximum number of layers that can be printed, a shorter cement hydration time of 15 minutes was considered, in combination with four deformation levels of the mortars under study.
4.1 Materials
The mortars under study were produced using the following materials: Portland cement; natural riverbed sand; potable water; silica fume with spherical particles that have an average diameter of 150 nm (Elkem Microsilica®); colloidal silica aqueous dispersion, with solids content equal to 30% (Levasil CB 30); polycarboxylate-based water reducing admixture (MAXILUID L2020 – Matchem); and viscosity modifier admixture (V-MAR® PUMP - GPC Applied Technologies).
The Portland cement used was CP V ARI (Ciplan), with compressive strengths of 31.1 MPa, 40.6 MPa, and 48.4 MPa at 3, 7, and 28 days, respectively; Blaine fineness equal to 4888 cm2/g; setting time at 151 minutes and ending at 205 minutes. The chemical characterization of the cement is provided in Table 1.
The aggregate used in the production of the mortars was a natural siliceous riverbed sand from the municipality of Faina, GO, with a specific mass of 2.59 g/cm3, a maximum characteristic dimension of 2.4 mm, and a fineness modulus of 2.58. The particle size curve of the sand is shown in Figure 5.

4.2 Methods
4.2.1 Preparation of mortars
Six mixtures containing different proportions of the materials were prepared by varying the water/cement ratio (from 0.4 to 0.8); the sand/cement ratio (from 3 to 8); and the nanosilica/cement ratio (from 0.4 to 0.8), as detailed in Table 2.
All dry materials were first homogenized in a plastic bag. Next, these materials were added to a mechanical mixer vat, and the water containing the dissolved admixtures was added. These materials were homogenized at a velocity of 140 rpm for 3 minutes. The mixer remained at rest for 1 minute to scrape the sides of the tank. Finally, the mortars were mixed for an additional 6 minutes at 285 rpm, with the colloidal silica being added at the beginning of this final mixing step. This was to guarantee the perfect homogenization of the materials and activation of the admixtures.
The studied mortars were characterized in the fresh and hardened state, as summarized in Table 3.
4.2.2 Casting of UUCT specimens
The UUCT method consists of characterizing the mortar while it is in the fresh state; therefore, the specimens are cast and removed from the mold shortly after mixing.
The casting of the specimens was performed according to the procedure indicated by (Pott et al., 2023a; Bos et al., 2021; Dulaj; Salet; Lucas, 2021). Thus, a split cylindrical mold (70 mm in diameter and 140 mm in height) was used to ensure a height/diameter ratio equal to 2 (Figure 6a). Initially, a thin layer of mineral oil was applied to the inside of the mold, and a PVC film was applied over it to prevent the mortar from sticking and ensure proper removal of the mold while it was still fresh. The casting was done in two layers with a long spatula. Later, the mortars were densified for 10 seconds, in an electromagnetic stirrer with a frequency of 30 Hz, to ensure the perfect filling of the mold by reducing the presence of voids.

Figure 6b illustrates the mortar specimen in the fresh state. The entire process, including mixing, casting, compacting, removing the mold, and inserting the mortar sample into the universal testing machine, was carried out in less than 15 minutes.
4.2.3 Conducting the UUCT
To perform the test, a universal Emic DL 3000 assay machine equipped with a 2kN load cell was used (Figure 7). In addition to recording the compression force and the displacement caused by the press, a camera was used to record the deformation of the mortar due to compression.

As the tested mortar was in the fresh state, to transport the sample and avoid contact with the plates of the universal testing machine, plastic film was used at the lower and upper ends of the samples; furthermore, a thin layer of mineral oil was applied to the lower and upper plates of the press.
The mortar specimens were tested in the fresh state with a load application speed of 30 mm/min (0.5 mm/s). The maximum deformation applied was 70 mm. The test parameters used by other authors (Tao et al., 2023; Bos et al., 2021; Dulaj; Salet; Lucas, 2021) were adopted to measure the force from increasing displacements.
To assess the method’s sensitivity, six mortar formulations were tested at four different ages after mixing (15, 30, 60, and 90 minutes), resulting in 24 experimental combinations. The maximum force was measured with this time variation to verify the evolution of the mortar load capacity still in the fresh state. This property is important for mortars used in the 3D printing process as it represents the ability of the mortar to support the load of the overlying layers.
After this step, the repeatability of the UUCT method was assessed by performing the test on a set of 12 specimens prepared with a single mortar mix (60V6-5) and a fixed cement hydration time of 60 minutes. The evaluation of repeatability was based on the coefficient of variation of the maximum forces obtained from the 12 repetitions.
4.2.4 Simulation of the number of layers that can be printed
Based on the applied loads and the corresponding deformations obtained experimentally through the UUCT test, a simplified simulation was proposed to estimate the number of layers that could be 3D printed in practical scenarios. To calculate the bearing capacity of the layers, the experimentally measured deformations of each of the six mortars evaluated were considered, without accounting for other factors such as failure modes or sample buckling in the simulation.
The deformation levels adopted in this study were defined based on values reported in previous works, such as Mollah et al. (2021) and Chen et al. (2020a, 2020b), in which layer deformations ranged from 5% to 20%. For safety reasons, a maximum deformation of 5% was adopted for the first printed layer – responsible for supporting the subsequent layers – in the simulation of the number of layers that could be printed. It should be noted that adopting this 5% limit ensured that, for none of the mortars studied, the deformation would reach the rupture of the specimens.
Using the experimentally determined mass densities of the mortars (Table 3), the number of layers corresponding to the equivalent stress for 5% deformation was calculated. The simulation considered a mortar layer 15 mm high, 50 mm wide, and 1 m long, subjected to a uniformly distributed load. The UUCT test results obtained after 15 minutes of hydration (including a 10-minute mixing period followed by a 5-minute rest) were used, as longer hydration times would lead to loss of mortar consistency, increasing pumping resistance and hindering practical application.
Equations 1 and 2 outline the steps for calculating the maximum number of layers that can be printed for a given deformation level.
In which:
MSL is the maximum load supported by extrusion layer (N);
F5% is the force supported for 5% of deformation in UUCT test (N);
As is the cross-sectional area of the UUCT test specimen (= 0,00385 m2) (m2); and
Al is the cross-sectional area of the extrusion layer (=0,05m2) (m2).
In which:
NL is the Number of extrusion layers before reaching x% deformation;
MSL is the maximum load supported by extrusion layer (N); and
Wl is the weight of an extrusion layer (= volume of one bed extrusion x mortar density) (N).
5 Results and discussion
5.1 Evaluating the sensitivity of the method
The results obtained in the UUCT for the six mortar formulations combined with the four hydration times are compiled in Table 4, including the maximum supported force, the deformation imposed on the mortar for this level of force, and a picture of the specimen when the maximum force was applied.
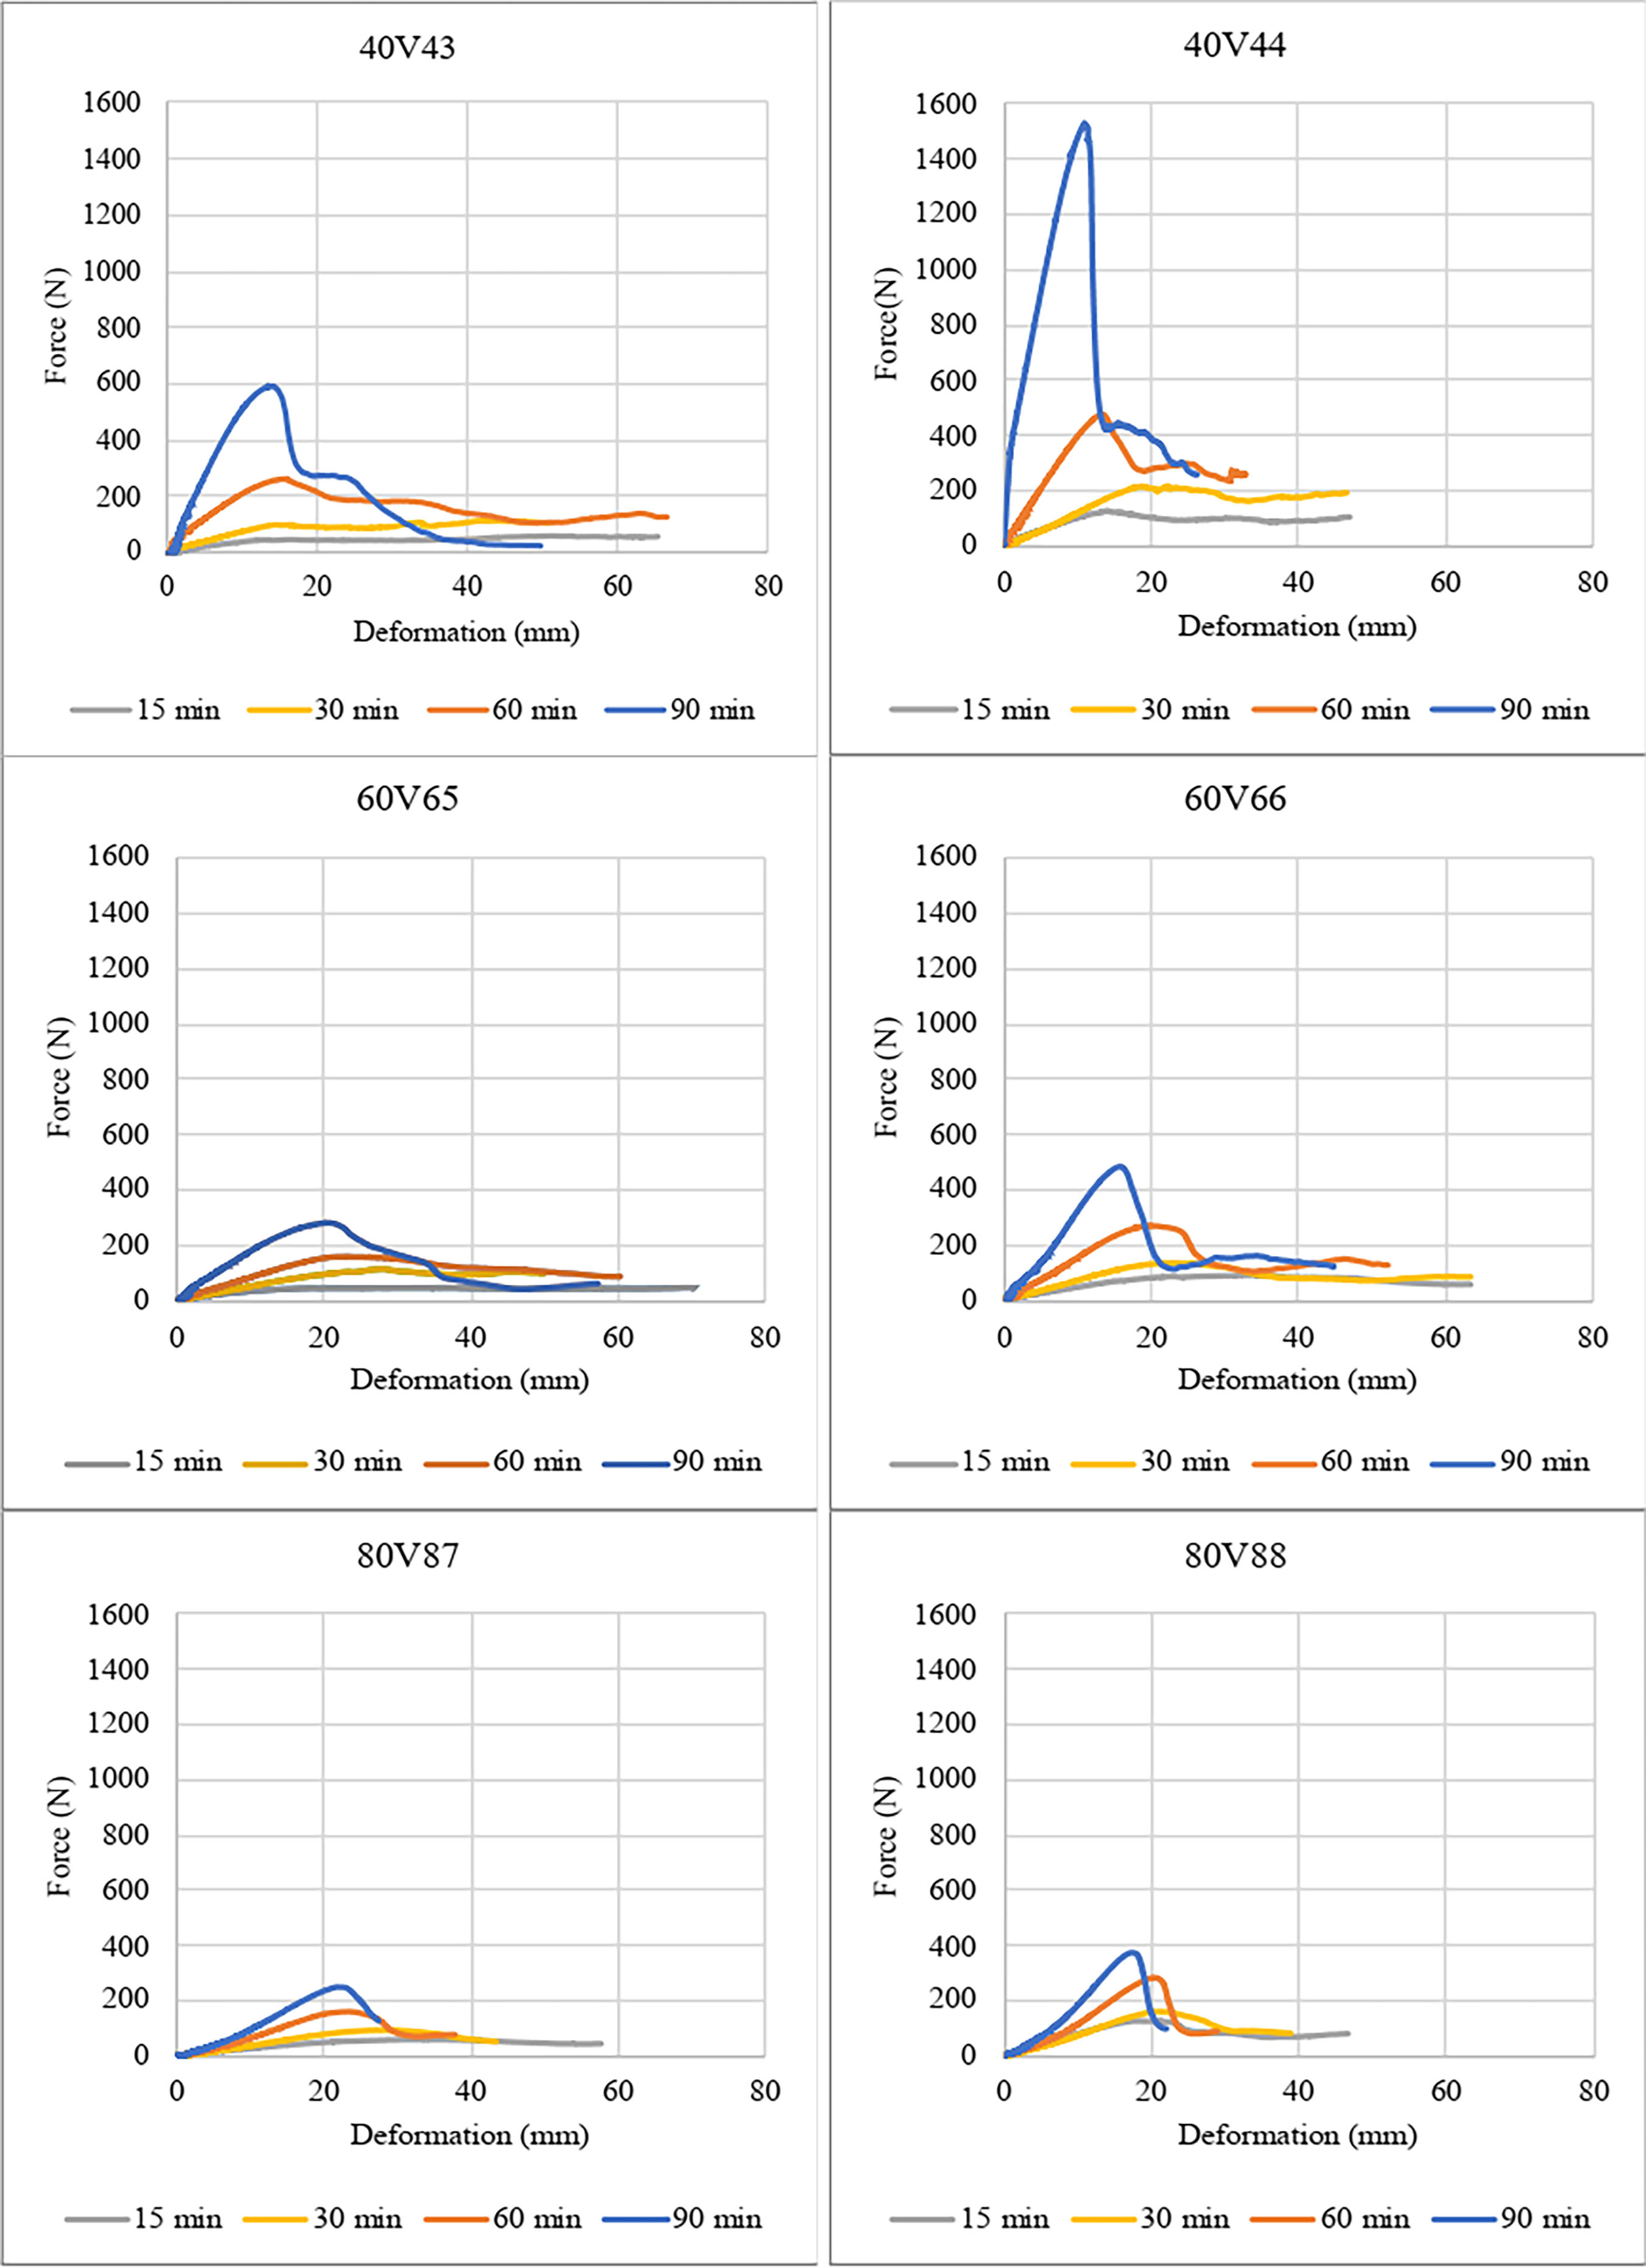
Figure 8 shows the curves of the force as a function of deformation for each of the situations tested.

Table 4 and Figure 8 elucidate that the mortars with the lowest water/binder ratio (equal to 0.4) have the highest load capacity in the fresh state. In addition, the higher the aggregate consumption, the greater the force supported for the same water/binder ratio. On average, the increase in aggregate consumption led to an increase of more than 60% of the maximum supported force. This is because aggregate particles are largely responsible for restricting fluid movement. Thus, the greater proportion of sand leads to greater restriction, whereas the greater proportion of paste leads to greater mobility in the system.
The curves in Figure 8 illustrate the layer deformation corresponding to each applied load level at different hydration ages. By quantifying the load supported at each deformation level, this test provides critical input for the optimization of 3D printing parameters, including printing speed, layer length, number of layers, and pauses between successive layers.
The maximum load obtained in the UCCT test, divided by the cross-sectional area of the specimen, corresponds to the rupture stress of the mortars in the fresh state. For the 15-minute test time, the values ranged from 5 to 19 kPa, in agreement with the results presented by Bos et al. (2021), who reported a stress of 10.5 kPa for the same hydration time.
The same figure also indicates that the applied load reaches a maximum peak. After this limit, the piston of the universal machine, still in motion, causes greater deformation, and the load that the mortar can support gradually decreases.
Figure 9 illustrates the mortar samples with different hydration times after total deformation of 70 mm.

As hydration time progresses, the mortars gradually lose their plasticity and begin to behave more like a solid. This transition is evident when comparing the mortars tested at 15 minutes with those tested at 90 minutes, as shown in Figure 9. The first group exhibits cohesive and plastic behavior up to a deformation of 70 mm, with failure characterized as a ductile barreling failure, as described by Wolfs, Bos and Salet (2018) and Liu et al. (2023) (Figure 10a). In contrast, the second group – mortars tested after 90 minutes – shows solid-like behavior, leading to the formation of shear cones and the typical rupture pattern of hardened cementitious materials, i.e., a brittle shear failure mode (Figure 10b).

Mortars with a lower water/binder ratio and mortars with a higher amount of aggregate in the same water/binder ratio are both more susceptible to this behavior, due to the lower amount of water available in the system or the reduced proportion of paste in relation to the granular fraction.
As the UUCT method uses axial compression without confinement of the fresh mortar, its relevance may be limited to some specific situations of plasticity of the mixture. The more fluid mortars do not allow the removal of the formwork soon after the end of the molding. On the other hand, more consistent mortars can make molding difficult, resulting in the formation of voids. However, the UUCT method obtains satisfactory results for the consistency range of most mortars used for 3D printing.

5.2 Evaluation of method repeatability
The results obtained in the repetitions of the UUCT method with the same mortar (60V6-5) and fixed hydration time of 60 minutes are presented in Figure 11. In the first phase of the graph, which consists of the linear part until the maximum force is reached, a very homogeneous behavior is evident for all repetitions of the test. After the maximum force, which represents the time after the rupture of the sample, a greater dispersion in the behavior of the curves is evident.
Based on the 12 results, the mean value and the coefficient of variation of the maximum force were 179.26 N and 6%, respectively. The coefficient of variation (CV) is a statistical parameter that quantifies the relative dispersion of a data set with respect to its mean. In the present study, the low CV values indicate good precision and strong repeatability of the proposed method.
5.3 Simulation of the number of layers that can be printed
The following presents the results of a simulated printing scenario. To ensure that the 5% deformation selected for the simulation would not cause mortar rupture, the UUCT test results were used to determine the maximum deformation values that led to the failure of each tested sample (Table 5).
It can be observed that the lowest deformation value leading to material rupture was 10% for mortar 40V4-4, which is higher than the 5% deformation adopted in the simulation.
For each of the mortars, the load values corresponding to the 5% deformation level (Table 6) were extracted from the UUCT test results graph (evaluated at 15 minutes). From these values, the maximum supported load (MSL) was calculated for each mortar under study, considering a printed path with defined dimensions of 15 mm in height, 50 mm in width, and 1 meter in length (Table 7).
Figure 12 presents, for each of the mortars studied, the number of extruded layers (NL) required to reach 5% deformation, calculated based on the MSL and the weight of a single extrusion layer.

Number of layers (15 mm high and 50 mm thick) required to reach the 5% deformation level stipulated, for the different mortars
The mortars that exhibited the highest stacking capacity were 40V4-4, 80V8-8, and 60V6-6, allowing the formation of 65, 46, and 28 layers, respectively. This behavior can be attributed to their rheological characteristics. According to the rheological characterization performed by Araújo (2025), the mortars presenting the highest thixotropy values corresponded to those capable of sustaining the greatest number of layers under the same deformation level (5%). In contrast, the 80V8-7 mortar, which supported only 17 layers, exhibited the lowest thixotropy value (2.85 kPa/s). Similarly, Bos et al. (2021) reported that the mortar with the best stacking performance in their study enabled the printing of 100 layers within 16 minutes, exceeding 1 m in height. The superior performance of that mortar, relative to the others investigated, was attributed by the authors to its pronounced thixotropic behavior. Considering the loads that result in 5% deformation of the mortars in the UUCT for 15 minutes of hydration of the mortar (a mixing period of 10 minutes followed by 5 minutes of rest), the maximum number of layers possible was then calculated. The maximum number of layers possible was multiplied by the individual height of each layer (15 mm), resulting in the maximum height that full-scale printing would reach with each of the mortars, ranging between 0.26 m and 0.98 m (Figure 13).

All mortars evaluated using the UUCT method performed satisfactorily, with printing heights exceeding 0.26 m.
Commercial 3D printers operate at speeds ranging from 50 to 500 mm/s, with typical values between 200 and 250 mm/s. At a printing speed of 200 mm/s, a total extrusion length of approximately 60 meters can be achieved in 5 minutes. Therefore, in a hypothetical case of printing a house compartment with a perimeter of 10 meters, six layers of this perimeter could be completed in approximately 5 minutes. In this case, if 80V8-7 mortar (the most deformable of those studied) were used, the deformation of the first printed layer would be approximately 1% (in the initial stage). Therefore, based on the UUCT results, it is possible to determine the layer warpage at each stage of the 3D printing process. Consequently, the results can be used to optimize layer height, print speed, and other printing parameters.
It's worth noting that the entire simulation performed in this article was performed using the shortest time tested - 5 minutes - in the UUCT test. Thus, the remaining test times - 30, 60, and 90 minutes - would allow for additional simulations combining increased hydration with increased layer count, depending on the printing speed.
6 Conclusions
This article employed the UUCT method to characterize mortars in the fresh state, helping predict their behavior when used for 3D printing. Based on the experimental tests and the simulation conducted, the following conclusions can be drawn:
-
the UUCT method is effective and sensitive for the characterization of different mortars for 3D printing, allowing the evaluation of the load-bearing capacity and the respective deformations generated;
-
as the mortars were tested with various hydration times, the gain in load capacity and the reduction of deformation over time, obtained in the UUCT, provide relevant information on the speed of plasticity loss of cementitious materials with different compositions;
-
mortars with higher aggregate consumption and lower water/binder ratios support higher loading with lower deformations;
-
the adequate coefficient of variation (6%) obtained when evaluating the repeatability of the method indicates that the UUCT has good accuracy; and
-
asimplified simulation based on the experimental results of UUCT test made it possible to estimate the number of layers and the printing height that the mortar will support during the full-scale process, demonstrating its potential as a complementary tool for planning and prediction on-site 3D printing.
The results obtained highlight the relevance of the UUCT and the need to broaden research on this testing method. Accordingly, this study may serve as a reference for future investigations aimed at simulating the number of printed layers and the deformation levels of mortars used in 3D printing, thereby contributing to advancing knowledge on material behavior and on the characterization methods applied to additive manufacturing in civil construction.
A limitation is that the UUCT method is only applicable to mortars with predominantly plastic behavior. Furthermore, this test does not provide information on the extrusion capacity or pumpability of the mixture, which must be assessed using complementary methods.
Acknowledgments
Funding and fellowship for research productivity PQ were provided by the Conselho Nacional de Desenvolvimento Científico e Tecnológico – CNPq, Brazil (processes 309587/2021-2; 404260/2021-7 and 306111/2025-0) and the Fundação de Amparo à Pesquisa do Estado de Goiás – FAPEG, Brazil (process 202310267001445).
-
CARASEK, H.; ARAÚJO, R. C. Determining the load-bearing capacity of the layers in 3D printing mortars. Ambiente Construído, Porto Alegre, v. 26, e149929, jan./dez. 2026. ISSN 1678-8621 Associação Nacional de Tecnologia do Ambiente Construído. http://dx.doi.org/10.1590/s1678-86212026000100952
-
Financial Support
Conselho Nacional de Desenvolvimento Científico e Tecnológico – CNPq, Brazil - Processes 309587/2021-2; 404260/2021-7, and 306111/2025-0; Fundação de Amparo à Pesquisa do Estado de Goiás – FAPEG, Brazil (process 202310267001445).
-
Declaration of Generative AI and AI-Assisted Technologies in the Writing Process
During the preparation of this work, the author(s) used ChatGPT in order to check grammar issues and to improve readability. After using this tool/service, the author(s) reviewed and edited the content as needed and take(s) full responsibility for the content of the publication.
Data Availability Statement
Research data is only available upon request.
References
- AMERICAN SOCIETY FOR TESTING AND MATERIALS. D2166-13: standard test method for unconfined compressive strength of cohesive soil. Philadelphia, 2013.
- ARAÚJO, R. C. 3D printing for civil construction: development of a method to evaluate the printability and rheological study of mortar in the processing stages. Goiás, 2025. 198 f. Thesis (Doctorate in Science) – School of Civil and Environmental Engineering, Federal University of Goiás, Goiás, 2025.
- ASSOCIAÇÃO BRASILEIRA DE NORMAS TÉCNICAS. NBR 13276: argamassa para assentamento e revestimento de paredes e tetos: determinação do índice de consistência. Rio de Janeiro, 2016.
- ASSOCIAÇÃO BRASILEIRA DE NORMAS TÉCNICAS. NBR 13278: argamassa para assentamento e revestimento de paredes e tetos: determinação da densidade de massa e do teor de ar incorporado, no estado fresco. Rio de Janeiro, 2005a.
- ASSOCIAÇÃO BRASILEIRA DE NORMAS TÉCNICAS. NBR 13279: argamassa para assentamento e revestimento de paredes e tetos: determinação da resistência à tração na flexão e à compressão. Rio de Janeiro, 2005b.
- BIRICIK, O.; MARDANI, A. Parameters affecting thixotropic behavior of self compacting concrete and 3D printable concrete: a state-of-the-art review. Construction and Building Materials, v. 339, p. 1-22, 2022.
- BOS, F. P. et al Juxtaposing fresh material characterization methods for buildability assessment of 3D printable cementitious mortars. Cement and Concrete Composites, v. 120, p. 1-18, 2021.
- BUSWELL, R. A. et al 3D printing using concrete extrusion: a roadmap for research. Cement and Concrete Research, v. 112, p. 37-49, 2018.
- CAI, J. et al State-of-the-art of mechanical properties of 3D printed concrete. Case Studies in Construction Materials, v. 21, p.1 -19, 2024.
- CHANG, Z. et al A review of methods on buildability quantification of extrusion-based 3D concrete printing: from analytical modelling to numerical simulation. Developments in the Built Environment, v. 16, p 1-17, 2023.
- CHEN, B.; QIAN, X. Explainable data-driven analysis of uncertainty propagation in 3D concrete printing via adaptive polynomial chaos expansion. Automation in Construction, v. 178, p. 1-24, 2025.
- CHEN, Y. et al Effect of different grade levels of calcined clays on fresh and hardened properties of ternary-blended cementitious materials for 3D printing. Cement and Concrete Composites, v. 114, p. 1-20, 2020b.
- CHEN, Y. et al Improving printability of limestone-calcined clay-based cementitious materials by using viscosity-modifying admixture. Cement and Concrete Research, v. 132, p. 1-18, 2020a.
- DOUBA, A.; KAWASHIMA, S. Use of nanoclays and methylcellulose to tailor rheology for three-dimensional concrete printing. ACI Materials Journal, v. 118, n. 6, 2021.
- DULAJ, A.; SALET, T.; LUCAS, S. S. A study of the effects of MWCNTs on the fresh and hardened state properties of 3D printable concrete. Case Studies in Construction Materials, v. 20, p. 1-26, 2024.
- HOSSEEINI, E. et al. A novel method to enhance the interlayer bonding of 3D printing concrete: an experimental and computational investigation. Cement and Concrete Composites, v. 99, p. 112-119, 2019.
- JAJI, M. B. et al Mechanical performance of extrusion-based two-part 3D-printed geopolymer concrete: a review of advances in laboratory and real-scale construction projects. Materials Today Sustainability, v. 31, p. 101-131, 2025.
- JARNY, S. et al. Rheological behavior of cement pastes from MRI velocimetry. Cement and Concrete Research, v. 35, n. 10, p. 1873-1881, 2005.
- JIA, L. et al Initial plastic shrinkage of 3D-printed concrete incorporating recycled brick fine aggregates: Insights from water transport and structural evolution. Journal of Building Engineering, v. 106, p. 1-16, 2025.
- KHAN, M. A. Mix suitable for concrete 3D printing: a review. Materials Today: Proceedings, v. 32. p. 831–837, 2020.
- KRUGER, J.; ZERANKA, S.; VAN ZIJL, G. An ab initio approach for thixotropy characterisation of (nanoparticle-infused) 3D printable concrete. Construction and Building Materials, v. 224 p. 372–386, 2019.
- LIU, C. et al Influence of hydroxypropyl methylcellulose and silica fume on stability, rheological properties, and printability of 3D printing foam concrete. Cement and Concrete Composites, v. 122, p. 1-15, 2021.
- LIU, C. et al Study of the influence of sand on rheological properties, bubble features and buildability of fresh foamed concrete for 3D printing. Construction and Building Materials, v. 356, p. 1-15, 2022.
- LIU, Z. et al Comprehensive investigations on the relationship between the 3D concrete printing failure criterion and properties of fresh-state cementitious materials. Additive Manufacturing, v. 76, p. 1-15, 2023.
- MA, S.; KAWASHIMA, S. Role of shear stress at rest on the viscoelastic response of fresh cement pastes. Journal of Rheology, v. 64, p. 433-444, 2020.
- MECHTCHERINE, V.; NERELLA, V. N. Beton-3D-Druck durch selektive Ablage Anforderungen an Frischbeton und Materialprüfung. Beton- und Stahlbetonbau, v. 114, p. 24-32, 2019.
- MOGRA, M. et al Design optimization of 3D printed concrete elements considering buildability. Engineering Structures, v. 294, p. 1-17, 2023.
- MOHAN, M. K. et al Extrusion-based concrete 3D printing from a material perspective: a state-of-the-art review. Cement and Concrete Composites, 115, p. 1-17, 2021.
- MOLLAH, M. T. et al Stability and deformations of deposited layers in material extrusion additive manufacturing. Additive Manufacturing, v. 46, p. 1-12, 2021.
- PANDA, B.; TAN, M. J. Rheological behavior of high volume fly ash mixtures containing micro silica for digital construction application. Materials Letters, v. 237, p. 348–351, 2019.
- POTT, U. et al Comparison of physical and physicochemical methods for 3D printing application with the focus on the unconfined uniaxial compression test. Construction and Building Materials, v. 395, p. 1-12, 2023a.
- POTT, U. et al Investigation of a shotcrete accelerator for targeted control of material properties for 3D concrete printing injection method. Cement and Concrete Research, v. 173, p. 1-17, 2023b.
- ROUSSEL, N. A thixotropy model for fresh fluid concretes: theory, validation and applications. Cement and Concrete Composites, v. 36, p. 1797–1806, 2006.
- ROUSSEL, N.; LOWKE, D.; BUSWEL, R. The Rilem D.F.C. Technical committee history, strategy and achievements. In: ROUSSEL, N.; LOWKE, D. (ed.). Digital fabrication with cement-based materials London: Springer, 2022.
- SHOBAJO, O. Z. Exploring the potential of 3D printing for building houses in Nigeria and brief numerical analysis of lintels in 3D printed houses Kyoto, 2020. 51 f. Master’s thesis. Ritsumeikan University, Kyoto, 2020.
- TAO, Y. et al Development of a calcium sulfoaluminate-Portland cement binary system for twin-pipe 3D concrete printing. Cement and Concrete Composites, v. 138, p. 1-11, 2023.
- WOLFS, R.; BOS, F. P.; SALET, T. A. M. Correlation between destructive compression tests and non-destructive ultrasonic measurements on early age 3D printed concrete. Construction and Building Materials, v. 181, p. 447-454, 2018.
- ZAFAR, M. S. et al Optimization of biopolymer additives for 3D printable cementitious systems: a design of experiment approach. Case Studies in Construction Materials, v. 22, p. 1-25, 2025.
- ZHANG, Y. et al Study on the predictive model for continuous build height of 3D printed concrete (3DPC) based on printability and early mechanical properties. Journal of Building Engineering, v. 99, p. 1-15, 2025.
Edited by
-
Editor-in-chief:
Enedir Ghisi
-
Guest editor:
Juliana Machado Casali Peruch