 Cost-Effectiveness Analysis of Coronary Computed Tomography Angiography as the Preferred Exam in the Investigation of Stable Chest Pain in the Brazilian Private Healthcare System
Background Cardiovascular disease is the leading cause of mortality worldwide. Strategies that prioritize early diagnosis can reduce the incidence of related complications and cost.
Objective To assess the cost-effectiveness of coronary computed tomography angiography (CCTA) as the initial diagnostic strategy for stable chest pain in patients with intermediate pre-test probability of stable coronary artery disease (CAD), in comparison with invasive coronary angiography (ICA).
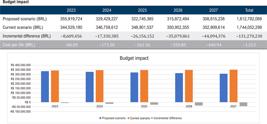
Methods A cost-effectiveness analysis was conducted comparing CCTA and ICA, considering data from the Brazilian private healthcare system. The model considered the direct costs of diagnostic exams, medical supplies, hospitalization for myocardial infarction, and myocardial revascularization in the 5 regions of Brazil. A budget impact analysis was performed regarding the gradual incorporation of CCTA over 5 years, considering 100,000 lives as the eligible population.
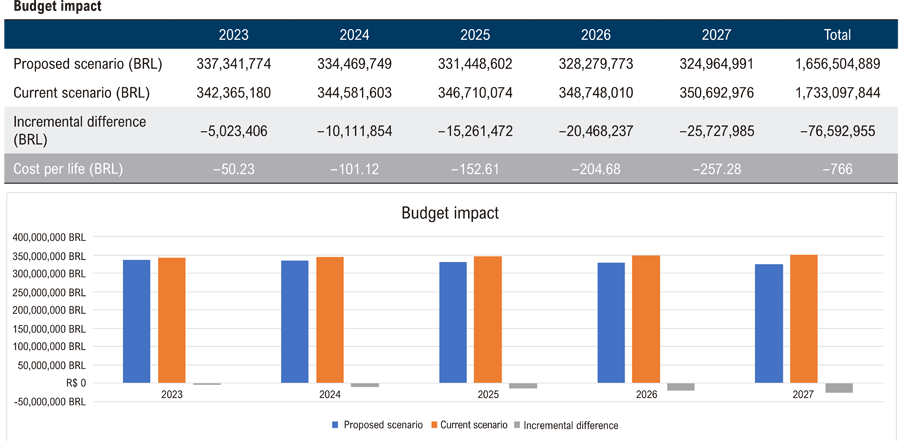
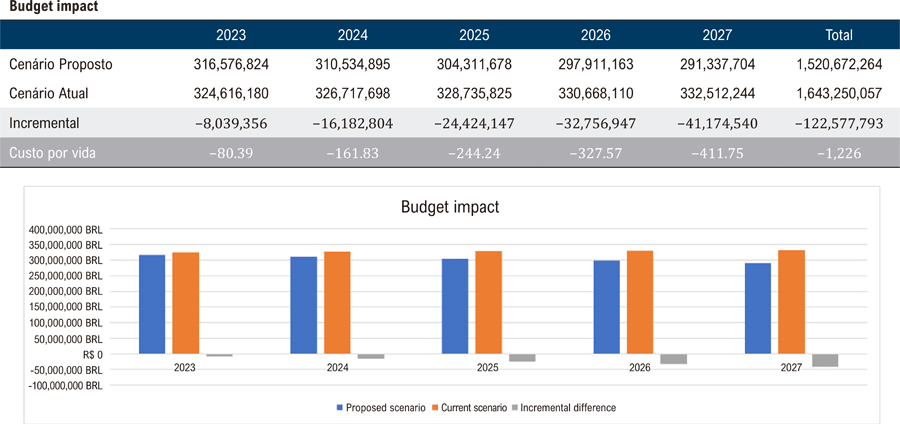
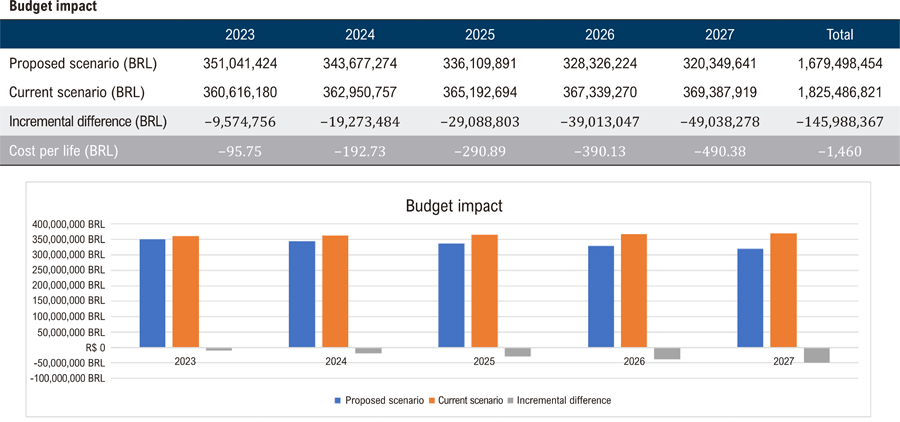
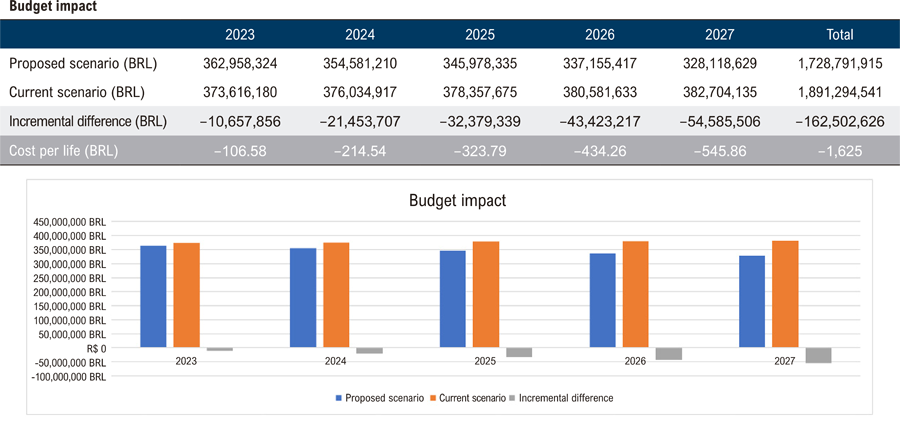
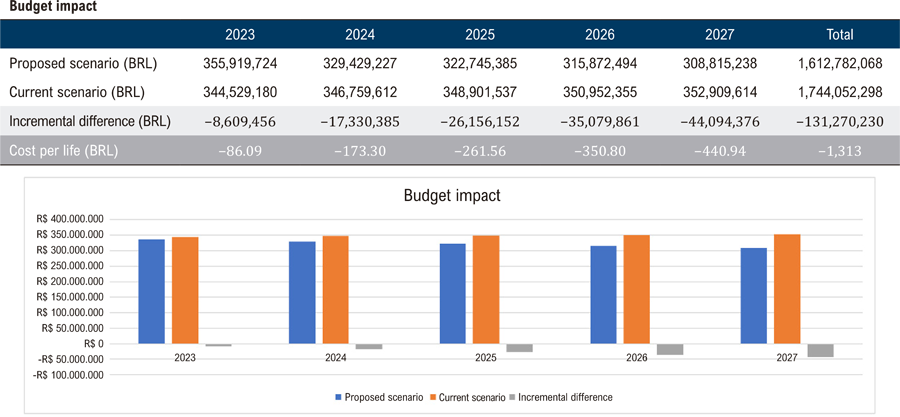
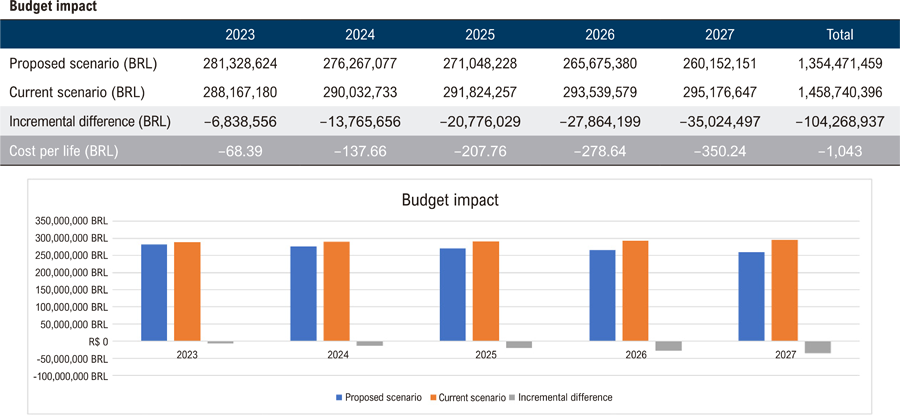
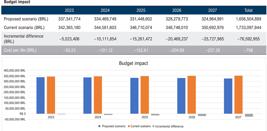
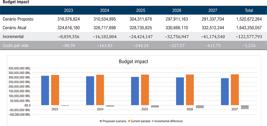
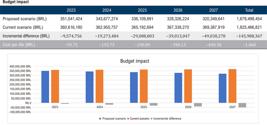
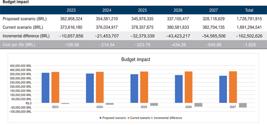
Results The cost-effectiveness analysis comparing CCTA to ICA, estimated for a population of 100,000 lives, demonstrated cost savings of BRL 1,021.00 per life or a total of BRL 102,069,703.00 by the end of the fifth year. When considering the regional average cost of CCTA, for a population of 100,000 over 5 years, we observed the following cost savings per life and in 5 years, respectively: BRL 1,226.00 and BRL 122,577,793.00 in the North Region; BRL 1,460.00 and BRL 145,988,367.00 in the Northeast Region; BRL 1,625.00 and BRL 162,502,626.00 in the Central-West Region; BRL 1,313.00 and BRL 131,270,230.00 in the Southeast Region; and BRL 1,043.00 and BRL 104,268,937.00 in the South Region.
Conclusion As an initial strategy for investigating stable chest pain, CCTA is cost-effective compared to ICA and is associated with significant cost reductions in the Brazilian private healthcare system.
Keywords:
X-Ray Computed Tomography; Coronary Artery Disease; Cost-Effectiveness Analysis; Myocardial Infarction
 Thumbnail
 Thumbnail
 Thumbnail
 Thumbnail
 Thumbnail
 Thumbnail
 Thumbnail
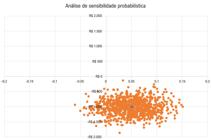
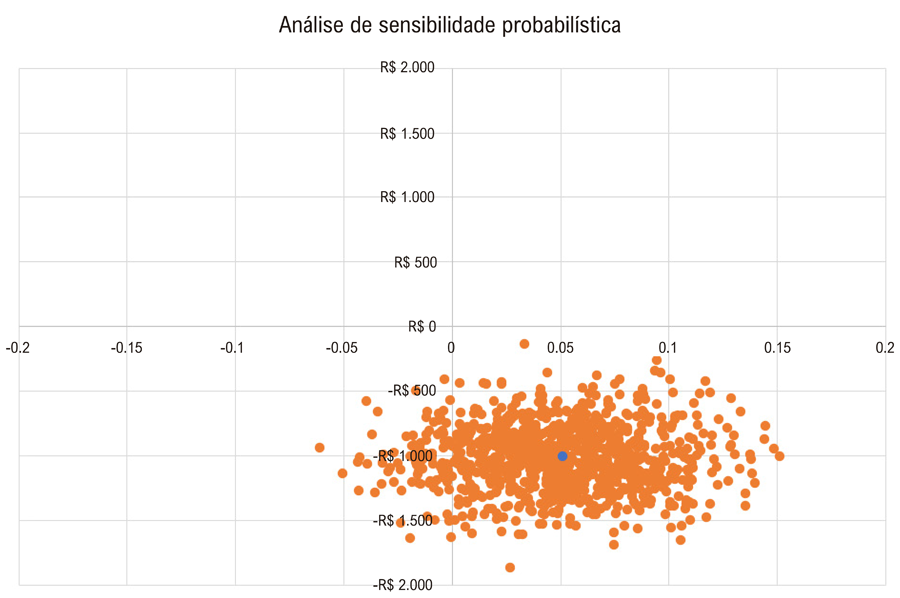 Análise de sensibilidade probabilística de custo-efetividade no cenário nacional. Nota-se que a grande maioria dos pontos (91,2%) caem sobre o quadrante inferior direito, que indica dominância em relação ao comparador. Apenas 8,8% dos pontos caem no quadrante inferior esquerdo de custo efetividade. Os pontos laranjas representam as 1.000 iterações probabilísticas feitas, já o ponto azul representa o ponto determinístico encontrado.
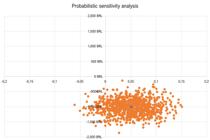
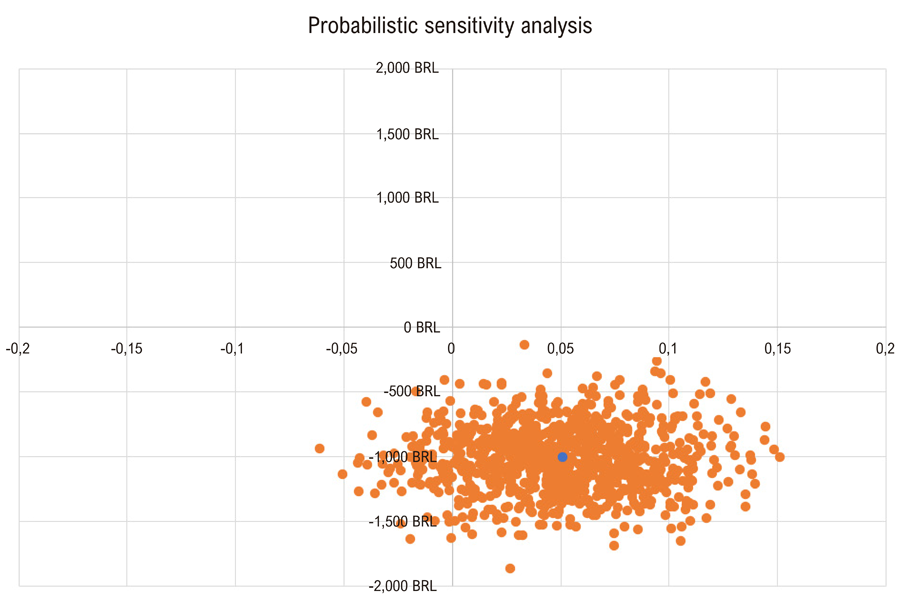 Probabilistic sensitivity analysis of cost-effectiveness in Brazil. The vast majority of points (91.2%) fall in the lower right quadrant, indicating dominance relative to the comparator. Only 8.8% of the points fall in the lower left quadrant of cost-effectiveness. The orange points represent 1,000 probabilistic iterations, whereas the blue point represents the deterministic point identified.