
 Spatial Distribution of Patients in the Metropolitan Area of São Paulo Attending a Public Tertiary Cardiovascular Referral Hospital According to Diseases of the Circulatory, Respiratory, Endocrine, and Neoplastic Systems
Abstract
Background The spatial distribution of patients according to clinical characteristics, using geoprocessing techniques, enables the identification of disease clusters within a studied population. This approach supports the development of targeted interventions directed toward specific risk groups.
Objectives To investigate geographical clusters of diseases of interest among patients attending a public tertiary hospital and to characterize their spatial distribution across the metropolitan area of São Paulo.
Methods Based on the results of a previous study, two disease groups were defined: one representing the main diseases identified at the first hospital visit and another representing the main underlying causes of death. A detailed description is provided in the online supplementary material. Disease density was calculated by dividing the frequency of cases within each disease group by the population of each city/district and multiplying the result by 100,000 to enhance data visualization. Spatial data were subsequently analyzed and mapped to illustrate the spatial patterns and relationships identified in the study.
Results Osasco and Taboão da Serra showed the highest density of underlying causes of death related to diseases of the circulatory system. Additionally, 12 cities/districts located at the borders of the study area showed no recorded neoplastic diseases.
Conclusions Vargem Grande Paulista showed the highest case density for neoplasms as underlying causes of death and comorbidities. Notably, Embu das Artes, a city recognized for its extensive green areas, showed the highest density of diseases of the respiratory system.
Keywords:
International Classification of Diseases; Comorbidity; Cause of Death; Mortality; Noncommunicable Diseases

Resumo
Fundamento A distribuição espacial de pacientes segundo características clínicas, utilizando técnicas de geoprocessamento, permite identificar aglomerados de doenças em uma população estudada. Essa abordagem contribui para o desenvolvimento de intervenções direcionadas a grupos específicos de risco.
Objetivos Investigar aglomerados geográficos de doenças de interesse entre pacientes atendidos em um hospital público terciário e caracterizar sua distribuição espacial na região metropolitana de São Paulo.
Métodos Com base nos resultados de um estudo prévio, foram definidos dois grupos de doenças: um representando as principais doenças identificadas na primeira consulta hospitalar e outro representando as principais causas básicas de morte. Uma descrição detalhada é apresentada no material suplementar online. A densidade das doenças foi calculada dividindo-se a frequência de casos em cada grupo de doenças pela população de cada cidade/distrito e multiplicando-se o resultado por 100.000 para melhorar a visualização dos dados. Posteriormente, os dados espaciais foram analisados e mapeados para ilustrar os padrões espaciais e as relações identificadas no estudo.
Resultados Osasco e Taboão da Serra apresentaram a maior densidade de causas básicas de morte relacionadas a doenças do sistema circulatório. Além disso, 12 cidades/distritos localizados nas fronteiras da área de estudo não apresentaram registro de doenças neoplásicas.
Conclusões Vargem Grande Paulista apresentou a maior densidade de casos de neoplasias como causas básicas de morte e comorbidades. Destaca-se que Embu das Artes, município reconhecido por suas extensas áreas verdes, apresentou a maior densidade de doenças do sistema respiratório.
Palavras-chave:
Classificação Internacional de Doenças; Comorbidade; Causas de Morte; Mortalidade; Doenças Não Transmissíveis
Introduction
Every year, millions of people die from chronic noncommunicable diseases (NCDs), including neoplasms, diabetes mellitus, cardiovascular diseases (CVDs), and chronic respiratory diseases, many of which are preventable and treatable. The burden of these conditions is particularly pronounced in cities across countries of the Global South, where social and economic inequalities remain substantial. According to the World Health Organization, CVD are the leading cause of death worldwide, accounting for approximately 17.9 million deaths annually.1
Patients admitted to tertiary hospitals frequently present with multiple comorbidities and require highly complex care. Following hospital discharge, long-term follow-up information is often unavailable in hospital databases unless patients are enrolled in research protocols. Lesage et al.2 conducted a 5-year follow-up study involving 86 patients after hospital discharge and reported a mortality rate of 33.3%, a readmission rate of 21.3%, and an average interval of 50 days between discharge and readmission.
Lederman et al.3 observed that the four major disease groups affecting patients treated at our institution were diseases of the circulatory system, respiratory system, endocrine system, and neoplasms. We also identified two disease associations: one between ICD-10 Chapter IX (Diseases of the Circulatory System) and Chapter XVI (Certain Conditions Originating in the Perinatal Period), and another between ICD-10 Chapter IX and Chapter XVII (Congenital Malformations, Deformations and Chromosomal Abnormalities).
The present study aimed to evaluate the geographic distribution of 2 groups of electronic health records from a tertiary public hospital: i) patients who died during follow-up and ii) patients who remained alive until the end of the follow-up period. The analysis focused on circulatory, respiratory, endocrine, and neoplastic diseases and/or their role as underlying causes of death. We hypothesized that the findings would provide valuable information to improve patient follow-up strategies and contribute additional evidence regarding the spatial distribution of major disease groups in this population.
Methods
Clustering
Based in the findings of Lederman et al.,3 two disease groups were defined to identify disease clusters: one representing the main diseases identified during the first hospital visit and another representing the main underlying causes of death. A more detailed description of these groups is available in the online supplementary material. Disease density was calculated by dividing the frequency of cases within each disease group by the population of the corresponding city or district and multiplying the result by 100,000 to improve data visualization.
Omitted data
The hospital serves a substantial number of patients who undergo only diagnostic procedures, such as imaging and laboratory testing, without attending clinical appointments. As a consequence, this subgroup tends to exhibit longer survival times than patients presenting with one or more clinical diagnoses.
Data handling
Data sharing between the hospital and the public mortality database was regulated through an agreement signed by both institutions on December 28, 2022. To preserve patient confidentiality, postal codes capable of identifying residential addresses were replaced with the nearest postal code that did not permit address identification.
Population records
A total of 1,395,063 hospital records collected between 2002 and 2017 were selected for linkage with civil registry data from the state of São Paulo, processed and maintained by a public foundation. Population estimates for the state of São Paulo in 2017 were obtained from the repository of the State Data Analysis System.4
Variables
Demographic, hospital-related, and mortality-related variables were previously described in Section 2.5 of the original publication.1 Geographic variables, including latitude and longitude coordinates, were derived from patients’ postal address codes.
Research setting
The study was conducted at a public tertiary academic hospital using records from patients treated between January 1, 2002, and December 31, 2017, regardless of age or sex. The institution receives a large volume of patients requiring care for cardiac, respiratory, and endocrine diseases. Due to journal blinding requirements, the institution’s name cannot be disclosed in the present manuscript.
Patient population
Approximately 80% of patients treated at the hospital receive care through the Brazilian Unified Health System, whereas the remaining patients are covered by private health care services. A total of 1,351,070 hospital records were included in the analysis. Information regarding health care coverage type was not available.
Inclusion criteria
All hospital patient records from January 1, 2002, through December 31, 2018, were eligible for inclusion. Mortality data covering the period from 2002 to 2017 were provided by a public foundation. Additional details regarding inclusion criteria are available in Section 2.8 of the previous publication.3
Data linkage process
Deterministic linkage methodology was applied,5 a technique extensively used by researchers affiliated with the public foundation responsible for mortality data management.
Variable standardization, variable derivation, data linkage, and data cleaning
Variable standardization was performed to generate comparable variables for record matching procedures. Variable derivation methods were applied to account for orthographic variations and improve linkage accuracy. Data cleaning procedures were conducted to ensure consistency and reliability across databases.
Anonymization
To ensure patient privacy and confidentiality, hospital officers responsible for data protection required the removal of all personal identifiers, including names, addresses, public identification numbers, patient identifiers, and the final three digits of postal codes.
Statistical analysis
Descriptive analyses were performed to characterize the study population. The population pyramid presented in Figure 1 illustrates that women were older than men across all age groups. Mortality density (Table 1) and disease density (Table 2) were calculated using the frequency rate divided by the corresponding district or city population.
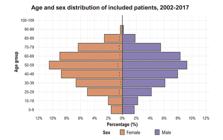
– Age and sex distribution of patients included between 2002 and 2017. Source: tertiary academic hospital.
Software
Statistical analyses were performed using R version 4.3.2 (2023-10-31; “Eye Holes”; R Foundation for Statistical Computing, Vienna, Austria) running on the x86_64-w64-mingw32/x64 (64-bit) platform. The following R packages were used: apyramid, data.table, devtools, dplyr, foreign, ggplot2, ggrepel, gridExtra, here, janitor, lubridate, mapview, pacman, paletteer, R.utils, readxl, rgeoda, scales, scattermore, sf, spdep, stringr, tidyr, and tidyverse. ArcGIS version 10.7 was used for map generation.
Ethical aspects
The study was approved by the human research ethics committee of the tertiary hospital (CAAE: 71179723.8.0000.0068; Approval Number: 6.618.043).
Data access statement
Data access was restricted in accordance with the Brazilian Data Protection Law (LGPD 13.709/2018). Furthermore, the institution established a nondisclosure agreement with the public foundation responsible for mortality data management, prohibiting disclosure of data to third parties. Data analyses were conducted on isolated computers without internet access and protected through multiple authentication layers. Secure encrypted data exchange between institutions occurred through a dedicated infrastructure available only for a limited period and accessible exclusively through temporary credentials. Although raw data cannot be publicly shared, the authors are available to address specific questions from editors or reviewers and are open to local database inspection if required.
Results
We analyzed residential location data from approximately 1.3 million hospital health records. The institutional database stores up to the 20 most recent addresses for each patient, and the most recent registered address was used for the present analyses.
Regarding underlying causes of death, Vargem Grande Paulista showed the highest density of neoplasms. São Paulo and Juquitiba showed the highest density of diseases of the respiratory system. Mairiporã and Taboão da Serra showed the highest density of endocrine, nutritional, and metabolic diseases. São Paulo, Osasco, and Taboão da Serra showed the highest density of diseases of the circulatory system. Ribeirão Pires, Poá, and Guararema showed the highest density of congenital malformations, deformations, and chromosomal abnormalities. Certain conditions originating in the perinatal period were observed exclusively in São Paulo.
Regarding comorbidities, Vargem Grande Paulista showed the highest density of neoplasms. Embu das Artes and Pirapora do Bom Jesus showed the highest density of diseases of the respiratory system. São Lourenço da Serra, Santa Isabel, and São Caetano do Sul showed the highest density of endocrine, nutritional, and metabolic diseases. Itapevi and Suzano showed the highest density of certain conditions originating in the perinatal period. Taboão da Serra and São Paulo showed the highest density of diseases of the circulatory system. Guararema, Vargem Grande Paulista, and Taboão da Serra showed the highest density of congenital malformations, deformations, and chromosomal abnormalities.
Discussion
This study reports a 9-year experience in the analysis of hospital health records from a public tertiary academic referral center located in southeastern Brazil and specialized in cardiovascular and respiratory diseases. The study period covered 2002 to 2017, during which approximately 1.3 million electronic hospital health records were analyzed, and 180,000 deaths were identified during follow-up. The present analysis focused on cities within the metropolitan area of São Paulo.
Long-term mortality information is not routinely available in hospital databases, limiting the ability to monitor patient outcomes after hospital discharge. In addition, hospitals often lack information regarding the interval between the last hospital encounter and death. By linking hospital and mortality data, our study contributes to addressing these limitations and may provide useful information for institutional assessment and health care planning.
A recent publication6 reported that cardiovascular and respiratory diseases accounted for the greatest disability-adjusted life-years in Brazil, followed by chronic and infectious respiratory diseases, with only a small proportion attributable to climate change. These findings are particularly relevant because our study showed that respiratory diseases, both as diagnoses and underlying causes of death, were more frequently observed in cities within the metropolitan area of São Paulo characterized by a large industrial presence and/or intense vehicular traffic. Although climate-related factors were not evaluated in the present study, another recent investigation7 demonstrated the adverse health effects of environmental pollution in Brazil, which is consistent with the spatial distribution observed in our analysis for respiratory diseases at the first hospital visit and as underlying causes of death.
The study Spatial Analysis of Risk Areas of Congenital Anomalies in Brazil, 2012-20218 reported that congenital anomalies in Brazil are predominantly concentrated in the northeastern region of the country, with smaller clusters identified in the state of São Paulo. In contrast, our findings demonstrated a more homogeneous spatial distribution of congenital anomalies across the metropolitan area of São Paulo, without evidence of major clustering patterns.
Another investigation, Noncommunicable Diseases Attributed to Low Levels of Physical Activity in Brazil: An Epidemiologic Global Burden of Disease Study,9 reported a mortality rate of 293.39 deaths per 100,000 inhabitants in Brazil in 2019 attributable to NCDs and conditions associated with low physical activity, with CVDs representing the most prominent contributor.
Similarly, the study The Impact of the Strategic Action Plan to Combat Chronic Noncommunicable Diseases on Hospital Admissions and Deaths From Cardiovascular The impact of the strategic action plan to combat chronic noncommunicable diseases on Hospital Admissions and deaths from cardiovascular diseases in Brazil,10 demonstrated reductions in hospital admissions related to CVD between 2008 and 2019 but highlighted the persistent burden of mortality, particularly among older populations. These findings reinforce the importance of strengthening prevention strategies, monitoring systems, and interventions targeting cardiovascular risk factors.
Strengths and limitations of study
Strengths of this study include the large volume of electronic health records analyzed over an extended period and the potential applicability of these findings to local health care planning and resource allocation for specialized care delivery.
This study also has limitations. As a single-center institutional experience, our findings may not be representative of the broader population of São Paulo or other regions of Brazil. In addition, spatial analyses were based on residential locations rather than workplace locations. We also did not stratify analyses according to age or sex. Finally, disease categorization was based on 6 predefined groups derived from previous institutional findings, and future investigations are warranted to further explore and refine these classifications.
Conclusion
This study presents a spatial analysis of electronic health records from a tertiary public referral hospital covering the period from 2002 to 2017, focusing on the metropolitan area of São Paulo. Central Illustration displays the geographic distribution of diseases of the circulatory system and highlights cities with the highest disease density according to hospital records.
The findings demonstrated marked spatial heterogeneity across cities and districts within the metropolitan region. Vargem Grande Paulista showed the highest density of neoplasms both as underlying causes of death and as comorbidities. In addition, cities with substantial green areas also showed high densities of diseases of the respiratory system. Geographic patterns were also identified for endocrine, nutritional, and metabolic diseases, as well as diseases of the circulatory system, both as underlying causes of death and comorbidities.
Areas with zero recorded cases should be interpreted cautiously, as these findings may reflect event frequencies below cartographic visualization thresholds and/or smaller population sizes in geographically peripheral regions.
Supplemental Materials
Supplementary material
References
-
1 Pan American Health Organization; World Health Organization. Noncommunicable Diseases [Internet]. Washington: PAHO/WHO; 2021 [cited 2026 May 28]. Available from. https://www.paho.org/en/topics/noncommunicable-diseases
» https://www.paho.org/en/topics/noncommunicable-diseases -
2 LeSage K, Borgert AJ, Rhee LS. Time to Death and Reenrollment after Live Discharge from Hospice: A Retrospective Look. Am J Hosp Palliat Care. 2015;32(5):563-7. doi: 10.1177/1049909114535969.
» https://doi.org/10.1177/1049909114535969 -
3 Lederman C, Ferreira JFM, Albuquerque CP, Lima ACP, Barroso LP, Souza JCM, et al. Mortality after Discharge from a Public Tertiary Cardiovascular Referral Hospital. Medicine. 2023;102(16):e33627. doi: 10.1097/MD.0000000000033627.
» https://doi.org/10.1097/MD.0000000000033627 -
4 Sistema Estadual de Análise de Dados. Repositório SEADE: Estimativa da População [Internet]. São Paulo: Fundação SEADE; 2023 [cited 2026 May 28]. Available from. https://repositorio.seade.gov.br/dataset/dc441004-a605-4ba3-97d5-ebafa3ce17fa/resource/c5b1040c-c2c6-4412-8480-a534cdca8be2/download/estimativa_pop_i. 2023.
» https://repositorio.seade.gov.br/dataset/dc441004-a605-4ba3-97d5-ebafa3ce17fa/resource/c5b1040c-c2c6-4412-8480-a534cdca8be2/download/estimativa_pop_i. - 5 Waldvogel BC, Morais LCC, Perdigão ML, Teixeira MLP, Freitas RMV, Aranha VJ. Experiência da Fundação Seade com a aplicação da metodologia de vinculação determinística de bases de dados. Ensaio & Conjuntura. 2019;1-35.
-
6 Sousa TCM, Barcellos C, Barreto ML. The Global Burden of Climate-Sensitive Diseases in Brazil: The National and Subnational Estimates and Analysis, 1990-2017. Popul Health Metr. 2025;23(Suppl 1):29. doi: 10.1186/s12963-025-00385-x.
» https://doi.org/10.1186/s12963-025-00385-x -
7 Buralli RJ, Connerton P. Air Pollution, Health and Regulations in Brazil: Are we Progressing? Cad Saude Publica. 2025;41(3):e00172924. doi: 10.1590/0102-311XEN172924.
» https://doi.org/10.1590/0102-311XEN172924 -
8 Souza S, Carvalho CG, Schuler-Faccini L. Spatial Analysis of Risk Areas of congenital Anomalies in Brazil, 2012-2021. Epidemiol Serv Saude. 2025;34:e20250240. doi: 10.1590/S2237-96222025v34e20250240.en.
» https://doi.org/10.1590/S2237-96222025v34e20250240.en -
9 Maciel EDS, Pontes-Silva A, Figueiredo FWDS, Franco SCA, Quaresma FRP, Nascimento-Ferreira MV. Noncommunicable Diseases Attributed to Low Levels of Physical Activity in Brazil: An Epidemiologic Global Burden of Disease Study. Rev Assoc Med Bras. 2025;71(9):e20250203. doi: 10.1590/1806-9282.20250203.
» https://doi.org/10.1590/1806-9282.20250203 -
10 Silva RAD, Fonseca LGA, Silva JPS, Lima NMFV, Gualdi LP, Lima INDF. The Impact of the Strategic Action Plan to Combat Chronic Non-Communicable Diseases on Hospital Admissions and Deaths from Cardiovascular Diseases in Brazil. PLoS One. 2022;17(6):e0269583. doi: 10.1371/journal.pone.0269583.
» https://doi.org/10.1371/journal.pone.0269583
-
Study Association:
This article is part of the thesis of Doctoral submitted by Carlos Lederman, from Faculdade de Medicina da Universidade de São Paulo.
-
Ethics Approval and Consent to Participate:
This study was approved by the Ethics Committee of the Hospital das Clínicas da Faculdade de Medicina da Faculdade de São Paulo under the protocol number CAAE: 71179723.8.0000.0068. All the procedures in this study were in accordance with the 1975 Helsinki Declaration, updated in 2013.
-
Use of Artificial Intelligence:
The authors did not use any artificial intelligence tools in the development of this work.
-
Availability of Research Data:
Non disclosure agreement signed by Incor and Fundação SEAE; limited access can be granted to anonymized data after specific request to ajmansur@cardiol.br
-
*Supplemental Materials
For additional information, please click here.
-
Sources of Funding:
There were no external funding sources for this study.
Edited by
-
Editor responsible for the review:
Marcio Bittencourt
Non disclosure agreement signed by Incor and Fundação SEAE; limited access can be granted to anonymized data after specific request to ajmansur@cardiol.br

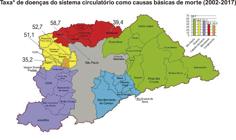
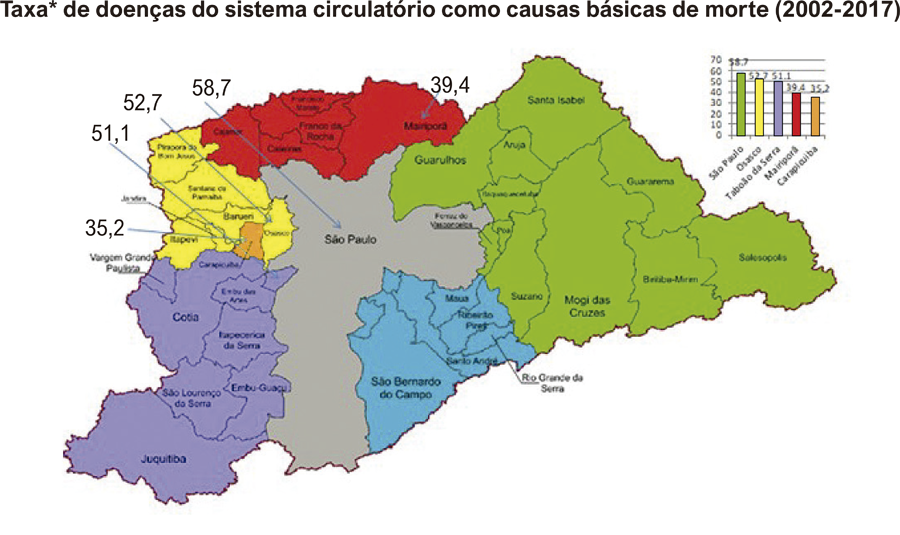 *Taxa = frequência de casos ÷ população × 100.000. EMPLASA: Empresa Paulista de Planejamento Metropolitano; IBGE: Instituto Brasileiro de Geografia e Estatística; IGC: Instituto Geográfico e Cartográfico. Fontes do mapa: áreas urbanas do IBGE, limites administrativos do IGC e sub-regiões da EMPLASA da região metropolitana de São Paulo
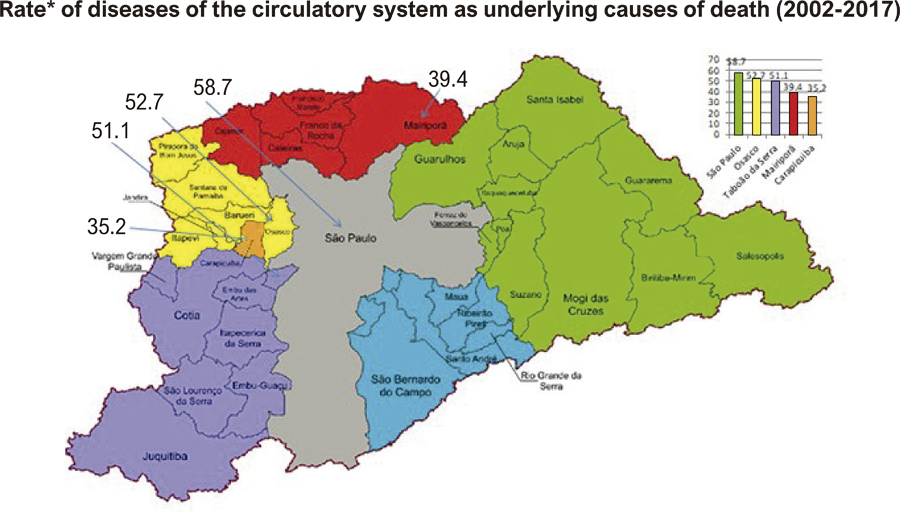 *Rate = case frequency ÷ population × 100,000. EMPLASA: Metropolitan Planning Company of São Paulo; IBGE: Brazilian Institute of Geography and Statistics; IGC: Geographic and Cartographic Institute. Map Sources: IBGE urban areas, IGC administrative boundaries, and EMPLASA subregions of the São Paulo metropolitan area.
