 DNA barcode reveals a new lineage of Astyanax bimaculatus (Linnaeus 1758) in the basins of the Western Northeast Atlantic Region, Brazil
Abstract
Astyanax bimaculatus are small characids known as piabas or lambaris that form a complex encompassing 18 species, including cryptic species. The present study aimed to use DNA barcode to analyze populations of A. bimaculatus found in Maranhão hydrographic basins, comparing molecular diversity indices between populations from the other Brazilian basins. The results revealed the formation of 32 haplotypes (h = 0.9289; π = 0.0523). Seven haplogroups were formed with intrapopulation genetic distance ranging from 0 to 2%. The Maranhão populations of the Western Northeast Atlantic Region basins separated from the other analyzed basins, corroborating with the groups generated in BAPS and with the Bayesian Inference tree. The occurrence of exclusive OTUs for the Maranhão populations of the Western Northeast Atlantic Region was confirmed through delimitation models. Thus, the data from this study provide information on the genetic diversity of the A. bimaculatus complex with the detection of a different lineage for the State of Maranhão, contributing to the understanding of the group’s systematics.
Key words
diversity; mtDNA; neotropical fish; OTU; species complex
INTRODUCTION
The Characidae family belongs to the Characiformes order and boasts the highest species richness, distributed among 240 genera (Fricke et al. 2024). Among them the genus Astyanax Baird & Girard, 1854, classified as Incertae Sedis (Lima et al. 2003), comprises approximately 270 described species (Fricke et al. 2024). Species of the genus Astyanax exhibit morphological similarities, making their identification and phylogenetic relationships challenging (Garutti 1995, Garutti & Langeani 2009, Lucena & Soares 2016).
Astyanax bimaculatus (Linnaeus 1758) are popularly known as “piabas” or “lambaris,” comprising small-sized fish (Tonello & Lui 2022) used for food and bait for catching larger fish (Silva et al. 2011). Within the A. bimaculatus group, specimens share similar morphological characteristics, including a horizontally oval black spot, a black spot on the caudal peduncle, which extends to the end of the median caudal rays, and two dark brown dosal markings in the humeral region (Garutti 1995, Soares 2005, Garutti & Langeani 2009, Lucena & Soares 2016, Cunha et al. 2019).
The A. bimaculatus complex currently comprises 18 described species (Fricke et al. 2024), which can occur sympatrically, exhibiting variation in chromosomal banding patterns, and showing differentiated karyotypic forms (Kavalco et al. 2009, Tenório et al. 2013, Cunha et al. 2019). These species are considered cryptic and are under constant revision using both morphological and molecular aspects for reassessment and description of new species (Gavazzoni et al. 2018).
Taxon discrimination using molecular tools is widely employed to help in taxonomic issues, complementing morphological data (Oliveira et al. 2011, Gomes et al. 2015, Rossini et al. 2016, Tonello & Lui 2022, Silva-Santos et al. 2023). The DNA barcode technique involves the use of a 650-base pair segment of the Cytochrome c Oxidase Subunit I gene and assumes that interspecific variation is greater than intraspecific variation (Hebert et al. 2003), and it has been widely used for taxon discrimitation. Studies employing this technique have successfully contributing to characterize new species (Ramirez et al. 2017, Berbel-Filho et al. 2018, Guimarães et al. 2021).
The work by Rossini et al. (2016) used DNA barcode to highlight the genetic diversity of the Astyanax genus. They analyzed over 1.600 specimens from different hydrographic basins, revealing the complexity of analyzing and identifying species within the genus. They demonstrated that A. bimaculatus species from different Brazilian hydrographic basins (Parnaiba, Amazonas, Xingu, Paraguai, Paraíba do Sul and Acre) and the Orinoco River located in Colombia and Venezuela were delimited into different clades, indicating they could be distinct species. Since these species do not only had a divergence greater than 2% but also belonged to more than one species group, the authors suggested a more detailed review of the species comprising the complex.
Brazil has the largest networks of hydrographic systems in the Neotropical region and hosts a wide diversity of freshwater fish (Brito et al. 2019, Castro & Polaz 2020, Koerber et al. 2022). Studies indicate that biogeographic, geological and/or climatic events may be related to the origin of this megadiversity (Dagosta & Pinna 2017, Abreu et al. 2019, Albert et al. 2020, Cassemiro et al. 2023). The state of Maranhão has a geography that facilitates faunal exchanges between rivers, and it is believed that the processes that connect and separate these river basins contribute to the increase in biological diversity (Wilkinson et al. 2006, Piorski 2010, Albert & Reis 2011, Abreu et al. 2019).
In this context, molecular studies in the fish fauna of Maranhão have provided important data leading to the discovery of new species, clarification of taxonomic doubts, and inference of phylogenetic relationships among the analyzed species/groups (Pires et al. 2020, Nascimento et al. 2023). Guimarães et al. (2020) emphasize the importance of conducting more studies in Maranhão hydrographic basins to understand the diversity within the A. bimaculatus complex.
Given the complexity of analyzing the taxon and considering the existing data in the literature indicating that A. bimaculatus exhibits significant genetic diversity due to being a complex of cryptic species, we aimed to test whether the population of A. bimaculatus from river basins in the State of Maranhão can compose one or more lineages distinct from those already described in the literature, through the use of the DNA barcode technique.
MATERIALS AND METHODS
Study area
The state of Maranhão has an expensive network of river basins composed of 11 basins: Gurupi, Maracaçumé, Itapecuru, Mearim, Munim, Parnaiba, Tocantins, Pericumã, Turiaçu, Preguiças and Periá (Codevasf 2021). The Mearim, Itapecuru and Pericumã river basins are classified within the Atlantic Northeast Western Hydrographic Region and share similar hydrological characteristics. These characteristics result from biogeographical processes responsible for the patterns of dispension and interaction among past biota, these basins have small connections with through marginal lagoons and small rivers, allowing gene flow between the populations of these drainages (Piorski 2010, Abreu et al. 2019).
Collection and storage procedures
The collections were authorized by the Instituto Brasileiro do Meio Ambiente e dos Recursos Naturais Renováveis (IBAMA), with license number 02012.004159/2006, the Instituto Chico Mendes ICMBIO/MMA number 64601-1 of 09/28/2018, and under the license of the Ethics and Animal Experimentation Committee (CEE – Committee of Ethics and Animal Experimentation) of the Universidade Estadual do Maranhão (UEMA), protocol number 47/2022.
They were conducted using fishing gear such as gill nets, seines of various millimeters, and cast nets. Subsequently, the specimens were euthanized by immersion in ice-cold water, placed in plastic bags, and stored in ice for transport to the laboratory. In the laboratory, necessary procedures were performed, including photography, labeling, removal of muscle tissue, which was preserved in 80% alcohol at -20°C, and fixation and preservation of specimens in 10% formalin and 70% alcohol.
Specimen collection
The specimens were deposited at the Laboratório de Biologia Molecular – LABMOL do complexo GENBIMOL, Universidade Estadual do Maranhão - UEMA, Campus Caxias. Five specimens from each basin were deposited at the Museu de Zoologia da Universidade Estadual de Londrina (MZUEL) Paraná, Brasil, for morphological identification and cataloging (MZUEL 17354 – Pericumã River), (MZUEL 17371 – Pindaré River), and (MZUEL 15334 – Mearim River).
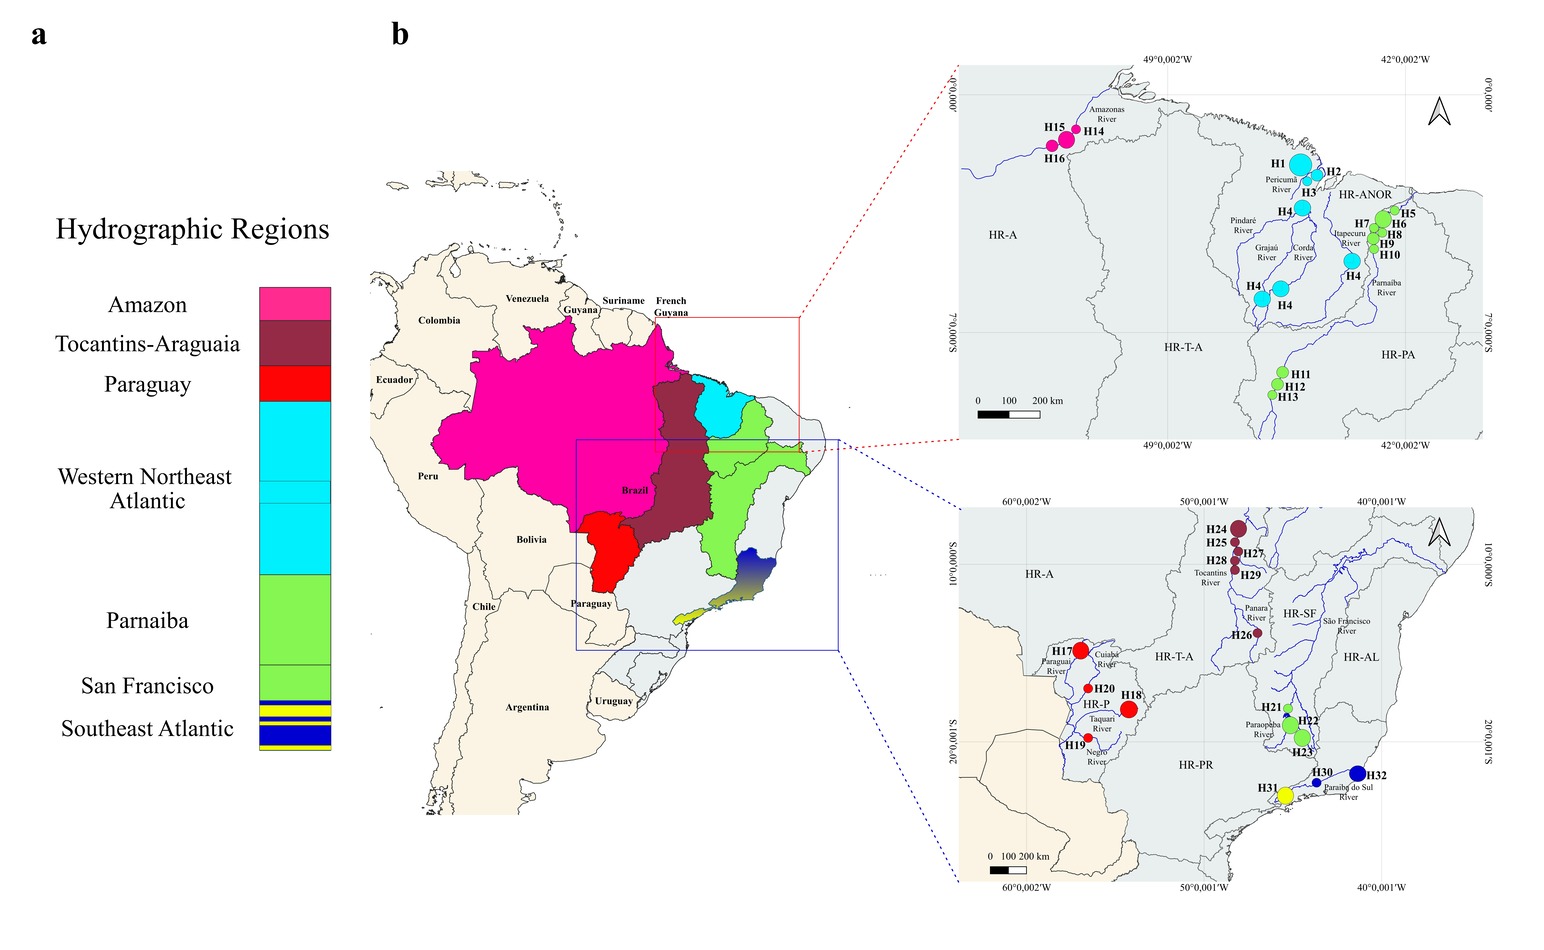
A total of 74 specimens were collected in the Western Northeast Atlantic hydrographic region, corresponding to the basins of the Mearim River (n=30), the Itapecuru River (n=16), and the Pericumã River (n=28). Additionally, 29 specimens from the Parnaiba River basin (Parnaiba River) were included in the study. Totaling 50 sequences generated of the basins Western Northeast Atlantic hydrographic region and the Parnaiba River basin. COI sequences of A. bimaculatus from other Brazilian hydrographic regions: Amazon, Parnaiba, Paraguay, San Francisco, Tocantins, and Southeast Atlantic (Paraíba do Sul) available in Genbank were added for comparison (Figure 1b, Supplementary Material - Table SI). A total of 100 sequences were obtained, comprising 50 sequences from Maranhão’s hydrographic basins and 50 sequences added from Genbank.

a) Genetic population structure analysis of Astyanax bimaculatus across different hydrographic regions, conducted using BAPS 6. b) Geographic distribution map of A. bimaculatus across the sampled Brazilian hydrographic regions in this study, depicting the level of haplotype sharing among the 32 identified haplotypes. The size of circles is proportional to the frequency of haplotypes. Each genetic constitution is represented by a color corresponding to the hydrographic regions depicted on the map: Pink (Amazon); Brown (Tocantins-Araguaia); Red (Paraguay); Light Blue (Western Northeast Atlantic); Green (Parnaiba and San Francisco); Dark Blue and Yellow (Southeast Atlantic).
DNA Extraction, amplification and COI gene sequencing
Total DNA was extracted from small muscle fragments of the specimens using the Promega Wizard Genomic DNA Purification Kit, following the manufacturer’s instructions. The isolation and amplification of the mitochondrial COI gene were carried out using Polymerase Chain Reaction (PCR) with the combination of primers FishF2 and FishR2 described by Ward et al. (2005). The PCR parameters are the same as those used in the work by Rossini et al. (2016).
After amplification, PCR products were visualized on a 1% agarose gel, and positive samples were purified using the ExoSap-IT® kit according to the manufacturer’s instructions. Subsequently, they underwent sequencing reactions following the method of Sanger et al. (1977) using the “Big Dye Terminator v 3.1, Cycle Sequencing Ready Reaction” kit on an ABI 3500 automatic sequencer (Applied Biosystems).
Data analysis
DNA fragments were inspected from chromatograms, edited using the BIOEDIT 7.0 program (Hall 1999), and aligned using default parameters in the Clustal W program (Thompson et al. 1994). The BOLDSystems platform - Barcode of Life Data Systems (Ratnasingham & Hebert 2007), was used to verify the match of newly obtained sequences of A. bimaculatus with stored sequences for this species, adopting a genetic similarity above 99% for primary species identification. Neighbor-Joining (NJ) (Saitou & Nei 1987) and Maximum Likelihood (ML) phylogenetic trees were generated using MEGA X (Kumar et al. 2018), bootstrap analysis (1000 replicas) was used to estimate the significance of clusters (Felsenstein 1985).
The evolutionary model for Bayesian Inference (BI), Neighbor-Joining (NJ) and Maximum Likelihood (ML) trees was determined using JModelTest2 (Darriba et al. 2012), available on the CIPRES Science Gateway v3.3 (Miller et al. 2010). The BI tree was generated using the BEAST v.1.10.4 software (Drummond et al. 2012, Suchard et al. 2018), employing the Hasegawa-Kishino-Yano (HKY+I+G) nucleotide substitution algorithm, a relaxed lognormal clock (Drummond et al. 2006), and the birth-death speciation model (Gernhard 2008). The analysis was based on 50 million MCMC generations. Log files were reviewed to visualize parameter convergence using Tracer v1.6 (Rambaut et al. 2014) and to determine the appropriate burn-in length; convergence was deemed adequate when parameters exhibited an Effective Sample Size (ESS) greater than 200. Subsequently, the tree was summarized using TreeAnnotator v.10.4 (Suchard et al. 2018) to obtain the consensus tree, which was then visualized and edited using Fig Tree v1.4.2 (Rambaut 2014) and the Inkscape program. Clades with strong support had bootstrap percentages (BT) ≥ 98 or a Posterior Probability (PP) = 1.0.
To delimit Operational Taxonomic Units (OTUs), we employed the following methods: ABGD (Automatic Barcode Gap Discovery) (Puillandre et al. 2012), ASAP (Assemble Species by Automatic Partitioning) (Puillandre et al. 2020), the GMYC model (General Mixed Yule-Coalescent) (Fujisawa & Barraclough 2013), and the bPTP model (bayesian Poisson Tree Processes) (Zhang et al. 2013). ABGD was performed using the website: https://bioinfo.mnhn.fr/abi/public/abgd/abgdweb.html with aligned sequence data (Puillandre et al. 2012) as input. ASAP utilized a genetic distance matrix generated in MEGA X as input and was conducted on the web server https://bioinfo.mnhn.fr/abi/public/asap/asapweb.html.
For the GMYC analysis, an ultrametric tree generated in BEAST v1.10.4 was utilized. It was subjected to the ape (Paradis & Schliep 2019), splits (Ezard et al. 2009), MASS (Venables & Ripley 2002), and paran (Dinno 2018), packages available in R Studio v4.1.0 (Venables & Smith 2021). The bPTP analysis used a Maximum Likelihood phylogenetic tree built in RaxML v.8.29 (Stamatakis 2014) and was conducted on the web servers https://raxml-ng.vital-it.ch/#/ and https://species.h-its.org/ for RaxML and bPTP, respectively.
Population genetic structure was inferred using the BAPS 6 program (Corander et al. 2008) employing a population mixture model. Values of k ranged from 4 to 7 to better define genetic groups. Haplotypes were generated using DnaSP 6 (Rozas et al. 2017). Genealogical relationships of haplotypes were determined using the median-joining method implemented in NETWORK 10.2.0.0 (Bandelt et al. 1999). For the Analysis of Molecular Variance (AMOVA) (Excoffier et al. 1992), Arlequin v.3.11 (Excoffier & Heckel 2006) was used. Hydrographic regions identified in the BAPS analysis were considered to detect population differentiation.
RESULTS
Characterization of haplotype diversity and genetic divergence in A. bimaculatus populations from Maranhão
A total of 100 sequences were obtained for the COI gene, comprising 50 sequences from Maranhão’s hydrographic basins and 50 sequences added from Genbank, corresponding to a 636 base pair (bp) fragment, with 515 conserved sites and 121 variable sites. Molecular identification was confirmed by comparing sequences available on the BOLDSystems platform, revealing high levels of similarity ranging from 99.34 to 100%, corroborating morphological identification (Supplementary Material - Table SI).
A total of 32 haplotypes were identified for the grouped populations, with haplotype diversity (h) of 0.9289 and nucleotide diversity (π) of 0.0523. For population analyses, only Maranhão samples was used. The comprehensive list of hydrographic basins employed in this investigation can be found in the Table I. The population from the Parnaiba basin harbored 6 of 9 detected haplotypes showing a h > 0.8000, higher than the diversity index observed the other Maranhão populations, where the Pericumã River basin had haplotype diversity indices lower than 0.5. Low nucleotide diversity rates were found in all populations (Table I).
Cluster analysis and identification of Operational Taxonomic Units (OTUs)
Using all hydrographic regions, the analysis of genetic structuring through Bayesian inference identified seven distinct groups (Figure 1a). Most observed groups were related to their respective hydrogeographic regions: Amazon, Tocantins-Araguaia, Paraguay and Northeastern Atlantic. The groups formed by populations from Parnaiba and San Francisco (Parnaiba + San Francisco) were exception, which grouped into a single genetic group, as well as in the Southeast Atlantic Region in which populations formed two genetic groups (Figure 1b).
The phylogenetic analyses NJ/ML using the HKY model (Figure S1) and BI using the HKY+I+G substitution model (Figure 2) revealed the formation of seven strongly supported subclades (BT ≥ 98% and PP = 1.0). Analyses performed using species delimitation approaches ABGD, ASAP, and GMYC resulted in seven OTUs, while bPTP presented ten OTUs. The Parnaiba and Paraguay basins had their OTUs overestimated in the bPTP method, analyses performed using the ABGD, ASAP and GMYC models were the ones that best subdivided the populations as they generated the same pattern found in the phylogenetic trees and genetic groups in BAPS (Figure 1a).

Bayesian Inference Tree showing the OTU groupings for Astyanax bimaculatus obtained through species delimitation approaches ABGD, ASAP, GMYC, and bPTP, based on the mitochondrial gene COI.
The haplotype network (Figure 3) corroborated with the formation of the seven clades observed in the phylogenetic trees (Figure 2) and the seven genetic groups in BAPS (Figure 1a).

Haplotype network generated in Network for Astyanax bimaculatus from Brazilian hydrographic basins based on the COI gene. Each rectangle represents a haplogroup, and the colors represent the genetic constitution of the populations performed in BAPS; the haplotypes are represented by circles. PER = Pericumã; ITA = Itapecuru; MEA = Mearim; PARN = Parnaiba; AMAZ = Amazon; PARAG = Paraguay; SF = San Francisco; TOC = Tocantins; PARAI = Paraíba do Sul.
The genetic distance matrix revealed low distance values among the identified groups (distance: 0 to 2%), and high values between the groups (distance 4 to 10.6%) (Table II). AMOVA showed high variation among hydrographic regions with statistical indices Φst = 0.908 and significant p values, demonstrating differences between populations (Table III).
Mean genetic distance matrix of genetic T92+G (Tamura 3-parameter) of groups formed for populations of Astyanax bimaculatus from Brazilian hydrographic regions, bold values refer to the average diversity in hydrographic regions.
Molecular Analysis of Variance in hydrographic regions for populations of Astyanax bimaculatus from the mitochondrial COI gene.
DISCUSSION
Astyanax bimaculatus, portrays the information already mentioned, by composing a complex of cryptic species with a wide geographical distribution (Garutti & Langeani 2009, Gavazzoni et al. 2018, Fricke et al. 2024). Phenotypic similarities observed among these species result in identification errors when based solely on morphological aspects. However, the use of molecular markers has proven effective in identifying their representatives, thus complementing traditional methodologies (Pereira et al. 2013).
Populations of A. bimaculatus from Brazilian river basins revealed high values of haplotype diversity, while for Maranhão basins, high values were found for populations from the Mearim River with h = 0.6952 and Parnaiba River with h = 0.8947 (Table I). Similar results were found in the work of Pires et al. (2020) for the Hoplias malabaricus complex from the Turiaçu, Pindaré, Mearim, Itapecuru, and Parnaiba Rivers showing high diversity among haplotypes (h = 0.947), delimiting the species into different lineages. Abreu et al. (2020) also obtained high haplotype diversity indices in populations of Schizodon dissimilis Garman, 1890, and Prochilodus lacustris Steindachner, 1907, from the Parnaiba, Mearim, Itapecuru, and Tocantins basins, where high haplotype diversity indices were found in P. lacustris. Our nucleotide diversity indices were low in all populations of A. bimaculatus analyzed (Table I), corroborating the findings of Abreu et al. (2020), which revealed low nucleotide diversity values for S. dissimilis and P. lacustris.
Studies on the ichthyofauna of Maranhão have consistently noted a close relationship between fish species, as well as the sharing of haplotypes between basins. Greater differentiation has been observed when compared with fish species of the Parnaiba basin (Hubert & Renno 2006, Carvalho-Costa et al. 2011).
That may explain the low genetic distance values were found among major lineages of A. bimaculatus in the Western Northeast Atlantic Region (Table II), indicating little genetic differentiation in these populations. Our results agree with those of Carvalho et al. (2011), who found no genetic divergence between A. lacustris and A. bimaculatus in the San Francisco River basin, and differ from those found by Pereira et al. (2011), who using the same COI molecular marker, reported high values of genetic divergence in A. bimaculatus from the Paraíba do Sul river basin and Gomes et al. (2015) found 2.7% genetic divergence in A. bimaculatus from the Mucuri River basin, showing that these populations have high diversity patterns, considering it as a single taxon.
Therefore, there is no consensus among authors regarding the genetic diversity patterns found in the A. bimaculatus complex, highlighting the need for studies that corroborate existing data in the literature and fill knowledge gaps. The present research provides important information on the genetic variability of A. bimaculatus detecting a different lineage for river basins in Maranhão, providing support for studies involving the complex.
The analysis of data in BAPS 6 (Figure 1a) indicated that there is no genetic structuring in populations of A. bimaculatus from the Pericumã, Itapecuru, and Mearim river basins (Western Northeast Atlantic Region), agreeing with the groups formed in the haplotype network (Figure 3) and the subclades formed in the BI (Figure 2). This analysis also showed genetic structuring in the population of the Paraíba do Sul river basin (Southeast Atlantic Region), agreeing with the delimitation methods employed, which resulted in the formation of two differentiated OTUs, one for haplotype 31 and another OTU that grouped haplotypes 30 and 32.
These data agree with those presented by Pereira et al. (2011), where two clades were formed for A. bimaculatus, showing high genetic diversity. This aligns with the genetic divergence analysis (Table II), which revealed a high divergence value in the Southeast Atlantic Region grouping this population. The authors also compared COI sequences of A. bimaculatus from the Paraíba do Sul River basin with sequences of A. altiparanae from the Alto Paraná basin, demonstrating high genetic similarity between them. This fact may indicate that the samples belong to the same species, which was confirmed by the species delimitation analysis employed in this study. It is important to note that the sequences added here were identified as A. bimaculatus and remained in the analyses because A. altiparanae is part of the A. bimaculatus complex.
The haplotype network demonstrates the formation of a differentiated lineage of A. bimaculatus for the Western Northeast Atlantic Region (Pericumã, Itapecuru, and Mearim River basins), as they formed a specific haplogroup, with no association of haplotypes with the other analyzed basins (Parnaiba, Amazon, Paraguay, San Francisco, Tocantins and Paraíba do Sul) (Figure 3). Between the Maranhão basins Mearim and Itapecuru there was sharing of haplotypes, indicating gene flow in these populations. Abreu et al. (2020) evidenced shared haplotypes between the Mearim/Itapecuru basins for P. lacustris and S. dissimilis, confirming that geographical barriers do not hinder species dispersal and gene flow. Reis et al. (2016) also point to the occurrence of stream captures that perennially unite and separate portions of adjacent river basins, increasing the biological diversity of aquatic organisms, which corroborates with Abreu et al. (2020).
Seven strongly supported subclades were formed with BT ≥ 98 and PP = 1.0 in the NJ/ML trees (Figure S1) and BI (Figure 2). Terán et al. (2020) treated the species composing the A. bimaculatus complex as a monophyletic group, corroborating with the data presented in this study.
An exclusive OTU was identified for the populations of the Western Northeast Atlantic Region in all species delimitation methods employed, strengthening the hypothesis of the existence of a different lineage for A. bimaculatus from Maranhão river basins. Rossini et al. (2016) and Berbel-Filho et al. (2018) reported on the capacity of the GMYC model to separate species, being the method that best represented their analyses. Similarly, ABGD and ASAP were realistic in species delimitation, agreeing with the results found by Nogueira et al. (2021) and García-Melo et al. (2019). In this study these was no conflict among these methods, providing greater accuracy to the analyses performed.
AMOVA (Table III) showed a high percentage (90.8%) of genetic variation among the river basin regions, with a high Φst value of 0.909, demonstrating differences between populations. The same pattern was obtained in the studies of Pires et al. (2020), who confirmed the existence of three lineages of H. malabaricus in Maranhão rivers, with high variation among Maranhão populations with an Fst value of 0.640, and Luz et al. (2015), who detected high fixation indices with an Fst of 0.707 in P. nattereri from river basins in the state of Maranhão.
This study holds paramount significance as it identified the emergence of a novel lineage within the A. bimaculatus complex, discovered within the river basins of Maranhão. Moreover, it furnished fresh insights into the diversity of this cryptic species, thereby enhancing our understanding of the taxonomic intricacies within the group. In light of these findings, we underscore the imperative for additional research endeavors and taxonomic revisions concerning A. bimaculatus, aiming to elucidate the complexities within this species complex.
CONCLUSIONS
The populations of A. bimaculatus from the Maranhão river basins constitute a differentiated lineage from those found in other Brazilian basins, revealing the high genetic diversity of the species. The analysis performed in BAPS confirmed that there is no genetic structuring in the populations of the Western Northeast Atlantic Region. In all delimitation models employed, there was the formation of OTUs that exclusively grouped the Maranhão populations of the Western Northeast Atlantic Region, with no haplotype sharing with the following river basin regions: Parnaiba, San Francisco, Amazon, Paraguay, Tocantins-Araguaia and Southeast Atlantic. The hierarchy tested in AMOVA corroborated with the data presented in BAPS, haplotype network, and BI tree. Thus, the occurrence of a distinct lineage of A. bimaculatus for the Western Northeast Atlantic Region was verified, being considered a separate evolutionary unit from the others found in the literature.
SUPPLEMENTARY MATERIAL
ACKNOWLEDGMENTS
To the Fundação de Amparo à Pesquisa e ao Desenvolvimento Científico e Tecnológico do Maranhão (FAPEMA) for funding the universal project. To the Universidade Estadual do Maranhão (UEMA) for granting the scholarship to Roseane Cássia Galeno Oliveira. To the Laboratório de Biologia Molecular - LABMOL do Complexo GENBIMOL, Universidade Estadual do Maranhão - UEMA, Campus Caxias for the support provided for the development of the research. To ICMBio and IBAMA for authorizing the collections. And to friends and collaborators who helped from molecular techniques to data analysis.
REFERENCES
- ABREU JMS, CRAIG JM, ALBERT JS & PIORSKI NM. 2019. Historical biogeography of fishes from coastal basins of Maranhão State, northeastern Brazil. Neotrop Ichthyol 17: 1982-0224.
- ABREU JMS, WALTZ BT, ALBERT JS & PIORSKI NM. 2020. Genetic differentiation through dispersal and isolation in two freshwater fish species from coastal basins os Northeastern Brazil. Neotrop Ichthyol 18: 1-19.
- ALBERT JS & REIS RE. 2011. Introduction to Neotropical freshwaters. In: Albert JS, Petry P & Reis RE (Eds), Historical biogeography of Neotropical freshwater fishes. Berkeley, CA: University of California Press.
- ALBERT JS, TAGLIACOLLO VA & DAGOSTA F. 2020. Diversification of Neotropical freshwater fishes. Annu Rev Ecol Evol Syst 51: 27-53.
- BAIRD SF & GIRARD CF. 1854. Descriptions of new species of fishes collected in Texas, New Mexico and Sonora. Proc Acad Nat Sci Philadelphia 7: 22-34.
- BANDELT HJ, FORSTER P & ROHL A. 1999. Median-joining networks for inferring intraspecific phylogenies. Mol Biol Evol 16: 37-48.
- BERBEL-FILHO WM, RAMOS TPA, JACOBINA UP, MAIA DJG, TORRES RA & LIMA MQ. 2018. Update Checklist and DNA barcode-based species delimitation reavel taxonomic uncertainties among freshwater fishes from the mid-north-eastern Caatinga ecoregion, noth-eastern Brazil. J Fish Biol 93: 311-323.
- BRITO PS, GUIMARÃES EC, FERREIRA BRA, OTTONI FP & PIORSKI NM. 2019. Freshwhater fishes of the Parque Nacional dos Lençóis Maranhenses and adjacente areas. Biota Neotrop 19: 1676-0611.
- CARVALHO DC, OLIVEIRA DAA, POMPEU PS, LEAL CG, OLIVEIRA C & HANNER R. 2011. Deep barcode divergence in brazilian freshwater fishes: the case of the São Francisco River basin. Mitochondrial DNA 22: 80-86.
- CARVALHO-COSTA LF, PIORSKI NM, WILLIS SC, GALETTI PM JR & ORTÍ G. 2011. Molecular systematics of the neotropical shovelnose catfish genus Pseudoplatystoma Bleeker 1862 based on nuclear and mtDNA markers. Mol Phylogenet Evol 59: 177-194.
- CASSEMIRO FAS ET AL. 2023. Landscape dynamics and diversification of the megadiverse South American freshwater fish fauna. Proc Natl Acad Sci 120: 1-10.
- CASTRO RMC & POLAZ CNM. 2020. Small-sized fish: the lagest and most threatened portion of the megadiverse neotropical freswater fish fauna. Biota Neotrop 20: 1-12.
-
CODEVASF - COMPANHIA DE DESENVOLVIMENTO DOS VALES DO SÃO FRANCISCO E DO PARNAÍBA. 2021. Acessed (July 2022). Available in: https://www.codevasf.gov.br/area-de-atuacao/bacia-hidrografica/demais-bacias-do-estado-do-maranhao
» https://www.codevasf.gov.br/area-de-atuacao/bacia-hidrografica/demais-bacias-do-estado-do-maranhao - CORANDER J, SIRÉN J & ARJAS E. 2008. Bayesian spatial modeling of genetic population struture. Comput Stat 23: 111-129.
- CUNHA MS, FREGONEZI AR, FAVA L, HILSDORF AWS, CAMPOS LAO & DERGAM JA. 2019. Phylogeografy and historical biogeografy of the Astyanax bimaculatus species complex (Teleostei: Characidae) in coastal southeastern South America. Zebrafish 00: 1-13.
- DAGOSTA FCP & PINNA M. 2017. Biogeography of Amazonian fishes: Deconstructing river basins as biogeographic units. Neotrop Ichthyol 15: 1-24.
- DARRIBA D, TABOADA GL, DOALLO R & POSADA D. 2012. JModelTest2: more models, new heuristics and parallel computing. Nat Methods 9: 772.
- DINNO A. 2018. Exploring the Sensitivity of Horn’s Parallel Analysis to the Distributional Form of Simulated Data. Multivariate Behav Res: 362-388.
- DRUMMOND AJ, SIMON YW, PHILLIPS M J & RAMBAUT A. 2006. Relaxed Phylogenetics and Dating with Confidence. PLoS Biol 4: 1-14.
- DRUMMOND AJ, SUCHARD AM, XIE D & RAMBAUT A. 2012. Bayesian phylogenetics with BEAUti and the BEAST 1.7. Mol Biol Evol 29: 1969-1973.
- EXCOFFIER L & HECKEL G. 2006. Computer programs for population genetics data analysis: a survival guide. Nat Rev Genet 7: 745-758.
- EXCOFFIER L, SMOUSE PE & QUATTRO JM. 1992. Analysis and Molecular Variance Inferred From Metric Distance Among DNA Haplotypes: Application to Human Mitochondrial DNA Restriction Data. Genetics 131: 479-491.
-
EZARD T, FUJISAWA T & BARRACLOUGH TG. 2009. SPLITS: Limites de Espécies por Estatísticas de Limiar. Versão do pacote R 1.0-18/r45. Avaiable at: http://R-Forge.R-project.org/projects/splits/ (Acessed January 2023).
» http://R-Forge.R-project.org/projects/splits/ - FELSENSTEIN J. 1985. Confidence limits on phylogenies: An approach using the bootstrap. Evolution 39: 783-791.
-
FRICKE R, ESCHMEYER WN & VAN DER LAAN R. 2024. Eschmeyer’s Catalog of Fishes: Genera, Species. Available at http://researcharchive.calacademy.org/research/ichthyology/catalog/fishcatmain.asp (Acessed January 2024).
» http://researcharchive.calacademy.org/research/ichthyology/catalog/fishcatmain.asp - FUJISAWA T & BARRAGLOUGH TG. 2013. Delimiting species using single-locus data and the Generalized Mixed Yule Coalescent approach: A revised method and evaluation on Simulated Data Sets. Syst Biol 62: 707-724.
- GARCÍA-MELO JE, OLIVEIRA C, SILVA GJC, OCHOA-ORREGO LE, PEREIRA LHG & MALDONADO-CAMPO JA. 2019. Species delimitation of neotropcial Characins (Stevardininae): Implications for taxonomy of complex groups. PLoS ONE 14: 1-15.
- GARUTTI V. 1995. Revisão taxonômica dos Astyanax (Pisces, Characidae), com mancha umeral ovalada e mancha no pedúnculo caudal, estendendo-se à extremidade dos raios caudais medianos, das Bacias do Paraná, São Francisco e Amazônica [tese]. São José do Rio Preto (SP):Universidade Estadual Paulista, Instituto de Biociências, Letras e Ciências Exatas. (Unpublished).
- GARUTTI V & LANGEANI F. 2009. Redescription of Astyanax goyacensis Eigenmann, 1908 (Ostariophysi: Characiformes: Characidae). Neotrop Ichthyol 7: 371-376.
- GAVAZZONI M, PAIZ LM, OLIVEIRA CAM, PAVANELLI CS, GRAÇA WJ & MARGARIDO VP. 2018. Morphologically cryptic species of the Astyanax bimaculatus “caudal penduncule spot” subgroup diagnosed through cytogenetic characters. Zebrafish 15: 1-7.
- GERNHARD T. 2008. The conditioned reconstruted process. J Theor Biol 253: 769-780.
- GOMES LC, PESSALI TC, SALES NG, POMPEU PS & CARVALHO DC. 2015. Integrativey taxonomy detects cryptic and overlooked fish species in a neotropical river basin. SprigerLink 143: 581-588.
- GUIMARÃES EC, BRITO PS, GONÇALVES CS & OTTONI FP. 2020. Na inventory of ichthyoufauna of the Pindaré river drainage, Mearim River basin, Northeastern Brazil. Biota Neotrop 20: 1-13.
- GUIMARÃES KLA, ROSSO JJ, GONZÁLEZ-CASTRO M, SOUZA MFB, ASTARLOA JMD & RODRIGUES LRR. 2021. A new species of Hoplias malabaricus species complex (Characiformes: Erithridinae) from the Crepori River, Amazon basin, Brazil. J Fish Biol 100: 425-443.
- HALL TA. 1999. BioEdit: a user-friendly biological sequence alignment editor and analysis program for Windows 95/98/NT. Nucleic Acids Symp Ser 41: 95-98.
- HEBERT PDN, CYWINSKA AC, BALL SL & DE WAARD JR. 2003. Biological identifications through DNA barcodes. Proc Biol Sci 270: 313-321.
- HUBERT N & RENNO JF. 2006. Historical biogeography of South Amarican freswater fishes. J Biogeogr 33: 1414-1436.
- KAVALCO KF, BRANDÃO KO, PAZZA & ALMEIDA-TOLEDO LF. 2009. Astyanax hastatus Myers, 1928 (Teleostei, Characidae): A new species complex within the genus Astyanax? Genet Mol Biol 32: 477-483.
- KOERBER S, GUIMARÃES EC, BRITO PS, BRANGANÇA PHN & OTTONI FP. 2022. Checklist of the freswater fishes of Maranhão, Brasil (CLOFFBR-MA). Ichthyological contribuitions of pesces criollos 79: 1-94.
- KUMAR S, STECHER G, LI M, KNYAZ C & TAMURA K. 2018. MEGA X: Molecular Evolutionary Genetics Analysis across Computing Platforms. Mol Biol Evol 35: 1547-1549.
- LIMA FCT ET AL. 2003 Genera Incertae Sedis in Characidae. In: Reis RE, Kullander SO & Ferraris CJ (Eds), Check list of the freshwater fishes of South and Central America (CLOFFSCA), Porto Alegre, 742 p.
- LUCENA CAS & SOARES HG. 2016. Review of species of the Astyanax bimaculatus “caudal peduncle spot” subgroup sensu Garutti e Langeani (Characiformes, Characidae) from the rio La Plata and rio São Francisco drainages and coastal systems of Southern Brazil and Uruguay. Zootaxa 4072: 101-125.
- LUZ LA, REIS LL, SAMPAIO I, BARROS MC & FRAGA E. 2015. Genetic differentiation in the populations of red piranha, Pygocentrus nattereri Kner, (1860) (Characiformes: Serrasalminae), from the river basins of northeastern Brazil. Braz J Biol 75: 78-94.
- MILLER MA, PFEIFFER W & SCHWARTZ T. 2010. Creating the CIPRES Science Gateway for inference of large phylogenetic trees. In Proceedings of the Gateway Computing Environments Workshop, New Orleans, p. 1-8.
- NASCIMENTO MHS, ARAGÃO DG, SILVA JLN, LIMA RC, BIRINDELLI JLO, FRAGA EC & BARROS MC. 2023. The DNA barcode reveals cryptic diversity and a new record for the genus Leporinus (Characiformes, Anostomidae) in the hydrographic basins of central northean Brazil. PeerJ 11: 1-21.
- NOGUEIRA AF, OLIVEIRA C, LANGEANI F & NETTO-FERREIRA AL. 2021. Molecular species delimitation of the genera Anodus, Argonectes, Bivibranchia and Micromischodus (Ostariophysi: Characiformes). Neotrop Ichthyol 19: 1-15.
- OLIVEIRA C, AVELINO GS, ABE KT, MARIGUELA TC, BENINE RC, ORTÍ G, VARI RP & CORREIA E CASTRO RM. 2011. Phylogenetic relationships within the speciose family Characidae (Teleostei: Ostariophysi: Characiformes) based on multilocus analysis and extensive ingroup sampling. BMC Evol Biol 11: 1-25.
- PARADIS E & SCHLIEP K. 2019. “ape 5.0: an environment for modern phylogenetics and evolutionary analyses in R.” Bioinformatics 35: 526-528.
- PEREIRA LHG, HANNER R, FORESTI F & OLIVEIRA C. 2013. Can DNA barcoding accurately discriminate megadiverse Neotropical freshwater fish fauna? BMC Genet 14: 1-14.
- PEREIRA LHG, MAIA GMG, HANNER R, FORESTI F & OLIVEIRA C. 2011. DNA barcodes discriminate freshwater fishes from the Paraíba do Sul River Basin, São Paulo Brazil. Mitochondrial DNA 22: 71-79.
- PIORSKI NM. 2010. Diversidade genética e filogeografia das espécies Hoplias malabaricus (Bloch, 1794) e Prochilodus lacustris Steindachner, 1907 no Nordeste do Brasil. [PhD Thesis]. São Carlos, SP: Universidade Federal de São Carlos.
- PIRES WMM, BARROS MC & FRAGA EC. 2020. DNA barcoding unveils cryptic lineages of Hoplias malabaricus from Nordesthern Brazil. Braz J Biol: 1-11.
- PUILLANDRE N, BROUILLET S & ACHAZ G. 2020. ASAP: assemble species by automatic partitioning. Mol Ecol Resour 21: 609-620.
- PUILLANDRE N, LAMBERT A, BROUILLET S & ACHAZ G. 2012. ABGD. Automatic Barcode Gap Discovery for primary species delimitation. Mol Ecol 21: 1864-1877.
-
RAMBAUT A. 2014. FigTree v1.4.2. Available in: http://tree.bio.ed.ac.uk/software/figtree
» http://tree.bio.ed.ac.uk/software/figtree -
RAMBAUT A, SUCHARD MA, XIE D & DRUMMOND AJ. 2014. Tracer v1.6. Available in: http://tree.bio.ed.ac.uk/software/tracer/
» http://tree.bio.ed.ac.uk/software/tracer/ - RAMIREZ JL, BIRINDELLI JL, CARVALHO DC, AFFONSO PRAM, VENERE PC, ORTEGA H, CARRILO-AVILA M, RODRIGUEZ-PULIDO JA & GALLETI JR PM. 2017. Revealing Hidden Diversity of the Underestimated Neotropical Ichthyofauna: DNA Barcoding in the Recently Described Genus Megaleporinus (Characiformes: Anostomidae). Front Genet 8: 1-11.
- RATNASINGHAM S & HEBERT PDN. 2007. BOLD. The barcode of Life Data System (www.barcodinglife.org). Mol Ecol Notes 7: 355-364.
- REIS RE, ALBERT JS, DARIO FD, MINCARONE M, PETRY P & ROCHA LA. 2016. Fish biodiversity and conservation in South America. J Fish Biol 89: 12-47.
- ROSSINI BC, OLIVEIRA CAM, GONÇALVES-MELO FA, BERTACO VA, ASTARLOA JMD, ROSSO JJ, FORESTI F & OLIVEIRA C. 2016. Highlighting Astyanax species diversity through DNA Barcoding. PLoS ONE 11: 1-20.
- ROZAS J, FERRER-MATA A, SÁNCHEZ-DELBARRIO JC, GUIRAO-RICO S, LIBRADO P, RAMOS-ONSINS SE & SÁNCHEZ-GARCIA A. 2017. DnaSP 6: DNA Sequence Polymorphism Analysis of Large Datasets. Mol Biol Evol 34: 3299-3302.
- SAITOU N & NEI M. 1987. The neighbor-joining method: A new method for reconstructing phylogenetic trees. Mol Biol Evol 4: 406-425.
- SANGER F, NICHLEN S & COULSON AR. 1977. DNA sequencing with chain termination inhibitors. Proc Natl Acad Sci USA 74: 5463-5467.
- SILVA NJR, LOPES MC, FERNANDES JBK & HENRIQUES MB. 2011. Caracterização dos sistemas de criação e da cadeia produtiva do lambari no estado de São Paulo, Brasil. Informações Econômicas 41: 17-28.
- SILVA-SANTOS R, MACHADO CB, ZANATA AM, CAMELIER P, GALETTI JR PM & FREITAS PD. 2023. Molecular characterization of Astyanax species (Characiformes: Characidae) from the upper Paraguaçu River basin, a hydrographic system with high endemism. Neotrop Ichthyol 21: 1-19.
- SOARES EC. 2005. Peixes do Mearim, Fish of the Mearim River. Instituto Geia: São Luís, 143 p.
- SUCHARD MA, LEMEY P, BAELE G, AYRES DL, DRUMMOND AJ & RAMBAUT A. 2018. Bayesian phylogenetic and phylodynamic data integration using BEAST 1.10. Virus Evol 4: 1-5.
- STAMATAKIS A. 2014. RAxML Version 8: A Tool for Phylogenetic Analysis and PostAnalysis of Large Phylogenies. Bioinformatics 30: 1312-133.
- TENÓRIO RCCO, VITORINO CA, SOUZA IL, OLIVEIRA C & VENERE PC. 2013. Comparative cytogenetics in Astyanax (Characiformes: Characidae) with focus on the cytotaxonomy of the group. Neotrop ichthyol 11: 553-564.
- TERÁN GE, BENITEZ MF & MIRANDE M. 2020. Opening the Trojan horse: phylogeny of Astyanax, two new genera and resurretion of Psalidodon (Teleostei: Characidae). Zool J Linn Soc 190: 1217-1234.
- THOMPSON JD, HIGGINS DG & GIBSON TJ. 1994. Clustal W Improving the sensitivity of progressive multiple sequence alignment through sequence weighting, positions specific gap penalties and weight matrix choice. Nucleic Acids Res 22: 4673-4680.
- TONELLO S & LUI RL. 2022. High rDNA polymorphisms in Astyanax lacustris (Characiformes: Characidae): new insights about the cryptic diversity in A. bimaculatus species complex with emphasis on the Paraná River basin. Neotrop Ichthyol 20: 1-19.
- VENABLES WN & RIPLEY BD. 2002. Modern Applied Statistics with S, 4th ed., New York: Springer Link, 504 p.
- VENABLES WN & SMITH DM. 2021. The R core team. R version 4.1.0 patched. R: A programming environment for data analisys and graphics. Vienna: The Fundation of Statistical Computing, 144 p.
- WARD RD, ZEMLAK TS, INNES BH, LAST PR & HEBERT PDN. 2005. DNA barcoding Australia’s fish species. Phil Trans R Soc Biol Sci 360: 1847-1857.
- WILKINSON MJ, MARSHALL LG & LUNDBERG JG. 2006. River behavior on megafans and potential influences on diversification and distribution of aquatic organisms. J South Am Earth Sci 21: 151-172.
- ZHANG J, KAPLI P, PAVLIDIS P & STAMATAKIS A. 2013. A general species delimitation method with applications to phylogenetic placements. Bioinformatics 29: 2869-2876.