 Invasive plant and honeybee alter native plant-pollinator network structure in dry forest
Abstract
Invasive species pose a critical threat to ecosystems, with far-reaching consequences. Invasive plants can directly interact with native pollinators, while wind-pollinated grasses indirectly alter plant-pollinator networks by reshaping the composition of plant and animal communities, diminishing ecosystem functioning. Here, we investigated the effect of invasive grass on pollinator richness, native plant visits, and the structure of plant-pollinator networks. Additionally, we explored the influence of non-native honeybees on these same variables in the Caatinga. Invasive grass negatively affected native pollinators and reduced visitation to native plants. The dominance of invasive grass leads to an increased niche overlap among native pollinators. Surprisingly, this did not affect the number of visits by non-native honeybees. However, the increased honeybee visitation negatively impacted native pollinator richness, causing a 60% decline. Our results underscore the compounded negative effects of invasive grass and non-native honeybees on native plant-pollinator dynamics. Invasive grasses indirectly decrease pollinator visits by altering plant communities. Meanwhile, honeybees, unaffected by invasive grass, decrease native pollinator species’ richness and visitation rates. These findings emphasize the significant impact of biological invasions on ecosystem health, shedding light on the complex interplay between invasive species and plant-pollinator interactions in arid, abandoned landscapes.
Key words
biological invasions; forest health; ecosystem service; Megathyrsus maximus; pollination
INTRODUCTION
Biological invasion is one of the most critical human-induced disturbances, reshaping biological communities worldwide (Laurance et al. 2002, 2014, Clark & Covey 2012). Invasive species often alter community structure and reduce native species richness, leading to biotic homogenization (Lôbo et al. 2011). Consequently, the biological invasion could drive changes in interactions between mutualistic partners, such as pollinators and plants (Ghazoul 2004, Leal et al. 2014, but see Bartomeus et al. 2008). Invasive plants can alter pollinators’ behavior by changing trait composition in the community (Bezemer et al. 2014). For instance, invasive flowering species may act as magnet species for pollinators and decrease visitation rates in neighboring native plants when they are phenotypically similar and/or phylogenetically related (Morales & Aizen 2006, Cuadra-Valdés et al. 2021). Invasive plants that do not directly interact with pollinators (e.g., wind-pollinated species, such as grasses) may also indirectly decrease visitation rates and the number of native pollinator species by reducing the density of native flowers through competition with co-occurring plants (Kaiser-Bunbury et al. 2017). These negative impacts of invasive on native species may be ubiquitous in human-dominated landscapes (Laurance et al. 2002, 2014, Clark & Covey 2012). The ability of ecosystems to recover from disturbances ultimately depends on the biodiversity present and ecological interactions that take the ecosystems out of disturbed states (Díaz et al. 2019). Therefore, assessing both the direct and indirect effects of invasive species on regenerating ecosystems is key to understanding the ability of ecosystems to self-recover from disturbance.
Introducing grasses as pasture for cattle ranching is a widespread practice around the world, and such practice may affect native species and ecosystems (e.g., Pivello et al. 1999, Marshall et al. 2012). Replacing natural habitats with invasive grasses affects critical ecosystem features such as nutrient stocks and soil retention/erosion (Yang et al. 2020). Furthermore, the capacity of abandoned and degraded areas to recover will depend on the duration and intensity of agriculture and cattle ranching practices (Sobrinho et al. 2016). For this, pollinators are crucial because they have an impact on seed sets and, therefore, on vegetation regeneration and dynamics (Neuschulz et al. 2016). The herbaceous stratum is the first to compete with invasive grass after land abandonment. Its early response can determine the effects of plant invasion on the regeneration process (Flory & Clay 2010). Previous studies suggest that invasive plants can change the behavior and performance of native insects which, in turn, affects the reproductive success of native plants (Schweiger et al. 2010, Bezemer et al. 2014). For instance, the invasive shrub Cytisus scoparius indirectly modifies the foraging behavior of native bees by altering the abundance and availability of floral resources from native plants (Gillespie & Elle 2018). This can hamper the regeneration of abandoned pastures due to the lack of seeds and slow down the recovery of the native herbaceous layer.
Novel plant-animal interactions following species invasions may disrupt native mutualistic communities, modifying network structure (interaction patterns displayed by a set of interacting species) in three main ways: 1) changes the species interactions structure; 2) changing in the frequency and number of these interactions; and 3) changes in the function that the species play within the network (Geslin et al. 2017, Traveset & Richardson 2014, Vizentin-Bugoni et al. 2019). One way to investigate whether interaction network structure can be altered by invasive species is by studying their effects on network complexity, by measuring network complementary specialization, modularity, and nestedness. Complementary specialization measures the extent of partner sharing in the whole network, describing the complementarity (or exclusiveness) of interactions (Blüthgen et al. 2010), while modularity quantifies the existence of subsets of species interacting more among themselves than with other species in the community, leading to the emergence of modules of highly connected species (Dormann & Strauss 2014). In addition, networks may be nested if species with fewer partners (specialists) interact with identifiable subsets of the species interacting with more partners (generalists) (AlMeida-Neto et al. 2008).
Most studies have demonstrated that pollination networks dominated by native species are nested, reflecting interactions where poorly connected species interact exclusively with few highly connected partners (generalists), while generalist partners interact also among themselves (Bascompte et al. 2003, Ponisio et al. 2019). However, the impact of the invasive species on mutualistic network structures is still debated (Stout & Casey 2014, Vizentin-Bugoni et al. 2019) and may be context-dependent. Previous findings suggest that invasive plants decrease native plant richness, leading to smaller and more connected plant-pollinator networks, which reduces complementary specialization and modularity by altering interaction patterns (Stout & Casey 2014). The effect of invasive plants on nestedness, in turn, has been found to be context-dependent with nestedness decreasing when the invasive plants attract few pollinators (e.g., Albrecht et al. 2014) but increasing when the plant is a super-generalist that interacts with many native species (Aizen et al. 2009). Likewise, super-generalist pollinators may increase nestedness by becoming central players in the network, out-competing rare pollinators of rare native plants (Valido et al. 2019). These preliminary results denote the importance of network structure metrics in the evaluation of the community assembly and reinforce the need for more empirical studies to advance the understanding of the potential impacts of invasive species on network structure and ecosystem functioning (Parra-Tabla & Arceo-Gómez 2021).
In this study, we used a long-term ecological experimental area established in the Brazilian seasonally dry tropical forest to understand how plant and insect invasions affect pollinator richness and plant-pollinator network structure (i.e., complementary specialization, modularity, and nestedness). Specifically, we established a blocked experimental design distributed across 0.5 hectares, using 30 plots (6m x 6m) based on invasive grass cover to answer the following questions: (1) How does the invasive grass Megathyrsus maximus (Jacq.) B.K. Simon and S.W.L. Jacobs affect native pollinator richness, visitation rate of native pollinators and plant-pollinator network structure (i.e., complementary specialization, modularity, and nestedness); (2) What is the effect of an invasive grass on invasive honeybee visitation rate; and (3) How does the dominance of invasive honeybee affect native pollinator richness and native flower visitation rate.
MATERIALS AND METHODS
The Caatinga socioecological system
The Brazilian Caatinga, the largest seasonal dry forest in the Americas, experiences frequent disturbances linked to agricultural practices, particularly cattle ranching (Melo 2017). One of the major negative pressure is the land abandonment, due to poor soil management and nutrient depletion, associated to shifting cultivation and failed efforts to establish pastures with invasive forage grasses (Almeida et al. 2015, Silva et al. 2018). Despite that, the Caatinga domain hosts the richest flora diversity of the seasonally dry tropical forests worldwide, with 3,150 species of flowering plants, and ca. 23% of endemic species (Silva et al. 2018). The invasive grass Megathyrsus maximus is widely used for feeding cattle and often dominates the herbaceous stratum even after pastures are abandoned and regeneration begins. Moreover, the non-native bee Apis mellifera Linnaeus, 1758 is typically used by many local beekeepers in this dry forest (Alves et al. 2019, Rymer et al. 2005) and, importantly, it has a mixed effect on native plants varying from negative to positive (Alves et al. 2019). Many studies argue this non-native bee is a super-generalist pollinator that monopolizes most floral resources (Valido et al. 2019), negatively affecting both native pollinators and plants (Bartomeus et al. 2008). Such combined effects of land-use history and natural characteristics make the Caatinga a highly resilient system (Barros et al. 2021, Silva et al. 2018). However, the prevalence of the invasive grass associated with the establishment of Apis mellifera may decrease Caatinga resilience by altering the plant-pollinator interaction network and reducing the plant and pollinator species richness. Furthermore, the combined effect of invasive plants and pollinators on plant-pollinator networks is poorly understood, limiting the understanding of their potentially compounding effects.
Study site and organisms
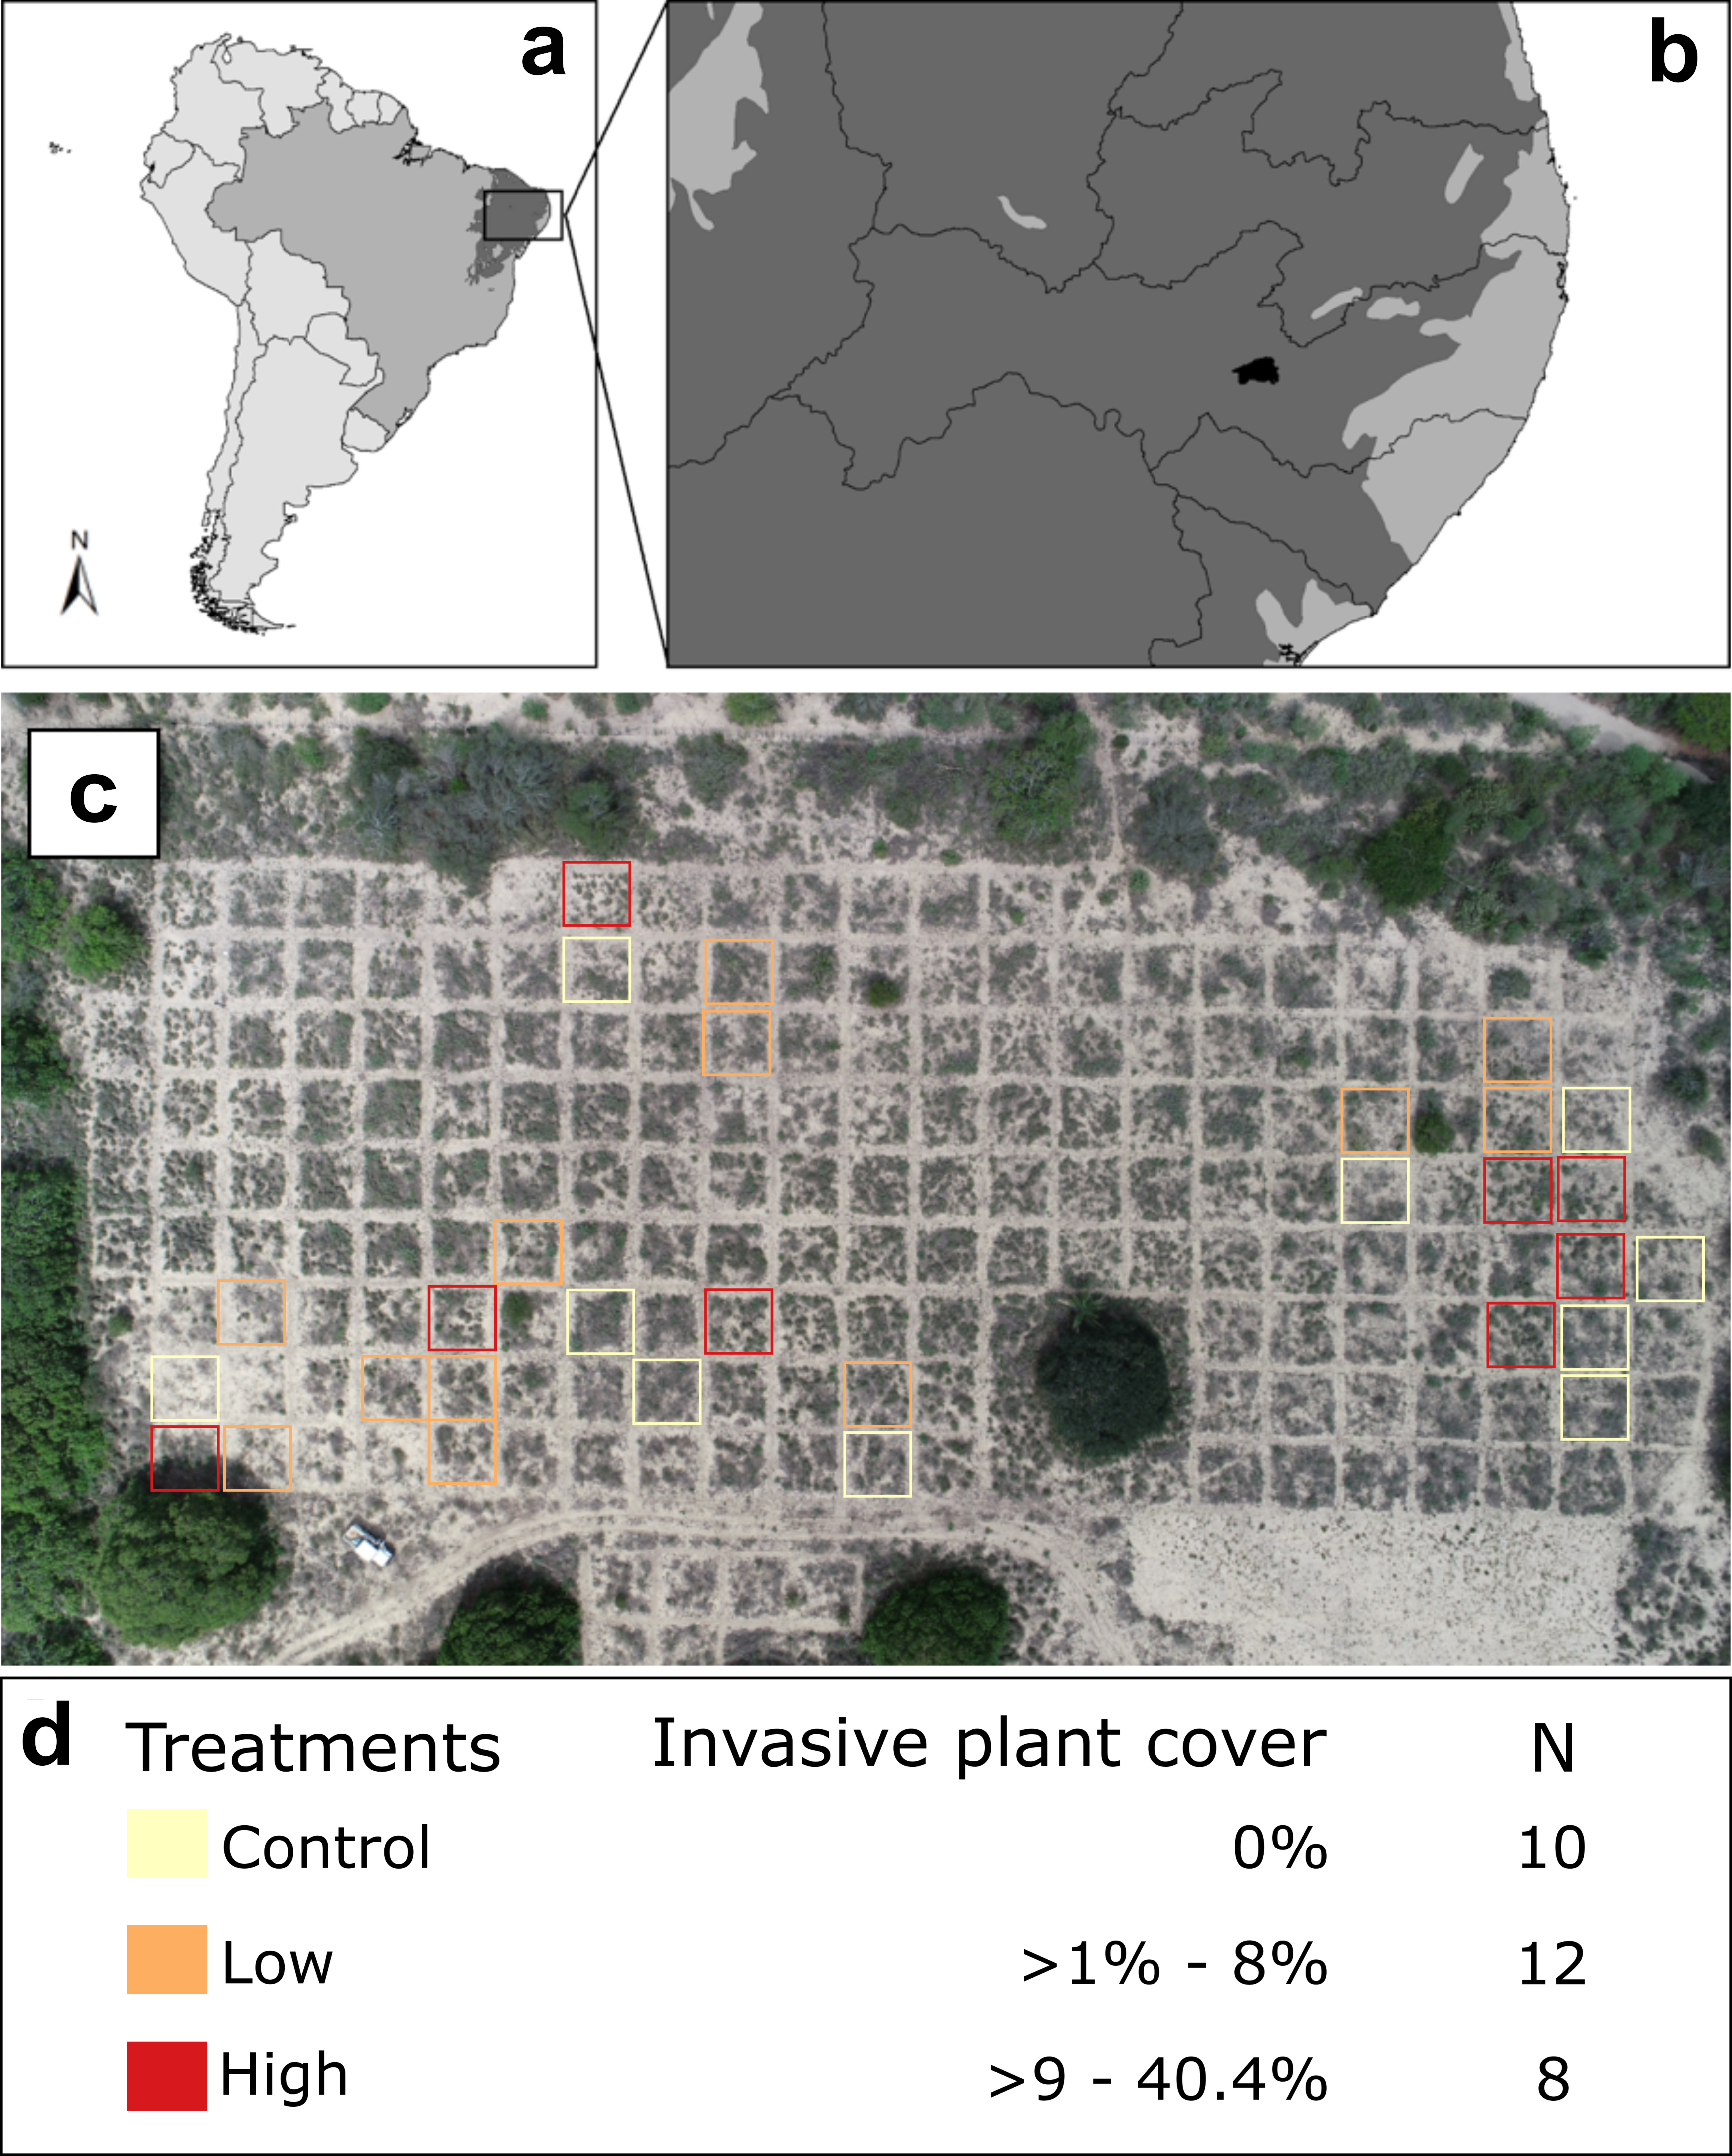
Data collection took place in an experimental restoration module at Catimbau National Park (8°24’00” to 8°36’35” S and 37°09’30” to 37°14’40” W) at the Brazilian Caatinga, a Seasonally Dry Tropical Forest located in the semiarid region of Northeastern Brazil (Figure 1). Caatinga is the largest continuous dry forest ecosystem in the world and the most densely populated (Leal et al. 2005). Its vegetation comprises a mosaic of xerophytic, deciduous, semi-arid thorny shrubs, and seasonally dry tropical forests (MMA 2011). The average annual temperature is 23 °C and average annual rainfall ranges from 480 to 1,100 mm, with irregular rainy seasons. Caatinga areas have been extensively used by humans often causing soil depletion and the introduction of invasive plants (Leal et al. 2015). Invasive plant species associated with local economic activities now represent 33.6% of plant species in Caatinga (Almeida et al. 2015, Melo 2017).

Study landscape and experimental design. Maps indicate the study site location in the Brazilian Caatinga – in grey (a), the Catimbau National Park (small black filled polygon) of 62,3 km2 embedded in the Caatinga domains (b). The panel (c) illustrate the stratified random sampling design based on blocks with three distinct non-native dominance (control – yellow squares, low non-native dominance – orange squares and high non-native dominance – red squares) and the number of plots per treatments (N). Plots measuring 36m² (6m x 6m) were 1m distant from each other.
The experimental site is composed of plots with native species that naturally occur in the system and a variable cover of the invasive grass Megathyrsus maximus, forming an unmanipulated gradient of invasion (see in the Experimental Design section). This grass was cultivated for livestock ranching in the area until its abandonment in early 2000 after the Catimbau National Park was implemented (personal communication with residents and the park staff). M. maximus is an African wild grass, resistant to drought; pollinated and dispersed by wind despite solitary bees occasionally visiting its flowers (Immelman & Eardley 2008). This species is invasive in other dry tropical forests such as in Hawaii and Bolivia (Ammondt et al. 2013, Veldman et al. 2009). It has a high capacity to spread both by itself and indirectly through human activities; therefore, it sometimes dominates large areas, altering native species survival, growth, and reproduction (Rojas-Sandoval & Meléndez-Ackerman 2012, Rojas-Sandoval et al. 2016). However, its invasive potential in the Caatinga is poorly understood despite being commonly used as forage for cattle.
Experimental design
We established a grid containing 182 plots (6 m x 6 m, 1 m distant from each other) in a blocked experimental design distributed across 0.5 hectares. Prior to choosing the study plots, we used a drone to take high-resolution aerial pictures to estimate the percentage of invasive species that covered each plot. We calculated the ground cover of M. maximus of each plot and native plant cover (Figure 1) using aerial images made with the drone DJI Phantom 4 pro®. Flights were performed with 75% front and lateral image overlap using the free DroneDeploy® autonomous flight system. We then used those images to build orthomosaics for analysis through WebODM and ImageJ software (Rueden et al. 2017) to calculate the proportional area covered by the M. maximus relative to the total area of the plot. Concerning the native plant cover, we could not tell apart leaf litter cover from native plant cover using our method because the baseline images were made during the dry season at which time the native plants lose their leaves. Although the invasive grass retains leaves whilst this facilitated the estimation of the levels of invasive plant cover in the plots, it also made it impossible to split native plants from litter cover. It is also important to note that we were not able to use abundance of native plant species because in some herbaceous species it was difficult to distinguish if one plant structure is from a different individual or is of the same individual.
Then, we used a stratified random sampling design to select 30 of the 182 plots based on invasive grass cover which naturally ranged from 0 to 40.4% between the plots on the field (Figure 1, but see also, Supplementary Material – Figure S1). We selected plots that have a homogeneous invasive grass coverage across the entire plot area. After this, we defined dominance classes using equal-sized quantiles based on the proportion of M. maximus in the plots (i.e., grass coverage, used as a measure of dominance). Therefore, the 33% quantiles were defined as a cut-off value to divide the real-time data into three categories, representing control, low and high invasive grass coverage treatments. Thus, we have three treatments: control (0% to 1% grass cover), low dominance (>1% to 9%), and high dominance (>9%) (Figures 1 and S1). Then, to avoid a random selection of plots concentrated in one or another invasion extreme, we decided to use ANOVA design, to balance our random selection into the three treatments. We also sampled the total area covered by native plant species which was used as a covariate (see below). This experimental design resembling a chessboard has been extensively used around the world to investigate ecological and evolutionary questions and has demonstrated those plant species manipulations (e.g., diversity, invasion) may have a bottom-up effect on species interactions at this scale (e.g., Scherber et al. 2010).
Pollinator and native plant surveys
Data collection was performed in 2-day sampling visits twice per month, from March to August 2019. On the first day of each visit, we performed an active observation to quantify the visitation rates (i.e., how many times the insects land and feed on the flower touching its reproductive structures for at least two seconds in a specific observation time, regardless of the number of flowers visited; see Gonçalves-Souza et al. 2008, for similar decision). During field observations, we recorded morphological and behavioral features of pollinator species (e.g., body size, color, and flight behavior) to aid in the identification of the studied species; it is important to note, however, that this information was not used in the analyses. All observations took place between 7:30 AM to 01:00 PM (with 15 minutes of sampling per plot) based on the period of the anthesis of herbaceous plants. On the second day of each visit, we repeated these procedures in each plot but also actively collected pollinators using a sweep net for 15 min on each plot. The collected insects were used only to confirm the identifications and were not considered for statistical analysis. We collected the pollinators on the second day to avoid changing their population structure, which would potentially affect interaction frequencies. These observations were used to quantify pollinator species richness and visitation rate per plot. All observations and collections were made by two observers, and a voucher of insect identity was confirmed by taxonomists at Universidade Federal Rural de Pernambuco (UFRPE) and Universiade Federal do Vale do São Francisco (UNIVASF) deposited at the Entomological Collection of UFRPE. Finally, after sampling on the second day, each visited plant species was photographed, and samples of the same species were collected outside the plots for further identification and to quantify the native plant richness per plot. By doing so, we avoided interfering with the experiment by removing plant individuals before or during the observations. The plants collected were identified by taxonomists at the Universidade Federal de Pernambuco (UFPE).
Network metric calculation
To investigate the influence of invasive plant dominance on network structure we first built an interaction matrix per treatment with the sum of interaction (visitation numbervisitation rate) of each pollinator species on each plant species visited. For each matrix, we calculated three metrics to describe network structure: (i) complementary specialization (H2’), which ranges from 0 (minimum specialization) to 1 (maximum specialization) and quantifies the overall specialization within the network (Blüthgen, 2010); (ii) Nestedness (wNODF), which ranges from 0 (non-nested) to 100 (perfectly nested) and quantifies the non-overlap and decreasing fill of weighted matrices (Almeida-Neto & Ulrich 2011) based on the count of species visitation number visitation rate per row and column - for those communities that show a negative wNODF value (i.e., the real value of wNODF is smaller than what would be expected by chance), the pollinator niches are well established in their plants, which would not promote a nested structure (Almeida-Neto & Ulrich 2011); and finally (iii) Modularity, which occurs when subsets of species interact more among themselves than with other species in the community, leading to the emergence of modules of highly connected species (Dormann & Strauss 2014). We quantified modularity using the Qw metric and the DIRTLPA+ algorithm to search for modules (Beckett 2016). To avoid biases derived from differences in network dimensions, we used null models to produce “delta-corrected” values (Δ-Q) (Dalsgaard et al. 2017). Δ-Q is calculated as the difference between the observed Qw and the mean Qw expected by 1000 randomizations of the null model, which keeps network dimensions and connectance (i.e., matrix fill) constant. Qw ranges from 0 (minimum modularity) to 1 (maximum modularity) (Vizentin-Bugoni et al. 2019). To calculate such metrics, we used the bipartite package (Dormann et al. 2009), available on R software (R Core Team 2019).
Statistical analysis
Before testing whether invasive grass dominance affects native plant richness, pollinator richness, and visitation rate of pollinators, we ran a prior correlation matrix to evaluate the potential correlation between our predicted variables (native plant richness visited and invasive plant dominance) and covariables (native plant richness, honeybee visitation rate). Only the non-native honeybee number of visits and total number of visits (including all pollinators) were strongly correlated (0.96), not affecting our analytical framework (see Fig. S4). Thus, we conducted generalized linear mixed models (GLMM) using the ‘lmer’ function in the ‘lme4’ package for R. First, we assessed how invasive plant cover affects native plant richness. Then, we produced different models to analyze how predictor variables and covariates affect: (a) native pollinators’ richness, (b) native species’ visitation rate, and (c) honeybees’ visitation rate. As honeybees were frequent pollinators and may negatively influence native pollinators (Goulson et al. 2002), we used the visitation rate of honeybees as a covariate and as a predictor in models “a” and “b” above. In all models, we considered the month of sampling as a random factor. We checked model assumptions and, when necessary, used a logarithmic transformation to reduce the potential effects of non-normal residuals and heteroscedasticity. At this point, we started the analyses with the more complex models, using all predictor variables - including the scores from the first axis of a PCA resulting from the ordination of soil physicochemical variables - and their interactions, affecting the response variables (richness of floral visitors, richness of native pollinators, and the visitation rate of honeybees). We used the function ‘dropterm’ of the MASS R-package to simplify the model. This function uses a likelihood ratio test (LRT) statistic to evaluate a null model significance test that assumes that dropping one variable (or interaction) will not affect model fit, resulting in a model with a better fit (Venables et al. 2002). All the interaction terms were excluded from the analysis after using the LRT criterion and, therefore, the models presented below included only the retained variables without any interaction (Table SII).
RESULTS
Species diversity and interactions
We identified 16 native plant species distributed in nine families (Table SI). The plant Richardia grandiflora was the most frequently visited species (35.1% of total visits) followed by Mitracarpus eichleri (30.8%) and Chamaecrista rotundifolia (12.4%). Overall, we recorded 1,427 visits by 22 pollinator species from three orders: Hymenoptera (12 species), Lepidoptera (9), and Diptera (1) (Table SI). The only invasive animal species was the honeybee Apis mellifera, which was the dominant pollinator, 5.5 times more common (71.5% of all visitations) than the next two most frequent pollinators summed: the bee Trigona spinipes (10.5%), and the butterfly Hemiargus hanno (2.43%).
Invasive grass reduces native plant richness, pollinators’ richness, and visit number of native pollinators
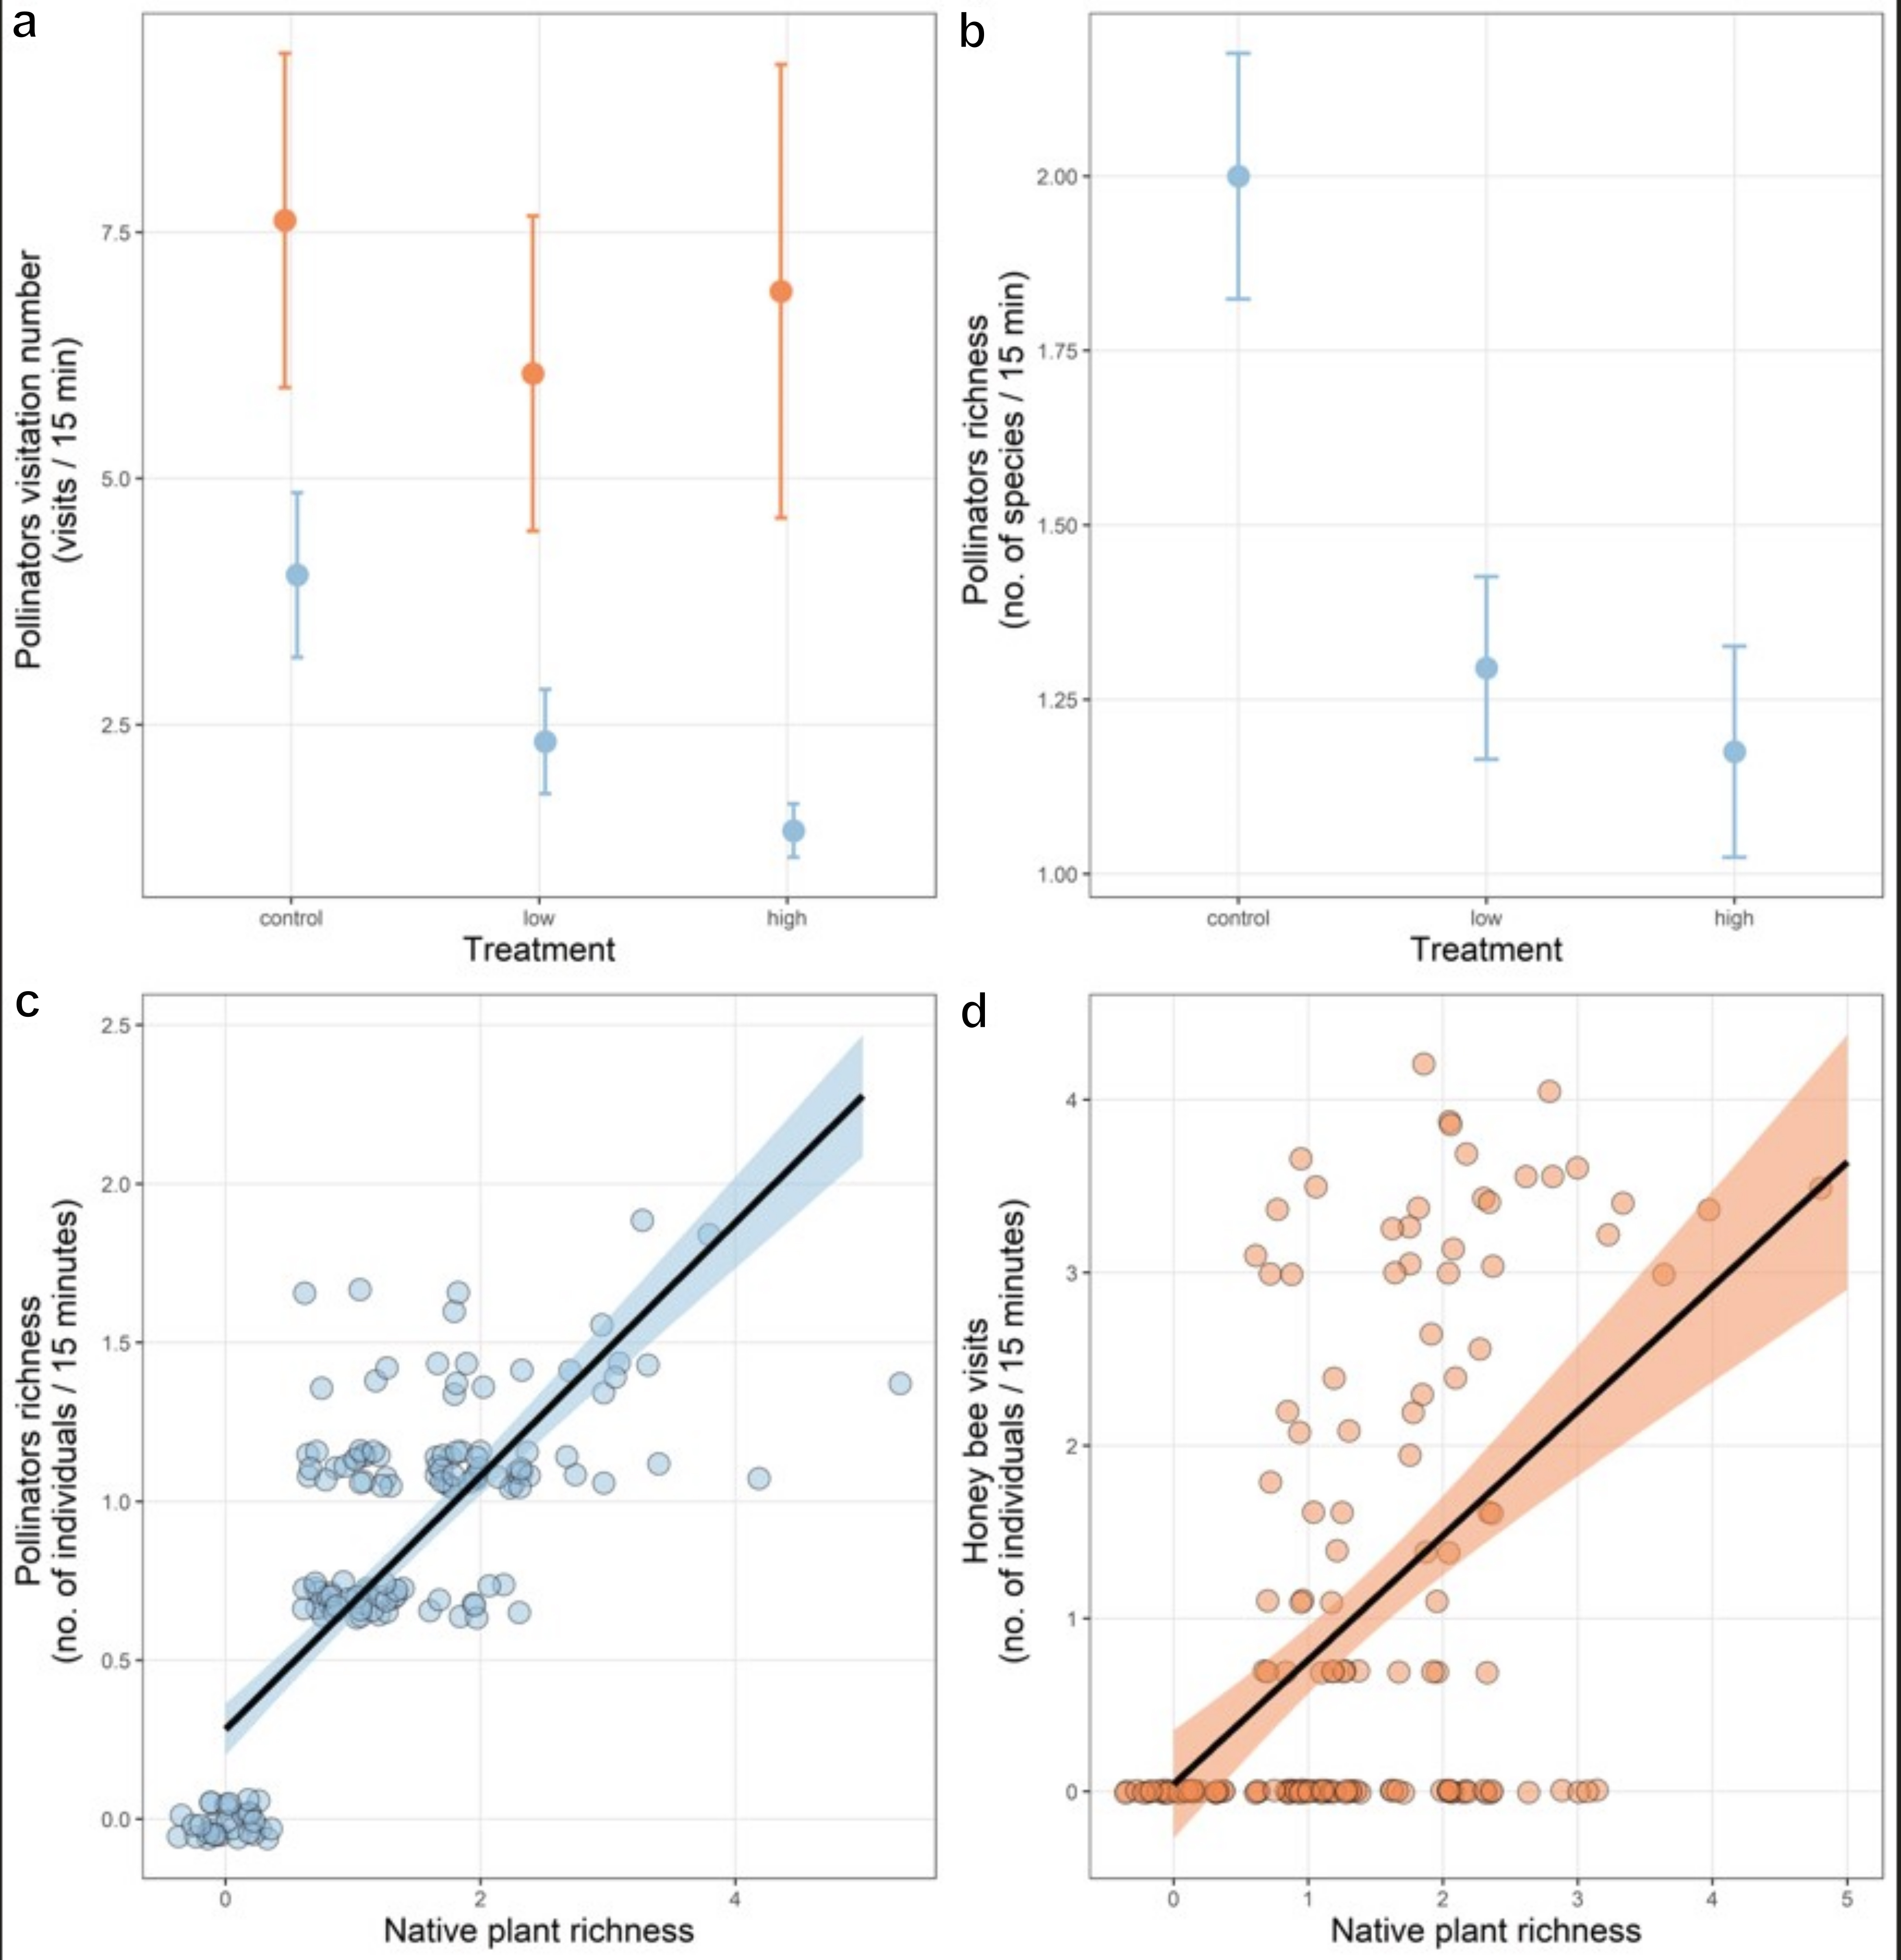
Highly invaded plots (grass cover between 9% and 40.4%) had lower native plant richness than non-invaded plots (0% to 1%) or those with lower cover of invasive grass (>1% to 9%) (Table I). Pollinator richness was 53.8% and 69.5% higher in low-invaded and control plots than highly invaded plots (Figure 2b, Table SIII and Table SIV), respectively. For native pollinators, visitation rates increased by 72.6% and 183.1% when comparing non-invaded plots to low and highly invaded plots (Figure 2a, blue error bars).

Mean of pollinators visitation rates (blue: native pollinators and orange: honeybee) in control, low and highly invaded plots (treatments) (a) and mean of pollinators richness in relation to the number native plant richness (b). Effect of native plant richness on native pollinator average richness (c), and on honeybee visits per 15 minutes of observation (d). Error bars mean ±SE.
Results of Generalized Linear Mixed Models testing the effects of the predictor variables (native plant richness, treatment – control, low, and high), native plant cover, and frequency of honeybees’ visitation) on native pollinator species richness and visitation number, and honeybee’s visitation number. Significant results are in bold and sign in parentheses denotes the direction of the effect. The letter “d” indicates predictor variables that were dropped from the model. The p-values were obtained by ‘anova’ function from the ‘car’ package in R.
Native plant richness had a positive effect on native pollinator richness and the visitation rate of native pollinators and honeybees (Tables I and SII). We found that increasing native plant richness from 1 to 5 species almost doubled the number of pollinator species in a plot (Figure 2c, d), and increased the visitation rate by native pollinators by 438% (Table I, Figure 2c). Conversely, native plant cover negatively affected native pollinator richness, as plots with high cover (54-94%) had 15.59% fewer native pollinator species than those with low cover (16-53%).
The invasive grass cover did not affect the number of visits by honeybees (Figure 2A, orange error bars). However, native plant richness was positively associated with the number of visits by honeybees (Table I). Increasing native plant richness by 5 times increased honeybee visitation by 751.1% (Figure 2d). Native plant cover did not affect honeybee visitation rates and was dropped from the model (Table I).
Effects of honeybees on native pollinators
The number of visits by honeybees reduced native pollinator richness but did not affect their visitation rate (Table I). Plots with less than seven honeybee visits demonstrated 60% higher native pollinator richness when compared to plots with seven or more visits (Figure S2). Conversely, the number of visits by honeybees did not affect the average visitation rate of native pollinators (Table I). Instead, we found that control plots have 18% more rare species (i.e., higher diversity in order q = 0) when compared with highly invaded plots (Figure S3). Furthermore, the dominance of honeybees is higher (i.e., lower diversity in order q = 2) in highly invaded plots (see also Table SV). Therefore, the higher dominance of honeybees in highly invaded plots coincides with the lower diversity of rare species in the same plots (Table I, but see Figure S3, Table SV; see also bar size referring to Apis mellifera across the three treatments in Figure 4).

Structure of plant-pollinator networks across the three treatments: control (0 to 1%), low dominance of invasive grass (>1 to 9% invaded), and high dominance of invasive grass (>1 to 41% invaded). Pollinators and plants were represented in the left and right of each network, respectively. In addition, the size of the bars is proportional to total visitation rate per pollinator species and the width of the links shows the visitation rate between pollinator and plant species in each treatment.
Network structure
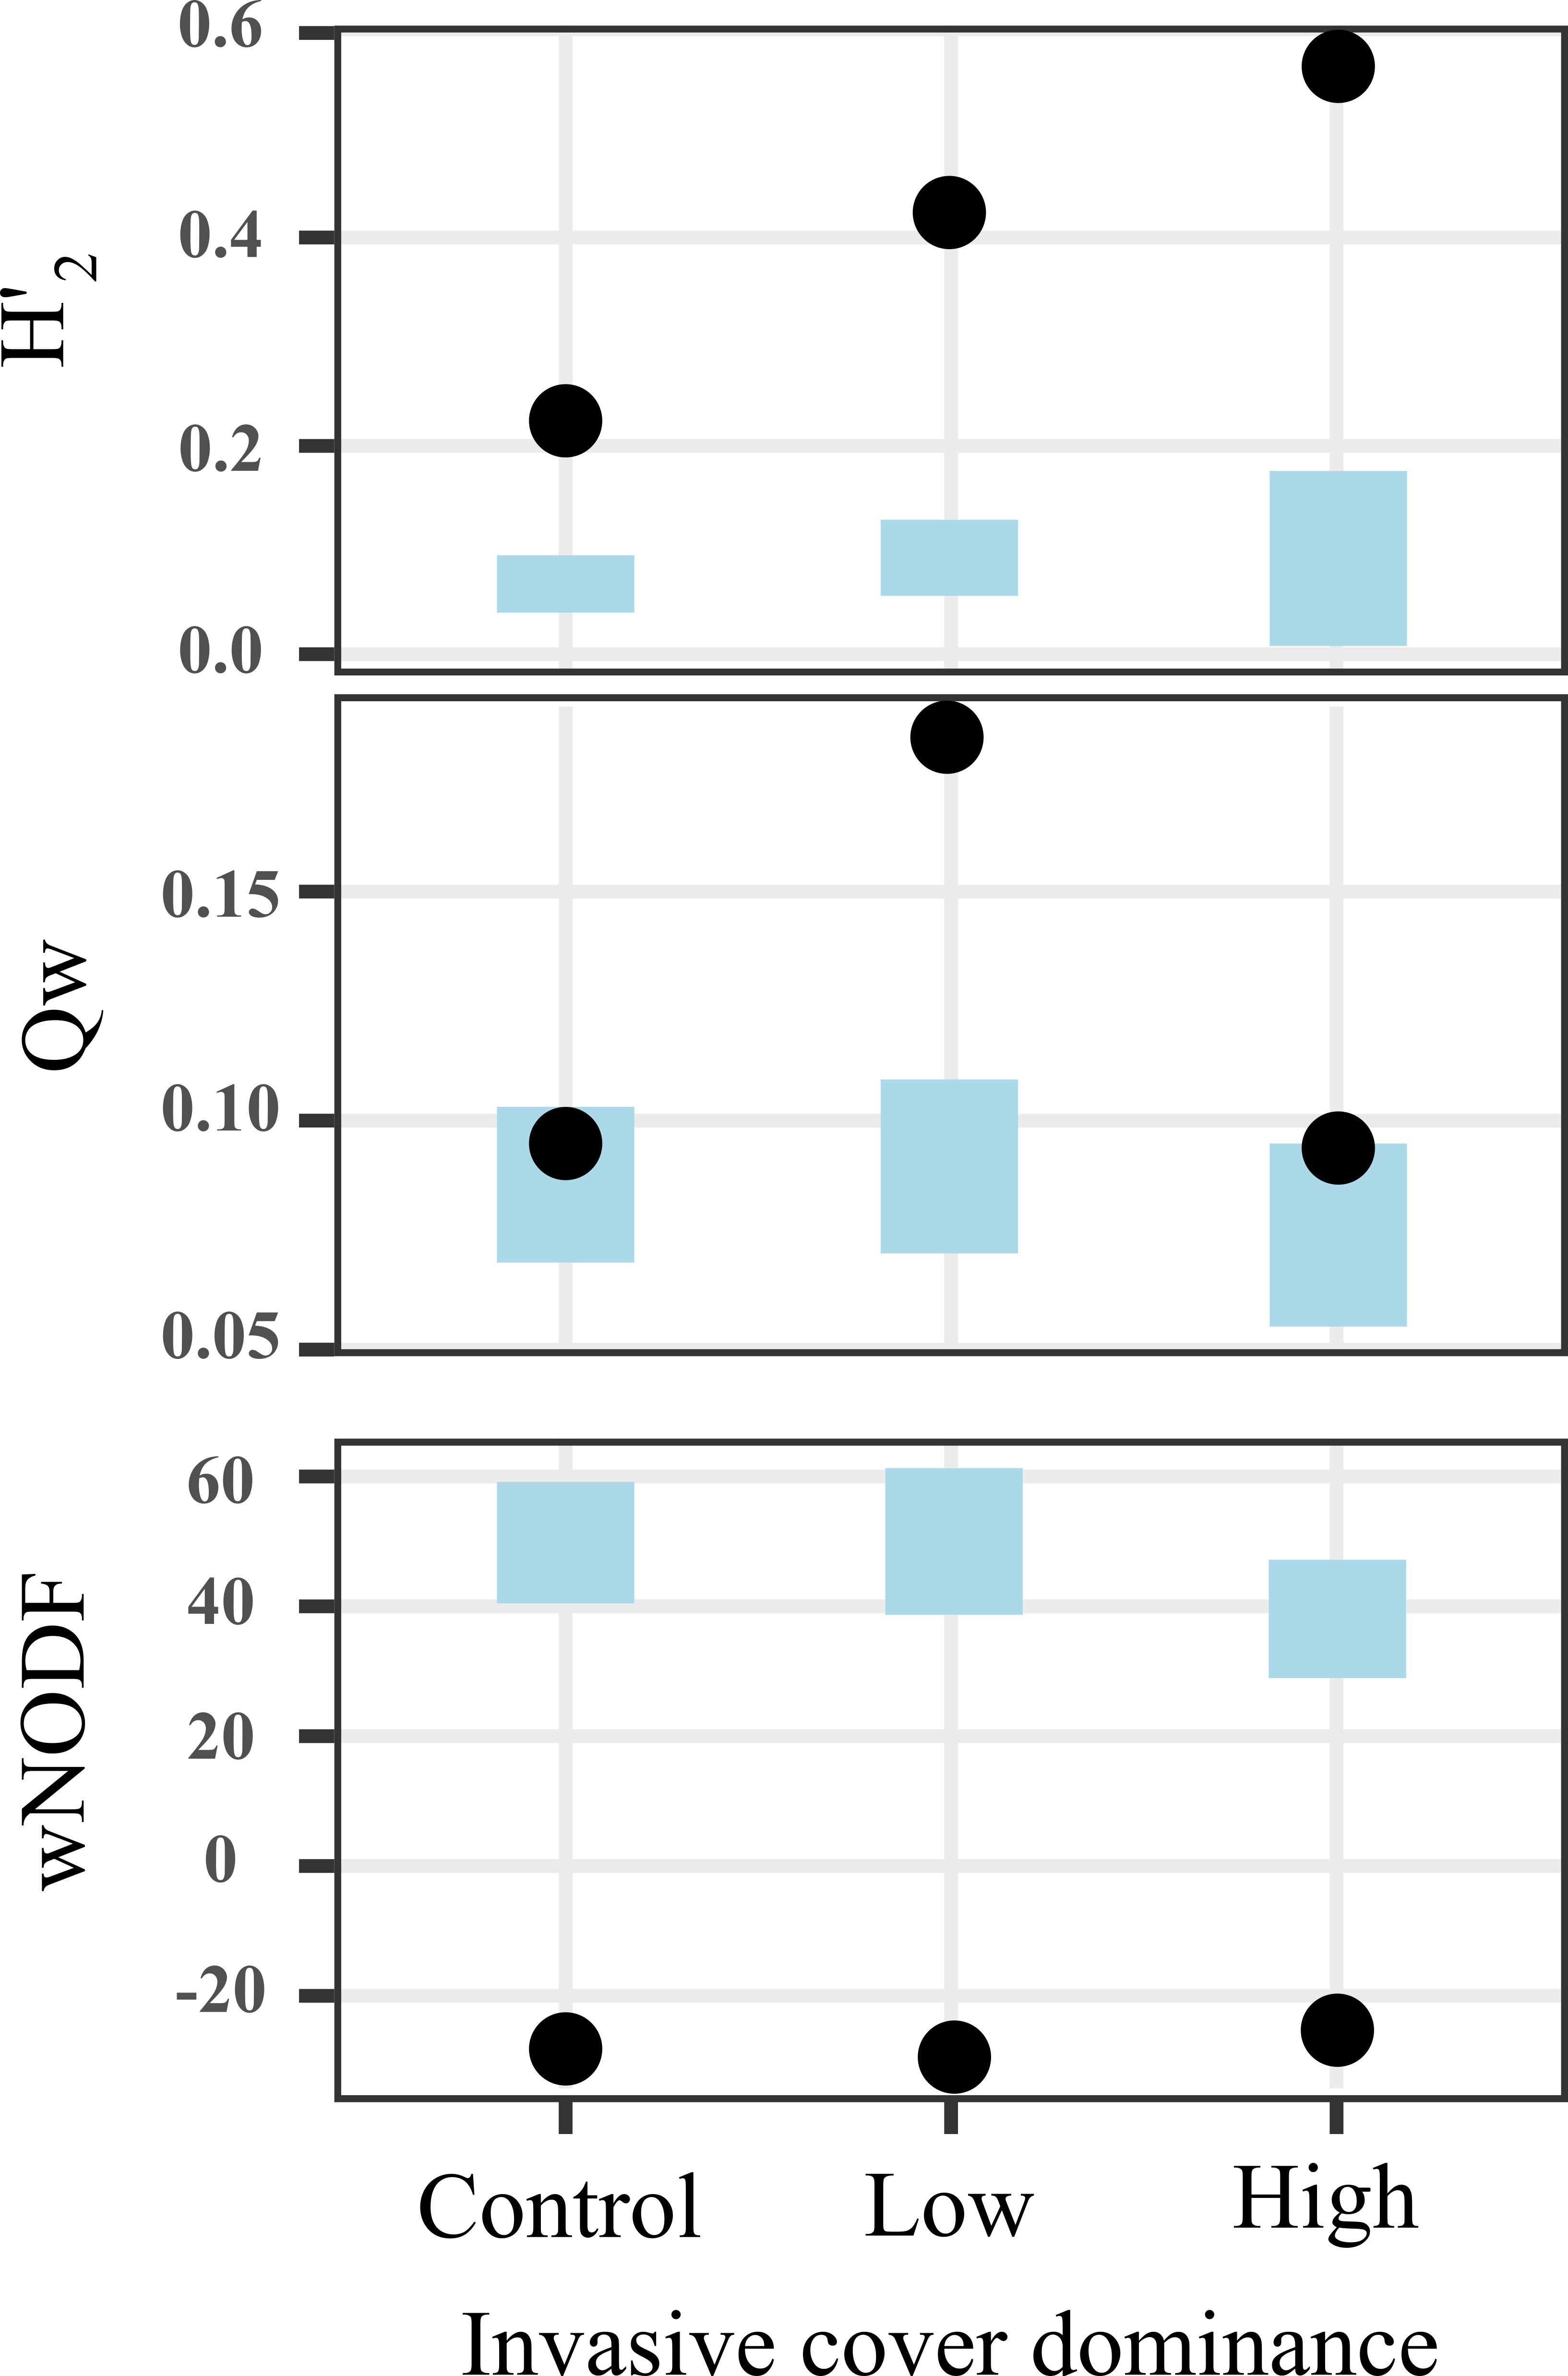
We found that complementary specialization of non-invaded plots was 89.3% and 156.7% lower than in low and highly invaded plots, respectively (Figure 3). While networks were not modular in non-invaded and highly invaded plots, sites with low grass cover were significantly modular. Networks were not nested regardless of grass cover (Figures 3, 4).

Network structure [complementary specialization (H2’), modularity (Qw), and Nestedness (wNODF)], in invasive cover dominance treatments (control, low, and high cover) plots. The blue shaded area represents the null distribution of each metric (95% confidence interval). The black circles indicate the observed values for each metric. The blue shared area represents the expected by a null model to each metric. If the values fall outside the shaded area, there is a significant difference from what is expected by a null distribution. However, negative values for the wNODF do not have any specific network pattern interpretation.
DISCUSSION
Our results show that the dominance of the invasive grass M. maximus impacts the native plant-pollinators network, by reducing native plant and pollinator richness, and pollinator visitation rate. However, the dominance of the invasive grass did not affect the number of visits by non-native honeybees. Contrary to our hypothesis, plant invasion increases complementary specialization and modularity in network structure, but it does not affect nestedness. Taken together, our findings indicate that even an invasive grass without floral traits related to animal pollination may have a negative impact on native pollinator communities and plant-pollinator network structure.
The role of invasive plants and non-native honeybee on plant and pollinator communities
Our results show that invasive grass cover decreases both the richness of native plants and pollinators, as well as the number of visits that native flowers received. Grasses in general possess highly competitive abilities such as rapid growth and high seed set and longevity (Medinilla-Salinas et al. 2013). This is especially true to Megathyrsus maximus, which is reported as one of the primary drivers of plant diversity decrease in tropical regions associated to biological invasion (Ammondt & Litton 2012, Soti & Thomas 2022). Since the native herbaceous plants studied here are predominantly annual and disappear during the Caatinga dry season, seed dormancy might favor the survival and spread of M. maximus by creating an annual pressure window (e.g., Mantoani & Torezan 2016). As a result, the invasive grass outcompetes native species, leading to a reduction in native pollinator richness and altering plant-pollinator interactions. This could cascade-up and negatively impact ecosystem functioning, both directly through diminished pollination and indirectly by affecting seed dispersal (e.g., Neuschulz et al. 2016).
Our findings showed the opposite effects of native and invasive plants on native pollinators. On the one hand, invasive grass cover negatively affected native pollinator richness and their visitation rate, along with reduction in native plant richness. However, increasing native plant richness increased visitation rates. These results suggest that native plants may mitigate the negative effects of invasive species on pollinators by increasing the availability of resources (Stout & Tiedeken 2016). This finding aligns with previous studies, which have shown that higher plant richness significantly enhances pollinator diversity, as greater plant diversity often provides more resources that support a wider range of specialist pollinator species. (Potts et al. 2003, Janz et al. 2006). This pattern parallels the typical positive relationship between increased landscape complexity (ecological niche) and species diversity because different species are adapted to distinct habitats (Tscharntke et al. 2012). These opposing effects reinforce two widely accepted hypotheses: increasing invasive species (generally) reduces native diversity (Janz et al. 2006), and introduced organisms contribute – in long term – to the homogenization of native communities (i.e., the biotic homogenization hypothesis: Trentanovi et al. 2013).
We also found that the increase in invasive grass cover slightly increases the dominance of non-native honeybee visits to native plants, negatively affecting both the richness of visiting pollinators, as well as the visitation rate per pollinator, which - in turn - led to a simplification of the plant-pollinator network. Importantly, although there are no directly compounding negative effects of non-native honeybees and the invasive grass, the dominance of non-native honeybees increased from uninvaded to invaded plots (Figures 4 and S2), which suggests that the realized niche of native pollinators might be reduced in regions invaded by both plants and pollinators (Montero-Castaño & Vilà 2017). In addition, this absence of compounding effects could happen through two different mechanisms. First, invasive grass decreases native plant richness likely by direct competition for nutrients, light and/or space (Yang et al. 2020) and, therefore, affects visitation by native pollinators by reducing floral resource availability. Second, the super-generalist social competitor Apis mellifera promotes a significant decrease of native pollinator species through direct competition for floral sources. The non-native honeybee is a mass-recruiter, which intensively collects floral resources often until they are depleted (Huryn 1997). Its eusocial behavior potentializes its negative effect on native pollinators richness by a density-dependent process, because floral resource availability declines as honeybee visitation frequency increases. (Hung et al. 2019). Furthermore, the visitation rate of honeybees was more accentuated on plots with higher native plant richness. However, although we have not tested it directly, our results suggest that the increase in invasive plant dominance is more dangerous to native pollinators than the dominance of non-native honeybees, since honeybees concentrate their visits on only two native plant species (Fig. 4). Thus, it is reasonable to think that the floral resource reducing promoted by increase of invasive grass is an important mechanism to filtering pollinator species.
Effect of invasive plant dominance on plant-pollinator network structure
The increase in invasive grass cover affected plant-pollinator networks in two ways. First, invasive grass coverage increases complementary specialization (Gruchowski-Woitowicz et al. 2020), which indicates that niche partitioning increases in highly invaded plots, coinciding with the increased dominance of honeybees, and suggesting that this species may push native pollinators to interact with a reduced subset of native plants (Memmott & Waser 2002, see also Badano & Vergara 2011, Ebeling et al. 2011). This is consistent with widespread evidence that mass-recruiting honeybees are highly capable of depleting floral resources (Huryn 1997), limiting foraging opportunities for other pollinators. From the plants perspective, the dominance of invasive grasses could result in increased exploitative competition for shared pollinators (Bezemer et al. 2014, Geslin et al. 2017). This scenario is not supported by our data, which instead indicates increasing interaction partitioning in highly invaded sites. The second effect was on network modularity, with modular structure absent in uninvaded and highly invaded plots. The lack of modularity in highly invaded sites is likely associated with the low number of native plant species since species-poor communities tend to be less modular (Blüthgen et al. 2008, Kaiser-Bunbury & Blüthgen 2015). In control plots, honeybees dominate the exploitation of floral resources, pushing native pollinators to share the remaining plant species which increases overlap of their foraging niches and reduces formation of modules. Thus, plant invasion seems to promote modularity until a threshold of grass density is surpassed, from where the reduced plant richness limits opportunities for module emergence. These results suggest that probably both invasive plant coverage and honeybee dominance negatively impact niche partitioning and shape plant-pollinator networks.
Although in the Caatinga tends, as a dry tropical forests, plant species have evolved strategies such as resprouting and water-deficit tolerance (Barros et al. 2021, Silva et al. 2018), our results suggest that invasive species introduction would lead to cascading negative impacts with biodiversity losses, and ultimately reduce ecosystem health. We demonstrated that increasing dominance of invasive grass may lead (in long term) to a tipping point of ecosystem functioning since important pollination function could be lost simultaneously with species loss. Additionally, a biological invasion may favor another invasive species. For instance, within our research system, the increased predominance of honeybees in invaded sites serves as an additional ecological pressure, competing with native pollinators. This competition consequently disrupts the ecosystem’s balance, as honeybees exhibit greater efficiency in resource utilization when compared to native pollinators. (e.g., Morales & Aizen 2006, Kuppler et al. 2017).
CONCLUSIONS
The dominance of a wind-pollinated invasive grass has direct and indirect effects on the plant-pollinator community and network structure. The dominance of invasive grass led to a decrease of floral resource availability, negatively affecting the pollinator richness. In addition, non-native honeybees add to these negative impacts by competing with native pollinators for floral resources. The combined negative impacts of the introduced grass and non-native honeybee may further harm plant-pollinator interactions. Finally, our results suggest that although there is competition between non-native honeybee and native pollinators, the increase of invasive grass seems to be the main factor of the decrease in native pollinators’ richness, which could lead (in short time) to an unbalance of ecosystem processes. Also, the reduction in native pollinators visitation rates caused by invasive grass dominance could have far-reaching consequences for the maintenance of ecosystem health, as it increases competition for the remaining resource by favoring the dominance of non-native honeybees. Therefore, we recommend future studies to investigate the long-term impacts and the cumulative effect of plant and honeybee invasion on the resilience of seasonally dry tropical forests. These future results could let us know the real effect of invasion (in multiple trophic levels) on ecosystem maintenance and regeneration capability. Our research helps to understand how invasive species impact the plant-pollinator interactions and could boost species homogenization and floral resource depletion in abandoned lands in dry semiarid ecosystems.
SUPPLEMENTARY MATERIAL
ACKNOWLEDGMENTS
This manuscript benefits from several insights and taxonomic assistance of Dr. Daniele Parizotto. Dr. Inara Roberta Leal and Dr. Marcelo Tabarelli who identified plant species. We also thank Dr. Paschoal Coelho Grossi for assistance with collected individuals in the Entomological collection of UFRPE. A previous version of this manuscript was carefully read by Dr. Natan Almeida and Dr. Xavier Arnan. C.H.C. and J.V.B. received a grant from Coordenação de Aperfeiçoamento de Pessoal de Nível Superior – Brasil (CAPES) – Financial Code 001. Conselho Nacional de Desenvolvimento Científico e Tecnológico (CNPq) provided support to this study (nº 441292/2017) and sponsored R.F.R.C. (CNPq 164111/2020-4). Lastly, this study was only possible by solid cooperation between international partners and Brazilian public universities, responsible for ~90% of the Brazilian scientific production, which has been suffering severe cuts of investment from the current government. This work was funded by the Brazilian Government through the grant from Coordenação de Aperfeiçoamento de Pessoal de Nível Superior – Brasil (CAPES) – Financial Code 001 and the National Council for Scientific and Technological Development (CNPq nº 441292/2017, CNPq 164111/2020-4).
REFERENCES
- AIZEN MA, GARIBALDI LA, CUNNINGHAM SA & KLEIN AM. 2009. How much does agriculture depend on pollinators? Lessons from long-term trends in crop production. Ann Bot 103: 1579-1588.
- ALBRECHT J, GERTRUD BERENS D, JAROSZEWICZ B, SELVA N, BRANDL R & FARWIG N. 2014. Correlated loss of ecosystem services in coupled mutualistic networks. Nat Commun 5: 3810.
- ALMEIDA WR, LOPES AV, TABARELLI M & LEAL IR. 2015. The alien flora of Brazilian Caatinga: deliberate introductions expand the contingent of potential invaders. Biol Invasions 17: 51-56.
- ALMEIDA-NETO M, GUIMARÃES P, GUIMARÃES PR, LOYOLA RD & ULRICH W. 2008. A consistent metric for nestedness analysis in ecological systems: reconciling concept and measurement. Oikos 117: 1227-1239.
- ALMEIDA-NETO M & ULRICH W. 2011. A straightforward computational approach for measuring nestedness using quantitative matrices. Environ Model Softw 26: 173-178.
- ALVES ASA, NASCIMENTO ALB, ALBUQUERQUE UP & CASTRO CC. 2019. The influence of the exotic Apis mellifera and the related migratory apiculture on the reproductive success of some Brazilian native plant species. J Arid Environ 164: 1-6.
- AMMONDT SA & LITTON CM. 2012. Competition between Native Hawaiian Plants and the Invasive Grass Megathyrsus maximus: Implications of Functional Diversity for Ecological Restoration. Restor Ecol 20: 638-646.
- AMMONDT SA, LITTON CM, ELLSWORTH LM & LEARY JK. 2013. Restoration of native plant communities in a Hawaiian dry lowland ecosystem dominated by the invasive grass Megathyrsus maximus, Ohlemüller R (Ed.). Appl Veg Sci 16: 29-39.
- BADANO EI & VERGARA CH. 2011. Potential negative effects of exotic honey bees on the diversity of native pollinators and yield of highland coffee plantations. Agric Forest Entomol 13: 365-372.
- BARROS MF, RIBEIRO EMS, VANDERLEI RS, DE PAULA AS, SILVA AB, WIRTH R, CIANCIARUSO MV & TABARELLI M. 2021. Resprouting drives successional pathways and the resilience of Caatinga dry forest in human-modified landscapes. Forest Ecol Manag 482: 118881.
- BARTOMEUS I, VILÀ M & SANTAMARÍA L. 2008. Contrasting effects of invasive plants in plant-pollinator networks. Oecologia 155: 761-770.
- BASCOMPTE J, JORDANO P, MELIÁN CJ & OLESEN JM. 2003. The nested assembly of plant-animal mutualistic networks. Proc Natl Acad Sci USA 100: 9383-9387.
- BECKETT SJ. 2016. Improved community detection in weighted bipartite networks. R Soc Open Sci 3: 140536.
- BEZEMER TM, HARVEY JA & CRONIN JT. 2014. Response of native insect communities to invasive plants. Annu Rev Entomol 59: 119-141.
- BLÜTHGEN N. 2010. Why network analysis is often disconnected from community ecology: A critique and an ecologist’s guide. Basic Appl Ecol 11: 185-195.
- BLÜTHGEN N, FRÜND J, VÁZQUEZ DP & MENZEL F. 2008. What Do Interaction Network Metrics Tell Us About Specialization and Biological Traits. Ecology 89: 3387-3399.
- CHAO A, CHIU CH & JOST L. 2014. Unifying Species Diversity, Phylogenetic Diversity, Functional Diversity, and Related Similarity and Differentiation Measures Through Hill Numbers. Annu Rev Ecol Evol Syst 45: 297-324.
- CLARK JA & COVEY KR. 2012. Tree species richness and the logging of natural forests: A meta-analysis. Forest Ecol Manag 276: 146-153.
- CUADRA-VALDÉS J, VIZENTIN-BUGONI J & FONTÚRBEL FE. 2021. An exotic magnet plant alters pollinator abundance and behavior: a field test with a native mistletoe. Biol Invasions 23: 2515-2525.
- DALSGAARD B, SCHLEUNING M, MARUYAMA PK, DEHLING DM, SONNE J, VIZENTIN-BUGONI J, ZANATA TB, FJELDSÅ J, BÖHNING-GAESE K & RAHBEK C. 2017. Opposed latitudinal patterns of network-derived and dietary specialization in avian plant-frugivore interaction systems. Ecography 40: 1395-1401.
- DÍAZ S ET AL. 2019. Pervasive human-driven decline of life on Earth points to the need for transformative change. Science 366: eaax3100.
- DORMANN CF, FRUND J, BLUTHGEN N & GRUBER B. 2009. Indices, Graphs and Null Models: Analyzing Bipartite Ecological Networks. TOECOLJ 2: 7-24.
- DORMANN CF & STRAUSS R. 2014. A method for detecting modules in quantitative bipartite networks. Methods Ecol Evol 5: 90-98.
- EBELING A, KLEIN A-M & TSCHARNTKE T. 2011. Plant–flower visitor interaction webs: Temporal stability and pollinator specialization increases along an experimental plant diversity gradient. Basic Appl Ecol 12: 300-309.
- FLORY SL & CLAY K. 2010. Non-native grass invasion suppresses forest succession. Oecologia 164: 1029-1038.
- GESLIN B, GAUZENS B, BAUDE M, DAJOZ I, FONTAINE C, HENRY M, ROPARS L, ROLLIN O, THÉBAULT E & VEREECKEN NJ. 2017. Chapter Four - Massively Introduced Managed Species and Their Consequences for Plant–Pollinator Interactions. In: Bohan DA et al. (Eds), Advances in Ecological Research, Academic Press, p. 147-199.
- GHAZOUL J. 2004. Alien Abduction: Disruption of Native Plant-Pollinator Interactions by Invasive Species. Biotropica 36: 156-164.
- GILLESPIE S & ELLE E. 2018. Non-native plants affect generalist pollinator diet overlap and foraging behavior indirectly, via impacts on native plant abundance. Biol Invasions 20: 3179-3191.
- GILPIN A-M, COLLETTE JC, DENHAM AJ, OOI MKJ & AYRE DJ. 2016. Do introduced honeybees affect seed set and seed quality in a plant adapted for bird pollination? JPE 10: 721-729.
- GONÇALVES-SOUZA T, OMENA PM, SOUZA JC & ROMERO GQ. 2008. Trait-Mediated Effects on Flowers: Artificial Spiders Deceive Pollinators and Decrease Plant Fitness. Ecology 89: 2407-2413.
- GOTELLI NJ & COLWELL RK. 2001. Quantifying biodiversity: procedures and pitfalls in the measurement and comparison of species richness. Ecol Lett 4: 379-391.
- GOULSON D, STOUT JC & KELLS AR. 2002. Do exotic bumblebees and honeybees compete with native flower-visiting insects in Tasmania? J Insect Conserv 6: 179-189.
- GRUCHOWSKI‐WOITOWICZ FC, DA SILVA CI & RAMALHO M. 2020. Experimental field test of the influence of generalist stingless bees (Meliponini) on the topology of a bee–flower mutualistic network in the tropics. Ecol Entomol 45: 854-866.
- HUNG K-LJ, KINGSTON JM, LEE A, HOLWAY DA & KOHN JR. 2019. Non-native honey bees disproportionately dominate the most abundant floral resources in a biodiversity hotspot. Proc R Soc B 286: 20182901.
- HURYN VMB. 1997. Ecological Impacts of Introduced Honey Bees. Q Rev Biol 72: 275-297.
- IMMELMAN K & EARDLEY C. 2008. Gathering of grass pollen by solitary bees (Halictidae, Lipotriches) in South Africa. Zool Reihe 76: 263-268.
- JANZ N, NYLIN S & WAHLBERG N. 2006. Diversity begets diversity: host expansions and the diversification of plant-feeding insects. BMC Evol Biol 6: 4.
- KAISER-BUNBURY CN & BLÜTHGEN N. 2015. Integrating network ecology with applied conservation: a synthesis and guide to implementation. AoB PLANTS 7: plv076.
- KAISER-BUNBURY CN, MOUGAL J, WHITTINGTON AE, VALENTIN T, GABRIEL R, OLESEN JM & BLÜTHGEN N. 2017. Ecosystem restoration strengthens pollination network resilience and function. Nature 542: 223-227.
- KUPPLER J, HÖFERS MK, TRUTSCHNIG W, BATHKE AC, EIBEN JA, DAEHLER CC & JUNKER RR. 2017. Exotic flower visitors exploit large floral trait spaces resulting in asymmetric resource partitioning with native visitors. Funct Ecol 31: 2244-2254.
- LAURANCE WF, LOVEJOY TE, VASCONCELOS HL, BRUNA EM, DIDHAM RK, STOUFFER PC, GASCON C, BIERREGAARD RO, LAURANCE SG & SAMPAIO E. 2002. Ecosystem Decay of Amazonian Forest Fragments: A 22-Year Investigation. Conserv Biol 16: 605-618.
- LAURANCE WF, SAYER J & CASSMAN KG. 2014. Agricultural expansion and its impacts on tropical nature. Trends Ecol Evol 29: 107-116.
- LEAL LC, ANDERSEN AN & LEAL IR. 2014. Anthropogenic disturbance reduces seed-dispersal services for myrmecochorous plants in the Brazilian Caatinga. Oecologia 174: 173-181.
- LEAL LC, ANDERSEN AN & LEAL IR. 2015. Disturbance Winners or Losers? Plants Bearing Extrafloral Nectaries in Brazilian Caatinga. Biotropica 47: 468-474.
- LEAL IR, SILVA JMC, TABARELLI M & LACHER TE. 2005. Changing the Course of Biodiversity Conservation in the Caatinga of Northeastern Brazil. Conserv Biol 19: 701-706.
- LÔBO D, LEÃO T, MELO FPL, SANTOS AMM & TABARELLI M. 2011. Forest fragmentation drives Atlantic forest of northeastern Brazil to biotic homogenization: Biotic homogenization of Atlantic forest. Divers Distrib 17: 287-296.
- MANTOANI MC & TOREZAN JMD. 2016. Regeneration response of Brazilian Atlantic Forest woody species to four years of Megathyrsus maximus removal. Forest Ecol Manag 359: 141-146.
- MARSHALL VM, LEWIS MM & OSTENDORF B. 2012. Buffel grass (Cenchrus ciliaris) as an invader and threat to biodiversity in arid environments: A review. J Arid Environ 78: 1-12.
- MEDINILLA-SALINAS L, VARGAS-MENDOZA MC, LÓPEZ-ORTIZ S, ÁVILA-RESÉNDIZ C, CAMPBELL WB & GUTIÉRREZ-CASTORENA MC. 2013. Growth, productivity and quality of Megathyrsus maximus under cover from Gliricidia sepium. Agroforest Syst 87: 891-899.
- MELO FPL. 2017. The Socio-Ecology of the Caatinga: Understanding How Natural Resource Use Shapes an Ecosystem. In: Silva JMC et al. (Eds), Caatinga: The Largest Tropical Dry Forest Region in South America, Cham: Springer International Publishing, p. 369-382.
- MEMMOTT J & WASER NM. 2002. Integration of alien plants into a native flower–pollinator visitation web. Proc R Soc Lond B 269: 2395-2399.
- MMA – MINISTÉRIO DO MEIO AMBIENTE. 2011. Monitoramento do desmatamento nos biomas brasileiros por satélite: monitoramento do bioma Caatinga 2008 a 2009, Centro de Informação, Documentação Ambiental e Editoração Luís Eduardo Magalhães – CID Ambiental.
- MONTERO‐CASTAÑO A & VILÀ M. 2017. Influence of the honeybee and trait similarity on the effect of a non‐native plant on pollination and network rewiring. Funct Ecol 31: 142-152.
- MORALES CL & AIZEN MA. 2006. Invasive mutualisms and the structure of plant-pollinator interactions in the temperate forests of north-west Patagonia, Argentina. J Ecol 94: 171-180.
- NEUSCHULZ EL, MUELLER T, SCHLEUNING M & BÖHNING-GAESE K. 2016. Pollination and seed dispersal are the most threatened processes of plant regeneration. Sci Rep 6: 29839.
- PARRA-TABLA V & ARCEO-GÓMEZ G. 2021. Impacts of plant invasions in native plant-pollinator networks. New Phytol 230: 2117-2128.
- PIVELLO VR, SHIDA CN & MEIRELLES ST. 1999. Alien grasses in Brazilian savannas: a threat to the biodiversity. Biodivers Conserv 8: 1281-1294.
- PONISIO LC, VALDOVINOS FS, ALLHOFF KT, GAIARSA MP, BARNER A, GUIMARÃES PR, HEMBRY DH, MORRISON B & GILLESPIE R. 2019. A Network Perspective for Community Assembly. Front Ecol Evol 7.
- POTTS SG, VULLIAMY B, DAFNI A, NE’EMAN G & WILLMER P. 2003. Linking bees and flowers: how do floral communities structure pollinator communities? Ecology 84: 2628-2642.
- R CORE TEAM. 2019. R: a language and environment for statistical computing.
- ROJAS-SANDOVAL J & MELÉNDEZ-ACKERMAN E. 2012. Effects of an invasive grass on the demography of the Caribbean cactus Harrisia portoricensis: Implications for cacti conservation. Acta Oecologica 41: 30-38.
- ROJAS-SANDOVAL J, MELÉNDEZ-ACKERMAN EJ & ANGLÉS-ALCÁZAR D. 2016. Assessing the impact of grass invasion on the population dynamics of a threatened Caribbean dry forest cactus. Biol Conserv 196: 156-164.
- RUEDEN CT, SCHINDELIN J, HINER MC, DEZONIA BE, WALTER AE, ARENA ET & ELICEIRI KW. 2017. ImageJ2: ImageJ for the next generation of scientific image data. BMC Bioinformatics 18: 529.
- RYMER PD, WHELAN RJ, AYRE DJ, WESTON PH & RUSSELL KG. 2005. Reproductive success and pollinator effectiveness differ in common and rare Persoonia species (Proteaceae). Biol Conserv 123: 521-532.
- SANTOS GMM, AGUIAR CML & MELLO MAR. 2010. Flower-visiting guild associated with the Caatinga flora: trophic interaction networks formed by social bees and social wasps with plants. Apidologie 41: 466-475.
- SCHERBER C ET AL. 2010. Bottom-up effects of plant diversity on multitrophic interactions in a biodiversity experiment. Nature 468: 553-556.
- SCHWEIGER O ET AL. 2010. Multiple stressors on biotic interactions: how climate change and alien species interact to affect pollination. Biol Rev 85: 777-795.
- DA SILVA JMC, LEAL I & TABARELLI M. Caatinga: the largest tropical dry forest region in South America. 2018. New York, NY: Springer Science+Business Media.
- SOBRINHO MS, TABARELLI M, MACHADO IC, SFAIR JC, BRUNA EM & LOPES AV. 2016. Land use, fallow period and the recovery of a Caatinga forest. Biotropica 48: 586-597.
- SOTI P & THOMAS V. 2022. Review of the invasive forage Grass, Guinea grass (Megathyrsus maximus): Ecology and potential impacts in arid and semi‐arid regions. Weed Res 62: 68-74.
- STOUT JC & CASEY LM. 2014. Relative abundance of an invasive alien plant affects insect–flower interaction networks in Ireland. Acta Oecologica 55: 78-85.
- STOUT JC & TIEDEKEN J. 2016. Direct interactions between invasive plants and native pollinators: evidence, impacts and approaches. Funct Ecol 31: 38-46.
- TRAVESET A & RICHARDSON DM. 2014. Mutualistic Interactions and Biological Invasions. Annu Rev Ecol Evol Syst 45: 89-113.
- TRENTANOVI G, VON DER LIPPE M, SITZIA T, ZIECHMANN U, KOWARIK I & CIERJACKS A. 2013. Biotic homogenization at the community scale: disentangling the roles of urbanization and plant invasion. Diversity Distrib 19: 738-748.
- TSCHARNTKE T ET AL. 2012. Landscape moderation of biodiversity patterns and processes - eight hypotheses. Biol Rev 87: 661-685.
- VALIDO A, RODRÍGUEZ-RODRÍGUEZ MC & JORDANO P. 2019. Honeybees disrupt the structure and functionality of plant-pollinator networks. Sci Rep 9: 4711.
- VELDMAN JW, MOSTACEDO B, PEÑA-CLAROS M & PUTZ FE. 2009. Selective logging and fire as drivers of alien grass invasion in a Bolivian tropical dry forest. Forest Ecol Manag 258: 1643-1649.
- VENABLES WN, RIPLEY BD & VENABLES WN. 2002. Modern applied statistics with S, 4th ed., New York: Springer, 495 p.
- VIZENTIN-BUGONI J, TARWATER CE, FOSTER JT, DRAKE DR, GLEDITSCH JM, HRUSKA AM, KELLEY JP & SPERRY JH. 2019. Structure, spatial dynamics, and stability of novel seed dispersal mutualistic networks in Hawaiʻi. Science 364: 78-82.
- YANG Y, WANG K, LIU D, ZHAO X & FAN J. 2020. Effects of land-use conversions on the ecosystem services in the agro-pastoral ecotone of northern China. J Clean Prod 249: 119360.