 Spectral-Directional Thermography for Scientific Applications
Abstract
Thermography is a widely used non-contact technique in scientific research for temperature estimation and thermal analysis. However, conventional thermographic methods often suffer from significant measurement errors due to oversimplified thermal radiation models. This work addresses these limitations by contrasting conventional techniques with advanced thermography methods, introducing a spectral-directional modeling framework to enhance measurement accuracy and scientific rigor. Key contributions include the development of robust mathematical models, such as the three-component spectral-directional model, which effectively reduces measurement errors by accounting for the complexities of thermal radiation phenomena. These advancements enable accurate thermographic measurements, expanding the technique’s applicability across diverse scientific fields. To the best of the author’s knowledge, the application of the spectral-directional model to post-process thermal imager data represents a novel contribution to the field. Experimental results, supported by comparisons with peer-reviewed literature, highlight the transformative potential of this framework in a range of scientific applications.
Key words
thermography; measurement uncertainty; thermal radiation; calibration
Introduction
Thermography is a widely recognized non-contact technique in scientific research, valued for its versatility in estimating temperature and observing thermal variations across a scene. Its applications span diverse fields, including fault detection in industrial equipment, energy efficiency analyses in photovoltaic (PV) systems, and medical diagnostics (Bagavathiappan et al. 2013, Fernández-Cuevas et al. 2015, Ferreira et al. 2019, Kylili et al. 2014, Lahiri et al. 2012, Maldague 2001, Telson et al. 2023, Valentim et al. 2024, 2024). However, the accuracy of thermographic measurements is often limited by the constraints of conventional mathematical models used to interpret thermal radiation.
A key challenge in thermographic applications arises from the variable spectral and directional optical properties of surfaces, such as PV panels under outdoor conditions. Most commercial thermal imagers assume target objects behave as diffuse-gray surfaces, but this assumption fails for PV panels. Ferreira et al. 2019 demonstrated that the front side of PV panels behaves as a specular non-gray surface, with optical properties such as emissivity and reflectivity varying significantly with wavelength, viewing angle, and the properties of incident long-wave infrared (LWIR) radiation. This complexity, compounded by atmospheric emissions and absorptions at specific wavelengths, complicates accurate temperature estimation and renders conventional thermographic models inadequate. To address these limitations, Ferreira et al. 2019 validated a spectral-directional post-processing methodology that integrates spectral-directional emissivity and reflectivity. This approach reduced temperature deviations to below 3°C compared to a reference resistance temperature detector (RTD), whereas conventional methods relying on commercial imagers’ internal software showed deviations exceeding 5°C. These findings underscore the critical need for advanced thermographic models to ensure reliable temperature measurements in scenarios with complex optical behaviors.
Challenges similar to those encountered in PV systems also arise in other applications where spectral-directional effects are critical. For instance, high-temperature processes and low-emissivity surfaces, such as polished metals, present significant complexities due to their unique radiative properties. Similarly, fugitive emissions and combustion processes pose challenges, as gases exhibit specific spectral absorption and emission characteristics in the infrared spectrum. These examples underscore the broader implications of relying on oversimplified thermographic models, which not only compromise measurement accuracy but also hinder technological advancement and informed decision-making in scientific and industrial contexts.
To address these limitations, recent advancements in thermographic modeling have emphasized spectral-directional mathematical frameworks. These models consider the wavelength-dependent and angular variations in emissivity, transmissivity, and reflectivity, providing a more accurate representation of thermal radiation. For instance, Paes et al. 2024 applied these models to quantify gas concentrations in mid-wave infrared (MWIR) applications, while Oliveira Moreira et al. 2021 demonstrated their utility in monitoring milling processes, achieving a reduction in measurement error compared to conventional methods.

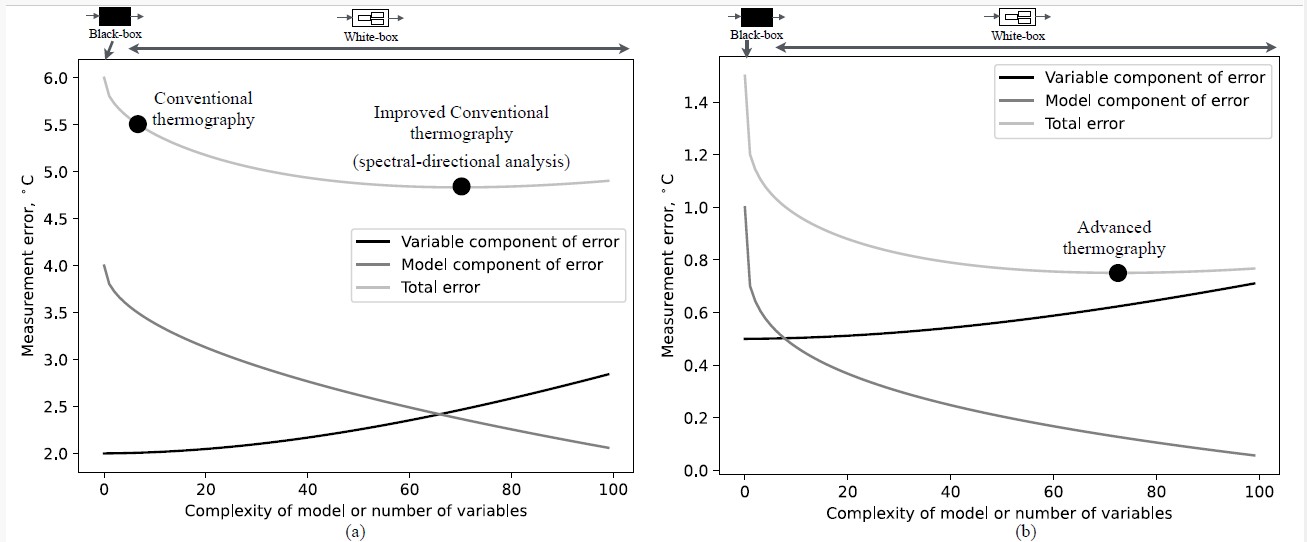
Comparative evaluation of thermographic methodologies, illustrating the progression from conventional thermography to improved conventional thermography (utilizing spectral-directional analysis) and advanced thermography. The figure presents distinctions in modeling approaches, categorized into white-box and black-box strategies, emphasizing their roles in temperature estimation and thermal analysis. Subfigure (a) highlights key differences in the assumptions and inputs used by each methodology, while subfigure (b) showcases the performance improvements achieved through advanced thermographic models. This graph demonstrates the importance of integrating advanced modeling techniques to overcome the limitations of conventional methods, particularly in complex scenarios involving non-gray or specular surfaces. This figure is intended for illustrative purposes to clarify the conceptual and practical advancements introduced by these methods.
Figure 1 conceptualizes the trade-off between model complexity and measurement accuracy in thermography. Conventional models, while computationally efficient, oversimplify critical spectral-directional interactions, such as angular variations in emissivity and wavelength-specific absorption and reflection phenomena. These simplifications often lead to significant measurement errors, restricting thermography to qualitative analyses or approximations with large uncertainties. Advanced thermographic models address these shortcomings by incorporating detailed physical representations that account for material properties, spectral dependencies, and angular effects, thereby improving measurement accuracy by reducing both bias and uncertainty. The figure also highlights the critical role of calibration in minimizing residual errors, ensuring that the increased complexity of these models translates into reliable measurements. It underscores how balancing model sophistication and robust calibration enhances the applicability of thermography to complex scientific and industrial scenarios while maintaining practical feasibility.
This article explores the development and application of spectral-directional mathematical models to enhance thermographic measurements. By addressing the limitations of conventional approaches and presenting a robust theoretical foundation, it aims to provide researchers and practitioners with tools for advancing thermographic methodologies in diverse fields. The examples discussed herein demonstrate how these models transform thermography into a robust quantitative tool for addressing complex scientific and industrial challenges.
Mathematical Models
Thermography fundamentally relies on mathematical models. Thermal imagers are equipped with detectors sensitive to infrared radiation, which generate electrical signals in response to thermal radiation. These signals serve as inputs to generate digital counts, typically represented as 16-bit data, which are then used to estimate thermophysical quantities such as radiance or temperature. Thermal imagers operate as closed systems primarily due to restrictions imposed by ITAR (International Traffic in Arms Regulations), which limit their accessibility and modification. These restrictions prevent any direct study of how thermal radiation is processed into electrical signals within the camera.
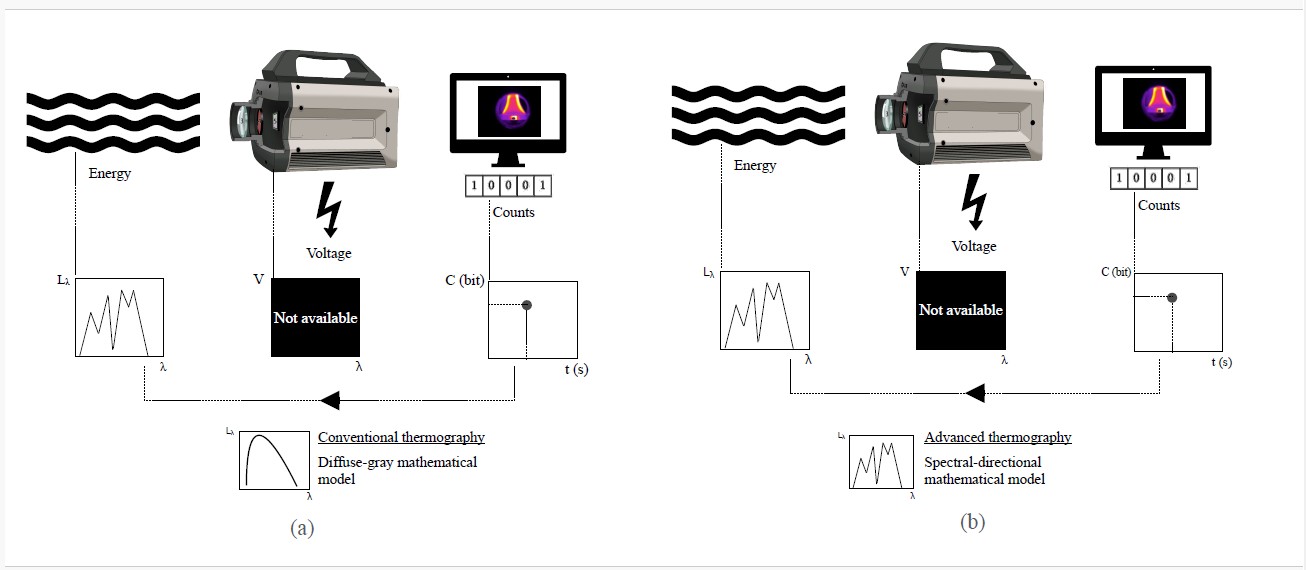
For instance, in cooled cameras, a significant source of uncertainty arises from the internal temperature. The exact location of the internal temperature sensor and its influence on the system’s performance are typically unknown. Internal temperature is influenced by factors such as integration time, which substantially affects the response of the digital counts. As the internal workings of the camera are inaccessible, addressing this uncertainty relies on black-box mathematical models. These models use the internal temperature as an independent variable to correct the digital counts. Such corrections are usually performed automatically if the camera has been calibrated by the manufacturer. However, users lack access to the underlying calculations behind this correction, complicating efforts to evaluate the associated uncertainty. Figure 2 illustrates these challenges.
Given the constraints on accessing the internal mechanisms of thermal imagers, this article focuses on enhancing the modeling of thermal radiation. This includes accounting for its transmission through the lenses and absorption by the detectors. Such modeling requires inverse analysis, a process that can be ill-posed and demands careful application (Howell et al. 2021). We classify two primary approaches to modeling thermal radiance: conventional thermography and advanced thermography. These approaches are explored in detail in the following sections.
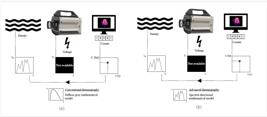
Illustration of the closed-system nature of a thermal imager and its implications for uncertainty. In both conventional thermography (a) and advanced thermography (b), the user has access only to digital counts (), which lack spectral and directional information about the observed radiation. Advanced thermography (b) integrates spectral-directional models to better interpret the nature of thermal radiation, while conventional thermography (a) assumes the incoming radiation as gray-diffuse.
Advanced and conventional thermography
The most common mathematical model used to describe the thermal radiation reaching the detectors is the three-components model, applied during both calibration and measurement. This model assumes that three sources of thermal radiance reach the detectors (see Figure 3): radiance emitted by the blackbody radiator (or the target surface), radiance reflected from the environment, and radiance originating from the atmosphere. For example, in the case of advanced thermography, a spectral-directional model with at least three components and four windows (blackbody, atmosphere, thermal imager and output) is used, whereas conventional thermography uses a model with three components and three windows (blackbody, atmosphere, and output). In conventional thermography, temperature is the primary variable, while advanced thermography focuses on spectral-directional thermal radiance.

Radiance components that reach the IR detector during a calibration (or measurement) procedure. (a) Advanced thermography, illustrating the concepts of spectral-directional thermal radiation; (b) Conventional thermography, illustrating the concepts of diffuse-gray thermal radiation.
Equation (1) represents the spectral-directional mathematical model that describes the amount of energy absorbed by the thermal imager detectors,
where the subscripts abs, bb, refl, atm, filter, and represent absorbed radiation, target component (in this case, the blackbody radiator surface), reflected component, atmospheric component, filter component, and spectral dependence, respectively. The symbols , , , , , and denote radiance, temperature, detector responsivity, blackbody radiator emissivity, atmospheric transmissivity, and line-of-sight angle, respectively. Directionality is considered when estimating the optical properties. If the viewing angle of the target surface is very steep, additional considerations may be required to accurately quantify the total radiance emitted from the surface. The terms , , and correspond to the Planck equation applied to the target surface temperature (), the reflected temperature (), and the atmospheric temperature (), respectively.During the calibration process, the total absorbed radiance is estimated using an RTD sensor coupled to the blackbody surface, based on the three-components model described in Equation (1). A set of values and their corresponding digital counts () is used to derive a calibration equation for the camera,
Once the calibration is complete, the camera can estimate temperature by following these steps. First, the camera is directed at the target, producing a digital count (), which is then used to calculate the radiance using the calibration equation. The temperature is then determined indirectly by iteratively solving Equation (1), specifically utilizing the term .Multispectral or hyperspectral cameras can complement the spectral-directional approach (Equation (1)), resulting in a more robust methodology. Multispectral infrared cameras typically employ a filter wheel to capture thermograms across various bands of the infrared spectrum. These cameras are often cooled to improve performance and reduce noise and are commonly sensitive to the MWIR (mid-wave infrared) or SWIR (short-wave infrared) ranges. Hyperspectral cameras, on the other hand, utilize Fourier-transform infrared (FTIR) technology and are available for both MWIR and LWIR (long-wave infrared) ranges. By combining multispectral and hyperspectral thermography across different spectral regions, researchers can collect more comprehensive experimental data, leading to more detailed and accurate analyses.
For instance, when using "n" bands, the mathematical model can have "n" equations in the form of
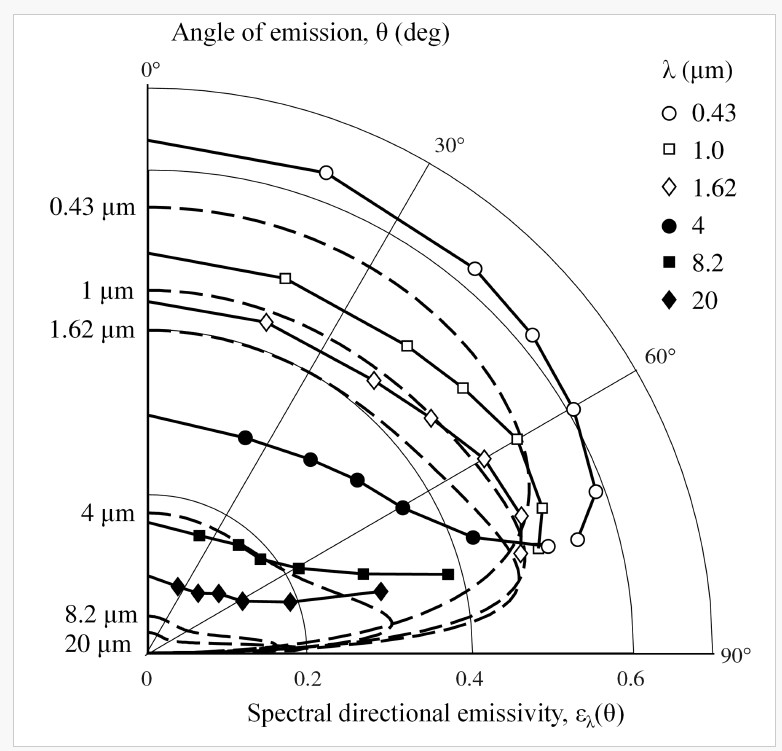
Beyond the spectral dependence, thermal radiance is also significantly affected by direction. For example, Figure 4 presents the experimental results of the spectral-directional emissivity of titanium at 306 ± 14 K, with the surface ground to a roughness of 0.4 rms () (Edwards & Catton 1964, Howell et al. 2021, Palik 1998), along with theoretical predictions from electromagnetic theory. These results demonstrate that a material can be characterized based on its directional response at different angles.
In this context, Equation (2) can be rewritten as follows
Care must be taken when using theoretical relations to estimate the behavior of optical properties. Figure 4 illustrates deviations from predictions based on electromagnetic theory compared to experimental results. Additionally, surface topography plays a significant role in the analysis of optical properties, as shown in (Howell et al. 2021). The ratio (surface roughness to wavelength) determines the appropriate mathematical model. For optically smooth surfaces, the Fresnel equations are applicable. For moderate roughness (), Davies’ theory is suitable. In cases of higher roughness (), models such as the Bidirectional Reflectance Distribution Function (BRDF) or electromagnetic scattering theory should be employed. For surfaces with very high roughness (), ray-tracing methods are more appropriate. Moreover, the choice of model is influenced by the spectral band of the camera (e.g., SWIR, MWIR, or LWIR).

spectral-directional emissivity of titanium at 306 ± 14 K, with the surface ground to 0.4 rms roughness. Symbols represent data from Edwards & Catton 1964 on the emissivity of rough and oxidized metals. Dashed curves indicate predictions from electromagnetic theory, based on optical constants from Palik 1998. Figure extracted from Howell et al. 2021.
Another interesting approach is the application of a methodology with more than three components. For instance, in the inspection of PV panels, additional sources of emission, such as dust and the glass surface, can be considered separately. This refinement accounts for the distinct radiative properties of these materials, which may affect the accuracy of temperature measurements. In such cases, Equation (3) can be adapted to include these additional components, allowing for a more comprehensive representation of the thermal radiation reaching the detector. This extended methodology improves the ability to account for complex scenarios, such as varying levels of dust accumulation or differences in the spectral-directional properties of the glass, leading to more reliable thermographic analyses.
Despite the mathematical robustness of Equation (5), no publications utilizing this formulation have been identified by the author to date. Instead, conventional approaches predominate in the literature, typically relying on diffuse-gray approximations.
As an approximation of Equation (1), the target surface can be assumed to be diffuse-gray. For diffuse-gray surfaces, Equation (6) provides an iterative method for estimating temperature; however, employing the diffuse-gray model introduces inaccuracies.
here, represents the temperature emitted by a perfect blackbody (with an emissivity of one), matching the energy flux received by the IR detectors. The spectral-band hemispherical emissivity of the blackbody radiator is denoted as , and represents the spectral-band atmospheric transmissivity (derived from distance and relative humidity ); is the spectral-band fraction of emissive power, determined using where and .Neglecting wavelength dependence and integrating the radiative quantities in the full spectrum, the temperature can be estimated as follows:
which is the most commonly used version in thermal imager software.It is very common to use Equation (8) because most thermography users are not specialists in thermal radiation, making it a straightforward way to understand the underlying physical phenomenon, compared to Equation (1). The application of Equation (1) implies the use of Kirchhoff’s Law, as described by (Howell et al. 2021).
Application of advanced thermography
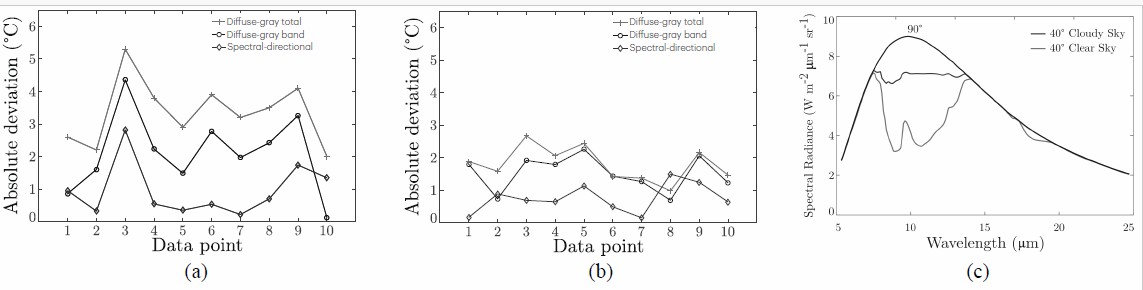
The spectral-directional thermal radiation model plays an important role in the inspection of photovoltaic modules. Figure 5 shows the results of temperature deviation when comparing measurements using a thermal imager with resistance thermometers when temperature is measured for the front surface of PV panels. Three mathematical models were tested. The first one represents Equation (7) and uses the diffuse-gray total approach, which is the model used in thermal imagers. The second model is diffuse-gray in nature (see Equation (5)), but it uses only the LWIR infrared band in the calculation. The third model is the spectral-directional approach (see Equation (1)). On a clear sky day, the diffuse-gray total model yields the worst results compared to the diffuse-gray band model and the spectral-directional model. The spectral-directional model produces results much closer to the RTD, demonstrating the relevance of the spectral-directional method. This behavior is not observed on a cloudy day because the spectral nature of radiation from the sky is more similar to gray radiation compared to a clear sky day. Consequently, the diffuse-gray total and diffuse-gray band results are closer, as shown in Figure 5b.
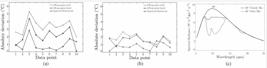
Measurement of absolute deviation comparing a temperature measurement using a thermal imager with an RTD added to the PV panel surface — adapted from Ferreira et al. 2019. (a) Clear sky; (b) Cloudy sky; (c) Cloudy and clear sky spectral radiance.
The spectral-directional thermal radiation model is highly applicable for measuring gas concentrations using thermal imaging, as demonstrated in (Blunck 2022, Paes et al. 2024). Figure 6 presents a Python-HAPI (Gordon et al. 2016) simulation showcasing the emission and absorption behavior of CO and atmospheric gases during a simulated breathing process, captured using a mid-wavelength infrared (MWIR) thermal imager. The simulation employs Equation (6) to model the radiative transfer, assuming a non-scattering medium
where is the optical path length defined as . Here, is the absorption coefficient, and is the physical path length.
Spectral-directional radiance components during a CO measurement using an MWIR camera. Two gas layers are positioned in front of a blackbody at 50C. The first layer (60 cm) contains atmospheric air at 93.5 kPa, 22C, 50% relative humidity, and 800 ppm of CO. The second layer (30 cm) contains CO at a concentration of 50,000 ppm, simulating human exhalation. (a) Blackbody emission; (b) Camera filter; (c) Camera lenses; (d) Emission from the two gas layers; (e) Camera responsivity; (f) Estimated thermal radiance absorbed by the detectors.
In the configuration presented in Figure 6, two gas layers with homogenous composition and temperature are placed in front of a blackbody maintained at 50C. The first layer, measuring 60 cm in length, consists of atmospheric air at 93.5 kPa pressure, 22C temperature, 50% relative humidity, and 800 ppm of CO. The second layer, measuring 30 cm, contains exhaled CO at a concentration of 50,000 ppm, simulating human respiration. These configurations allow the spectral and directional characteristics of CO and other atmospheric gases to be analyzed.
The analysis reveals the interaction between the blackbody’s thermal radiation and the gas layers. The spectral radiance changes due to absorption and emission phenomena within each layer, providing detailed insights into the gas concentration’s impact on thermal radiation. For example, the absorption bands corresponding to CO and water vapor are clearly distinguishable, enabling accurate quantification of their concentrations.
This methodology has significant applications beyond respiratory analysis, including industrial emission monitoring, combustion process evaluation, and environmental studies. By leveraging the spectral-directional approach, researchers can resolve the spectral radiance contributions from multiple gas layers, enabling accurate detection and measurement of trace gases in complex scenarios. Furthermore, the integration of advanced spectral-directional models with MWIR cameras demonstrates the potential to refine current practices in gas thermography, enhancing both accuracy and reliability in applications requiring non-contact gas analysis.
In (Oliveira Moreira et al. 2021), the authors utilized the directional-spectral radiative heat transfer relations detailed in (Howell et al. 2021) to estimate the spectral-directional properties of metals during temperature analysis in a milling process. Unlike conventional approaches, which often rely on the diffuse-gray approximation, their methodology incorporates the spectral dependence of emissivity—a critical factor for accurately characterizing metallic surfaces during machining. This methodology addresses the significant challenges posed by constant emissivity values, which can lead to deviations of up to 41% in temperature estimation when compared to the results obtained using advanced thermography.
The novelty of (Oliveira Moreira et al. 2021) lies in the development of an iterative framework that resolves temperature and emissivity simultaneously without requiring two-color thermometry. Figure 7 compares the workpiece temperature results derived from the directional-spectral approach with those obtained using three other methods, including constant emissivity values of 0.07 and 0.14, as specified by thermal imager manufacturers for polished steel at 100°C and 400°C, respectively.
In their approach, emissivity is treated as a spectral and temperature-dependent variable, yielding more accurate results compared to methods constrained by the diffuse-gray approximation. Their findings highlight the limitations of such simplifications in practical scenarios. In contrast, the directional-spectral framework provides a more reliable representation of workpiece temperatures, emphasizing the necessity of accounting for emissivity’s spectral, directional, and temperature-dependent characteristics in milling applications. This methodological advancement enhances measurement accuracy significantly and paves the way for broader adoption of thermography in complex industrial processes.
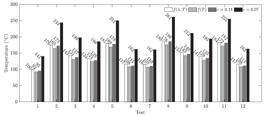
Temperature determination using a diffuse-gray directional-total and spectral-directional mathematical model.
CONCLUSIONS
In summary, this study underscores the potential of advanced thermographic models in improving measurement accuracy and addressing the limitations of conventional approaches. By incorporating spectral-directional properties, these models enable more accurate thermal radiation analysis, particularly in complex scenarios such as photovoltaic panel inspections, milling processes, and gas concentration measurements.
The adoption of spectral-directional thermography bridges the gap between theoretical insights and practical applications. This methodology captures the intricate interactions between thermal radiation and surface characteristics, offering a more comprehensive framework for thermal analysis. The comparative results presented in this work highlight the significant improvements in accuracy achievable with advanced models over diffuse-gray approximations.
Moreover, this work emphasizes the critical need to consider environmental influences, material properties, and emission sources in thermographic analysis. By moving beyond simplified assumptions, researchers and practitioners can unlock new opportunities.
Looking forward, the insights and methodologies detailed herein serve as a foundation for further advancements in thermography. By refining these techniques, researchers can drive innovation and extend the applicability of thermography to solve complex scientific and industrial challenges. Ultimately, this work contributes to the ongoing evolution of thermography as a robust tool for quantitative and qualitative analysis, fostering progress across diverse disciplines.
List of Symbols
| Area, | |
| Total absorbed radiance, | |
| Spectral radiance at temperature , | |
| Wavelength, | |
| Line-of-sight angle, radians | |
| Spectral-directional emissivity of the blackbody radiator, dimensionless | |
| Spectral-directional atmospheric emissivity, dimensionless | |
| Spectral transmissivity of the lens, dimensionless | |
| Spectral transmissivity of the filter, dimensionless | |
| Detector responsivity, dimensionless | |
| Target surface (blackbody) temperature, | |
| Reflected temperature, | |
| Atmospheric temperature, | |
| Temperature equivalent to the absorbed radiance, | |
| Spectral-band fraction of emissive power, dimensionless | |
| Spectral-band atmospheric transmissivity, dimensionless | |
| Relative humidity, percentage | |
| Variable for Planck distribution simplification, dimensionless | |
| Second radiation constant, | |
| Spectral band width, | |
| Surface roughness, |
ACKNOWLEDGMENTS
This study was partially sponsored by the Coordenação de Aperfeiçoamento de Pessoal de Nível Superior – Brazil (CAPES) – Finance Code 001, by the Conselho Nacional de Desenvolvimento Científico e Tecnológico (CNPq) 306776/2023-5, by the PRPq-UFMG (Pró-Reitoria de Pesquisa da Universidade Federal de Minas Gerais), by FAPEMIG (Fundação de Amparo à Pesquisa do Estado de Minas Gerais), and FINEP (Financiadora de Estudos e Projetos).
REFERENCES
- BAGAVATHIAPPAN S, LAHIRI BB, SARAVANAN T, PHILIP J & JAYAKUMAR T. 2013. Infrared Thermography for Condition Monitoring – a Review. Infrared Phys Technol 60: 35–55. doi: 10.1016/j.infrared.2013.03.006.
- BLUNCK DL. 2022. Review: Applications of Infrared Thermography for Studying Flows with Participating Media. Exp Therm Fluid Sci 130: 110502. doi: 10.1016/j.expthermflusci.2021.110502.
- EDWARDS DK & CATTON I. 1964. Radiation Characteristics of Rough and Oxidized Metals. In: Advances in Thermophysical Properties at Extreme Temperatures and Pressures. New York: ASME.
- FERNÁNDEZ-CUEVAS I, MARINS JCB, LASTRAS JA, CARMONA PMG, CANO SP, GARCÍA-CONCEPCIÓN MÁ & SILLERO-QUINTANA M. 2015. Classification of Factors Influencing the Use of Infrared Thermography in Humans: A Review. Infrared Phys Technol 71: 28–55.
- FERREIRA RAM, POTTIE DLF, DIAS LHC, FILHO BJC & PORTO MP. 2019. A Directional-Spectral Approach to Estimate Temperature of Outdoor PV Panels. Sol Energy 183: 782–790. doi: 10.1016/j.solener.2019.03.049.
- FERREIRA RAM, SILVA BPA, TEIXEIRA GGD, ANDRADE RM & PORTO MP. 2019. Uncertainty Analysis Applied to Electrical Components Diagnosis by Infrared Thermography. Measurement 132: 263–271. doi: 10.1016/j.measurement.2018.09.036.
- GORDON IE, ROTHMAN LS, TASHKUN SA & TENNYSON JL. 2016. HAPI: A HITRAN Application Programming Interface. J Quant. Spectrosc Radiat Transf 186: 14–25. doi: 10.1016/j.jqsrt.2016.03.009.
- HOWELL JR, DAUN KJ, SIEGEL R & MENGÜÇ MP. 2021. Thermal Radiation Heat Transfer. Boca Raton, FL: CRC Press.
- KYLILI A, FOKAIDES PA, CHRISTOU P & KALOGIROU SA. 2014. Infrared Thermography (IRT) Applications for Building Diagnostics: A Review. Appl Energy 134: 531–549. doi: 10.1016/j.apenergy.2014.08.005.
- LAHIRI BB, BAGAVATHIAPPAN S, JAYAKUMAR T & PHILIP J. 2012. Medical Applications of Infrared Thermography: A Review. Infrared Phys Technol 55(4): 221–235. doi: 10.1016/j.infrared.2012.03.007.
- MALDAGUE XPV. 2001. Theory and Practice of Infrared Technology for Nondestructive Testing. New York: John Wiley & Sons.
- OLIVEIRA MOREIRA M DE, ABRÃO AM, FERREIRA RAM & PORTO MP. 2021. Temperature Monitoring of Milling Processes Using a Directional-Spectral Thermal Radiation Heat Transfer Formulation and Thermography. Int J Heat Mass Transf 171: 121051. doi: 10.1016/j.ijheatmasstransfer.2021.121051.
- PAES VF, ROSA JN, FERREIRA RAM & PORTO MP. 2024. MWIR Camera Calibration for CO2 Quantification. Proceedings of the 17th Quantitative Infrared Thermography Conference.
- PALIK ED. 1998. Handbook of Optical Constants of Solids. New York: Elsevier.
- TELSON YC, FURLAN RMMM, PORTO MP, FERREIRA RAM & MOTTA AR. 2023. Evaluation of the Breathing Mode by Infrared Thermography. Braz J Otorhinolaryngol 89(6): 101333. doi: 10.1016/j.bjorl.2023.101333.
- VALENTIM AF ET AL. 2024. Comparison of Infrared Thermography of the Face Between Mouth-Breathing and Nasal-Breathing Children. Eur Arch Oto-Rhino-Laryngol doi: 10.1007/s00405-024-09038-5.
- VALENTIM AF ET AL. 2024. Infrared Thermography in Children: Identifying Key Facial Temperature Distribution Patterns. J Therm Anal Calorim doi: 10.1007/s10973-024-13652-0.