 Combined oral contraceptive administration in female mice attenuated high-fat diet-induced obesity but not hepatic inflammation or fibrosis
Abstract
Combined oral contraceptives (COC)s are the contraceptive method of choice for millions of women worldwide. In this study, we aimed to investigate the effects of COC administration, composed of 17α-ethinylestradiol (EE2) and drospirenone (DRSP), on obesity, glucose tolerance, and hepatic steatosis in female mice. Eighty-day-old <italic>Swiss</italic> female mice were fed either a standard diet (SD) or a high-fat diet (HFD) and daily received, via gavage, 0.2 mL of distilled water (CTL-SD and CTL-HFD groups) with or without COC (COC-SD and COC-HFD groups) for 65 days. COC administration attenuated body weight and adiposity gains and prevented glucose intolerance induced by HFD in COC-HFD females. These effects were accompanied by the upregulation of <italic>Prdm16</italic> and <italic>Ucp-1</italic> genes in the brown adipose tissue (BAT) of COC-HFD mice. These females also exhibited a lower hepatic steatosis score than CTL-HFD mice; however, their liver parenchyma showed an increased number of inflammatory foci, and up-regulation of the <italic>Il-1β</italic> gene. Thus, COC administration in female mice attenuated obesity development induced by HFD, possibly through modulation of BAT function, while the increased hepatic expression of the pro-inflammatory cytokine IL-1β suggests that COC exacerbated HFD-induced liver inflammation.
Key words
drospirenone; ethynylestradiol; non-alcoholic fat liver disease; oral contraceptives
INTRODUCTION
Oral contraceptives are the family planning method of choice for 16% of women of reproductive age worldwide (United Nations. Population Division 2020). Oral contraceptive formulations can consist of either a combination of synthetic estrogen and progestin, known as combined oral contraceptives (COC)s, or solely a synthetic progestin. Currently, the most used synthetic estrogen in COC formulations is 17α-ethinylestradiol (EE2). Among the various synthetic progestins, drospirenone (DRSP) is a fourth-generation progestin with antiandrogenic and antimineralocorticoid properties. When combined with EE2 in COCs, DRSP not only provides contraceptive benefits but also offers non-contraceptive effects, such as reducing water retention, acne, and hirsutism (Krattenmacher 2000, Allen et al. 2016).
Obesity is a chronic disease characterized by excessive body fat accumulation, leading to detrimental health outcomes and increasing the risk of several comorbidities, including non-alcoholic fatty liver disease (NAFLD). This disease has significantly impacted global healthcare costs, with its prevalence rising from 25.5% in 2005 to 32.4% in 2016, making it the most common chronic liver disease worldwide (Riazi et al. 2022). NAFLD is categorized by a histological spectrum ranging from simple hepatic steatosis, defined by triglyceride (TG) accumulation in hepatocytes, to more severe stages involving hepatic inflammation and fibrosis. This progression can lead to non-alcoholic steatohepatitis, which increases the morbidity and mortality of NAFLD patients and predisposes them to liver cirrhosis and hepatocellular carcinoma (Contos et al. 2004, Ng et al. 2022).
Although the use of COCs is associated with several gynecological health benefits beyond pregnancy prevention (Jensen & Speroff 2000, Allen et al. 2016), it is also linked to an increased risk of liver diseases (Ferrara & Rutland 1988, Sinclair et al. 2017, Lieberman et al. 1984, Wang et al. 2021). On the other hand, natural and synthetic estrogens and progestins, when studied individually, have been shown to regulate nutrient metabolism in a dose-dependent manner, potentially preventing obesity and its comorbidities (Chambliss et al. 2016, Armani et al. 2014, Bjune et al. 2022, Lee et al. 2018). However, there is limited information regarding the effects of COCs on obesity and liver morphofunction.
In female rats fed on a standard diet (SD) and treated with a COC containing EE2 and levonorgestrel (LNG), from the 3rd to 11th weeks postpartum, hepatic steatosis was observed (Badmus & Olatunji 2019). Similarly, in female mice, the administration of EE2 plus LNG for three weeks alongside a high-fat diet (HFD) increased hepatic steatosis despite to attenuating adiposity gain (Fuller et al. 2022). In a previous study, we found that administration of a COC containing EE2 and DRSP to female mice fed on a SD did not cause steatosis but increased hepatic collagen deposition (Oliveira et al. 2019). Since HFD consumption in rodents induces obesity, insulin resistance, hepatic steatosis and fibrosis (Velázquez et al. 2019), we hypothesize that the administration of a COC composed by EE2 and DRSP may impact obesity development and its comorbidities, when female mice are subjected to this obesogenic regimen. Thus, in this study, we aimed to investigate the effects of administering a COC composed of EE2 and DRSP on obesity development, glucose tolerance and hepatic steatosis in female mice of reproductive age.
MATERIALS AND METHODS
Experimental groups
Eighty-day old Swiss female mice were fed either a SD (providing 3.64 kcal/g, with fat contributing 9.89% of total kcal) or a HFD (providing 5.58 kcal/g, with fat contributing 60.00% of total kcal) and received a daily gavage of 0.2 mL of distilled water [control SD (CTL-SD, n = 12) and CTL-HFD (n = 12) groups)] containing or not, 0.6 µg EE2 plus 60 µg DRSP [COC-SD (n = 11) and COC-HFD (n = 12) groups], for 65 days.
Throughout the experimental period, body weight (BW) and food consumption were recorded weekly. Mice were kept under controlled conditions of temperature (21 ± 2°C), humidity, and a light-dark cycle (lights on: 7:00 am to 7:00 pm). Total food consumption was calculated as the sum of total chow intake (g) during the experimental period, multiplied by the kcal/g provided by SD or HFD. Feed efficiency was obtained by calculating the ratio of total BW gain to total food intake (Da Silva Jr et al. 2020). All experimental procedures were approved by the UFRJ-Macaé’s Animal Care and Use Committee under the certificate number MAC039.
The COC dose used in this study was based on our previous work (Oliveira et al. 2019), in which we observed that administering 0.6 µg EE2 plus 60 µg DRSP, for 35 days, to female mice that fed on a SD led to hepatic morphological alterations associated with potential liver damage. These doses were determined through allometric calculations (Reagan-Shaw et al. 2008) to approximate the EE2 and DRSP concentrations consumed by women using this COC [commercial formulation containing 0.03 mg EE2 and 3 mg DRSP (EMS Pharma, Hortolândia, SP, BRA)]. As COC administration can interfere in the secretion of gonadotropins and ovarian steroids in COC groups, the CTL-SD and CTL-HFD females underwent experimental procedures exclusively during the meta-estrus phase. At this stage of the estrous cycle, plasma concentrations of gonadotropins, estrogen, and progesterone are comparable to those induced by oral contraception (Smith et al. 1975). To confirm this, vaginal smears were collected from CTL-SD and CTL-HFD females on the day of the experiment using 0.9% saline solution and examined under light microscopy (Olympus CX31; Oliveira et al. 2019).
Intraperitoneal glucose tolerance test (ipGTT)
In the last week of the experimental period, all groups were fasted by 12h and submitted to an ipGTT. Fasting blood glucose was measured from a small tail incision using a glucometer (Accu-Chek Performa, Roche Diagnostic, USA). Afterward, all female mice received an intraperitoneal (ip) injection of 2 g glucose/kg BW glucose, and glycemia was again measured at 15, 30, 60, 120 and 180 min (Oliveira et al. 2019).
Feces excretion in 24h
In the last week of the experimental period, each female mouse was housed individually for 24 h in metabolic cages (Tecniplast S.p.a., Buguggiate, VA, Italy) with free access to water and their respective diets. The feces excreted in this period were collected, weighed and stored at -20 °C for posterior fat extraction.
Evaluation of obesity and plasma biochemical nutritional parameters
At the end of the 65-day treatment period with COC and/or diets, all female mice were fasted for 12 h. Blood glucose was then measured using a glucometer (as above described) through a small incision at the tip of the tail. Afterward all female mice were weighed and euthanized by decapitation. Total blood was collected, centrifuged at 12,600 g for 15 min to obtain plasma, which was stored at -20 °C for subsequent biochemical analyses. Plasma TG (cat #K117, Bioclin Química Básica Ltda, Belo Horizonte, MG, Brazil), total cholesterol (CHOL; cat #K083, Bioclin Química Básica Ltda, Belo Horizonte, MG, Brazil), total proteins (Laborclin, Pinhais, PR, Brazil), and albumin (cat #K040, Bioclin Química Básica Ltda, Belo Horizonte, MG, Brazil) were measured with colorimetric reagents. The TG and blood glucose values of each mouse were used to calculate the TyG insulin resistance index using the following formula: Ln [fasting TG (mg/dL) x fasting glycemia (mg/dL)/2] (Simental-Mendía et al. 2008). In addition, the interscapular brown adipose tissue (BAT) and the inguinal white adipose tissue (WAT) were excised and weighed. A laparotomy was performed and the liver and the retroperitoneal, periuterine, parametrial and mesenteric abdominal WAT stores were also excised and weighed. Total abdominal adiposity per mouse was calculated by summing the weights of the retroperitoneal, periuterine, parametrial, and mesenteric WAT depots. Subsequently all thoracic and abdominal organs were excised, and the brain was removed via craniotomy. The carcass was weighed and stored at -20°C to posterior fat extraction.
Carcass chemical mass composition
The carcass of each female mouse was dehydrated at 60 °C for 72 h and then subjected to fat extraction using petroleum ether in a Soxhlet extractor at 60 °C for 2 h. The amount of lipids extracted was expressed as the percentage of carcass weight by multiplying the total fat weight by 100 and dividing by carcass weight. The percentage of lean body mass was determined by subtracting the extracted fat from the carcass weight, multiplying by 100, and dividing by the carcass weight (Rosolen et al. 2024).
Fecal and hepatic lipids extraction
Approximately 100 mg of feces or liver fragments from each female mouse were subjected to overnight total lipid extraction using a 2:1 mixture of chloroform/methanol (Folch et al. 1957). The extracts were filtered and evaporated at room temperature. Total fecal fat excretion was measured by gravimetry. Fecal and hepatic fat extracts were diluted in isopropanol for measurement of TG and total CHOL, as described above.
Liver histopathomorphology and collagen deposition
Liver fragments of 100 mg were collected from all groups and fixed for 48 h in sodium-phosphate buffer pH 7.4, containing 10% formaldehyde and 5% methanol. The samples were then dehydrated, cleared, and embedded in paraffin (Biotec, São José dos Pinhais, PR, Brazil). Semi-serial sections (5 μm thick) with intervals of 100 µm between them were obtained. The sections were subsequently deparaffinized, rehydrated and stained with hematoxylin and eosin (HE), or with picrosirius red dye.
For the hepatic histopathological analysis, two HE-stained sections from each liver were randomly selected. In each section, 16 random fields were photographed at 1000x magnification using a light microscope (Novel BM 2100, China) coupled to a digital camera (Tucsen USB 2.0 H series, China). Based on the method adapted by Liang et al. (2014), and with the aid of Image J free software (https://imagej.nih.gov/ij/download.html), the total number (N.) of hepatocytes per histological image (field) was counted. Subsequently, the N. of hepatocytes with macrovesicular lipid inclusions/field, and/or the N. of hepatocytes with microvesicular lipid inclusions/field, and the N. of hepatocytes with hypertrophy/field (cellular enlargement of more than 1.5 times the normal hepatocyte diameter) were manually counted. These parameters were used to calculate the percentages of macrovesicular and microvesicular steatosis, and hypertrophic hepatocytes/field. The percentage of total area affected by these hepatic steatosis features was categorized into the following scores: 0 (< 5% of affected hepatocytes), 1 (5% to 33%), 2 (34% to 66%) and 3 (> 66%). The scores for macrovesicular steatosis, microvesicular steatosis and hypertrophy were summated to obtain the hepatic steatosis score. To assess hepatic inflammation, five random fields/section from two liver sections per female mouse were photographed at 100x magnification. The number of clusters containing ≥ 5 inflammatory cells/field was counted. The mean number of inflammatory foci/field was scored as: 0 (inflammatory foci/field: < 0.5), 1 (inflammatory foci/field: 0.5 to 1.0), 2 (inflammatory foci/field: 1.0 to 2.0) and 3 (inflammatory foci/field: > 2.0), to obtain the inflammation score (Liang et al. 2014). Additionally, the N. of non-hepatocytes/field (inflammatory, endothelial, Kupffer, Ito and ductal cells) was counted, and the hepatocytes/non-hepatocytes ratio per field was analyzed (Oliveira et al. 2019).
For quantification of hepatic collagen deposition, two picrosirius red-stained sections from each liver were randomly selected. In each section, 6 random fields were photographed at 400x magnification using a light microscope (Olympus BX21TF, Olympus Corporation, Tokyo, Japan) coupled to a digital camera (Olympus DP72, Olympus Corporation, Tokyo, Japan). The percentage of the area positively stained with picrosirius red was calculated in the liver sections by determining the specific threshold for pink/red color with the aid of the “Colour threshold” plugin of the Image J Software (https://imagej.nih.gov/ij/download.html).
Quantitative Real time PCR
Fragments of 50 mg of interscapular BAT and liver from each female mouse were submitted to RNA extraction using TRizol® reagent (Invitrogen/Thermo Fisher Scientific, Waltham, MA, USA). Afterward, the mRNA was reverse transcribed into cDNA using a cDNA synthesis kit (Thermo Fisher Scientific, Waltham, MA, USA). For mRNA expression analysis, 20 ng of cDNA were mixed with Sybr Green qPCR master mix (Merck, St. Louis, MO, USA) and 300 nM of each primer. Amplification was performed and detected using a 7500 Real-Time PCR System (Applied Biosystems, Waltham, MA, USA). The primer sequences used for gene expression analysis were purchased from the manufacturer (Exxtend Biotecnologia Ltda., Paulínia, SP, Brazil) and are shown in Table I. The mRNA levels were quantified using the 2−ΔΔCT method, and the relative mRNA expression of each target gene was normalized to the expression of the ribosomal protein L32 (Rpl32).
Statistical analysis
Data are presented as means ± SEM. The area under the curve (AUC) was calculated using trapezoidal integration. The data were initially analyzed for normality using the Komorogov-Smirnov test. Since the study involved two independent variables (COC treatment and the type of diet), variances were analyzed using two-way ANOVA, followed by Tukey post-test. Statistical significance was set at p < 0.05.
RESULTS
Effects of COC on obesity development and adiposity parameters in female mice fed on a SD or HFD
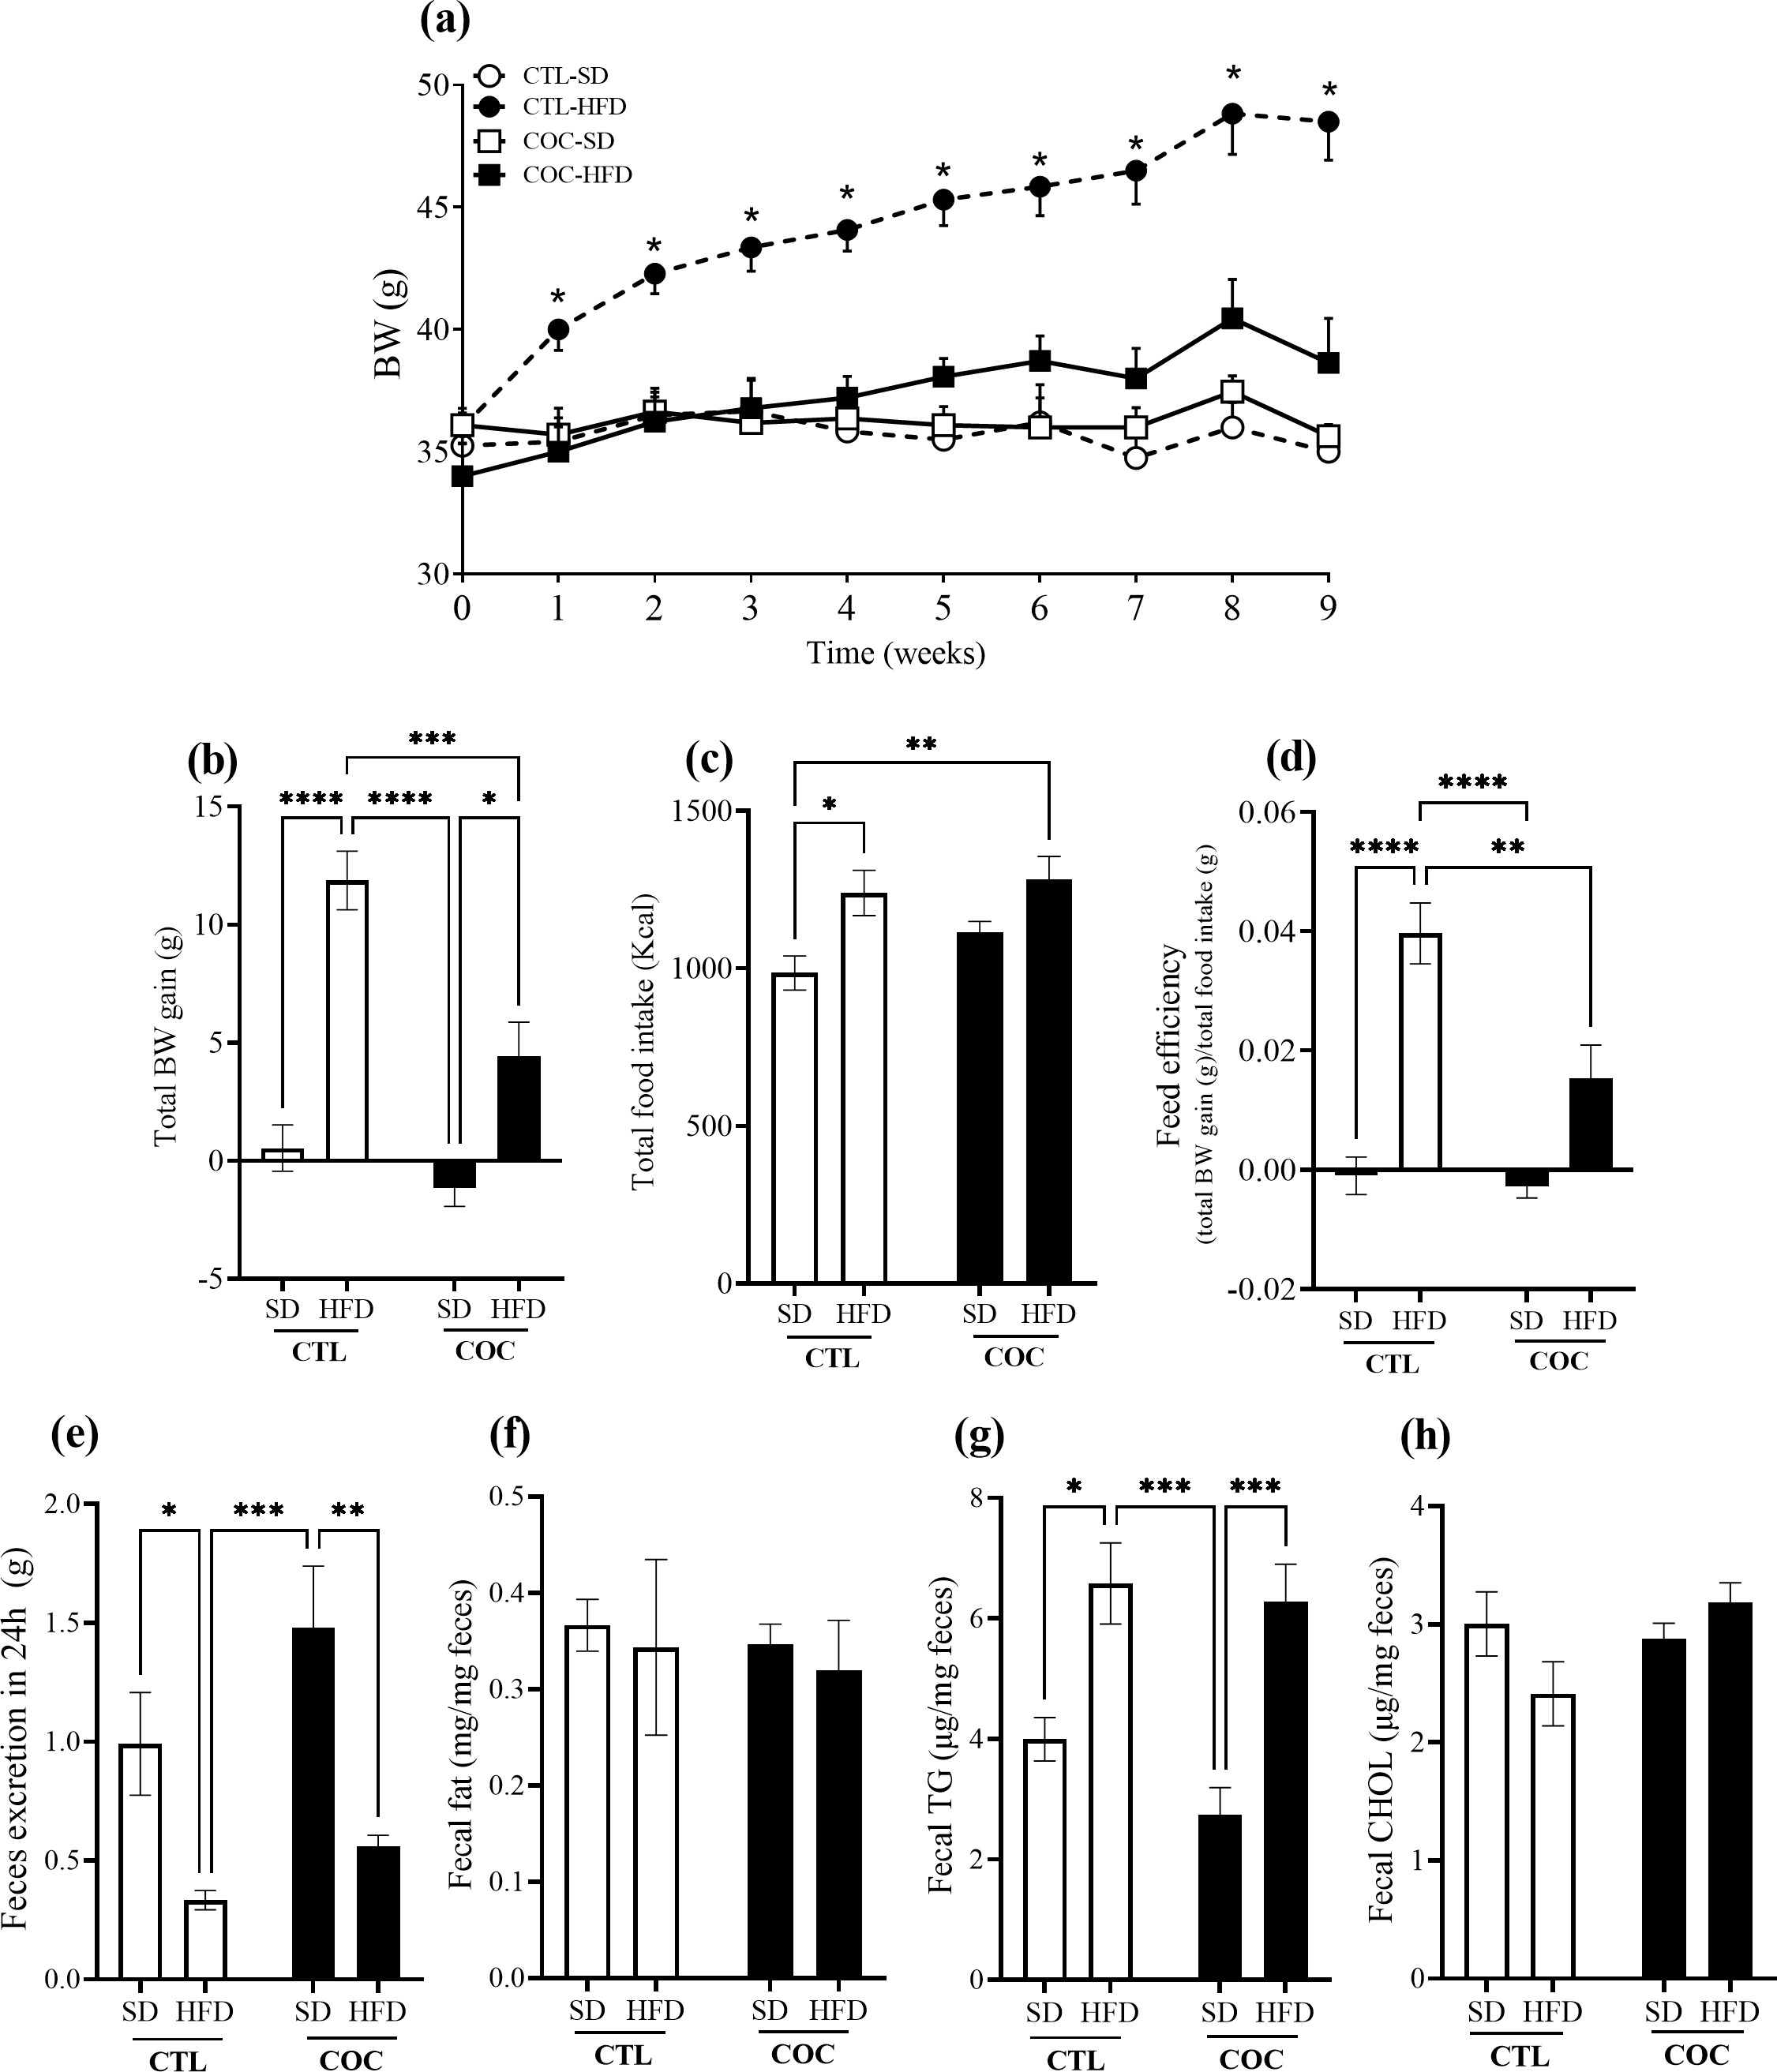
COC treatment for 65 days did not significantly affect BW in female mice fed on a SD (Figure 1a). In contrast, consumption of HFD significantly increased BW in CTL-HFD females from the first week to the end of experiment, compared to the weekly BW of CTL-SD females (p < 0.01, Figure 1a). COC administration attenuated the increase in BW induced by HFD intake in COC-HFD group (Figure 1a). A significant effect of COC (p = 0.0004), HFD (p < 0.0001) and their interaction (p = 0.022) was observed on total BW gain. Although COC treatment did not change BW gain in COC-SD group (Figure 1b), it led to a lower total BW gain in the COC-HFD group, since females gained approximately only 5 g over the experimental period, compared to COC-SD (p < 0.05). While, CTL-HFD females exhibited the highest total BW gain among all experimental groups (Figure 1b), gaining approximately 11 g of BW, in comparison with CTL-SD (p < 0.0001, Figure 1b). Importantly, two-way ANOVA analysis revealed significant effects of COC (p = 0.007), HFD (p < 0.0001) and their interaction (p = 0.02) on feed efficiency, but only effect of the diet on total food intake (p = 0.001). Post-test analysis demonstrated that CTL-HFD exhibited higher caloric intake (p = 0.03; Figure 1c) and feed efficiency (p = 0.005, Figure 1d). Conversely, COC-HFD females displayed lower feed efficiency than CTL-HFD females (p < 0.002, Figure 1d), despite having similar total food intake between COC-HFD and CTL-HFD groups (Figure 1c).
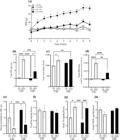
BW (a) registered during 9 weeks of the experimental period in CTL-SD (n = 12), CTL-HFD (n = 12), COC-SD (n = 11) and COC-HFD (n = 12) female mice. * Indicate that CTL-HFD females were different from all other experimental groups (two-way ANOVA followed by Tukey post-test, p < 0.05). Means ± SEM of total BW gain (b), food intake (c), feed efficiency (d), feces excretion in 24 h (e), fecal fat (f), fecal TG (g) and fecal CHOL (h) levels in CTL-SD (n = 12), CTL-HFD (n = 12), COC-SD (n = 11) and COC-HFD (n = 12) female mice. Lines over the bars indicate statistical differences among the indicated groups. * p < 0.05, ** p < 0.01, *** p < 0.001 and ****p < 0.0001 (two-way ANOVA followed by Tukey post-test).
In addition, significant effects of COC (p = 0.02) and diet (p < 0.0001) on the amount of feces excreted in 24h were observed (Figure 1e); while fecal TG levels were affected only by diet (p < 0.0001; Figure 1g). Post-test revealed that COC treatment did not alter the amount of feces excreted in 24h, or the fat, TG or CHOL contents in the feces of COC-SD females, compared to CTL-SD (Figure 1e-h). HFD intake led to a reduction of 66% and 63% in the amount of feces excreted in 24 h in CTL-HFD and COC-HFD groups, respectively, compared to CTL-SD and COC-SD females (p = 0.02 and p = 0.003; Figure 1e). Despite total fecal fat excretion not being modified by COC treatment or HFD intake (Figure 1f), the fecal TG concentrations were higher in CTL-HFD and COC-HFD groups (p = 0.03 and p < 0.001, respectively; Figure 1g).
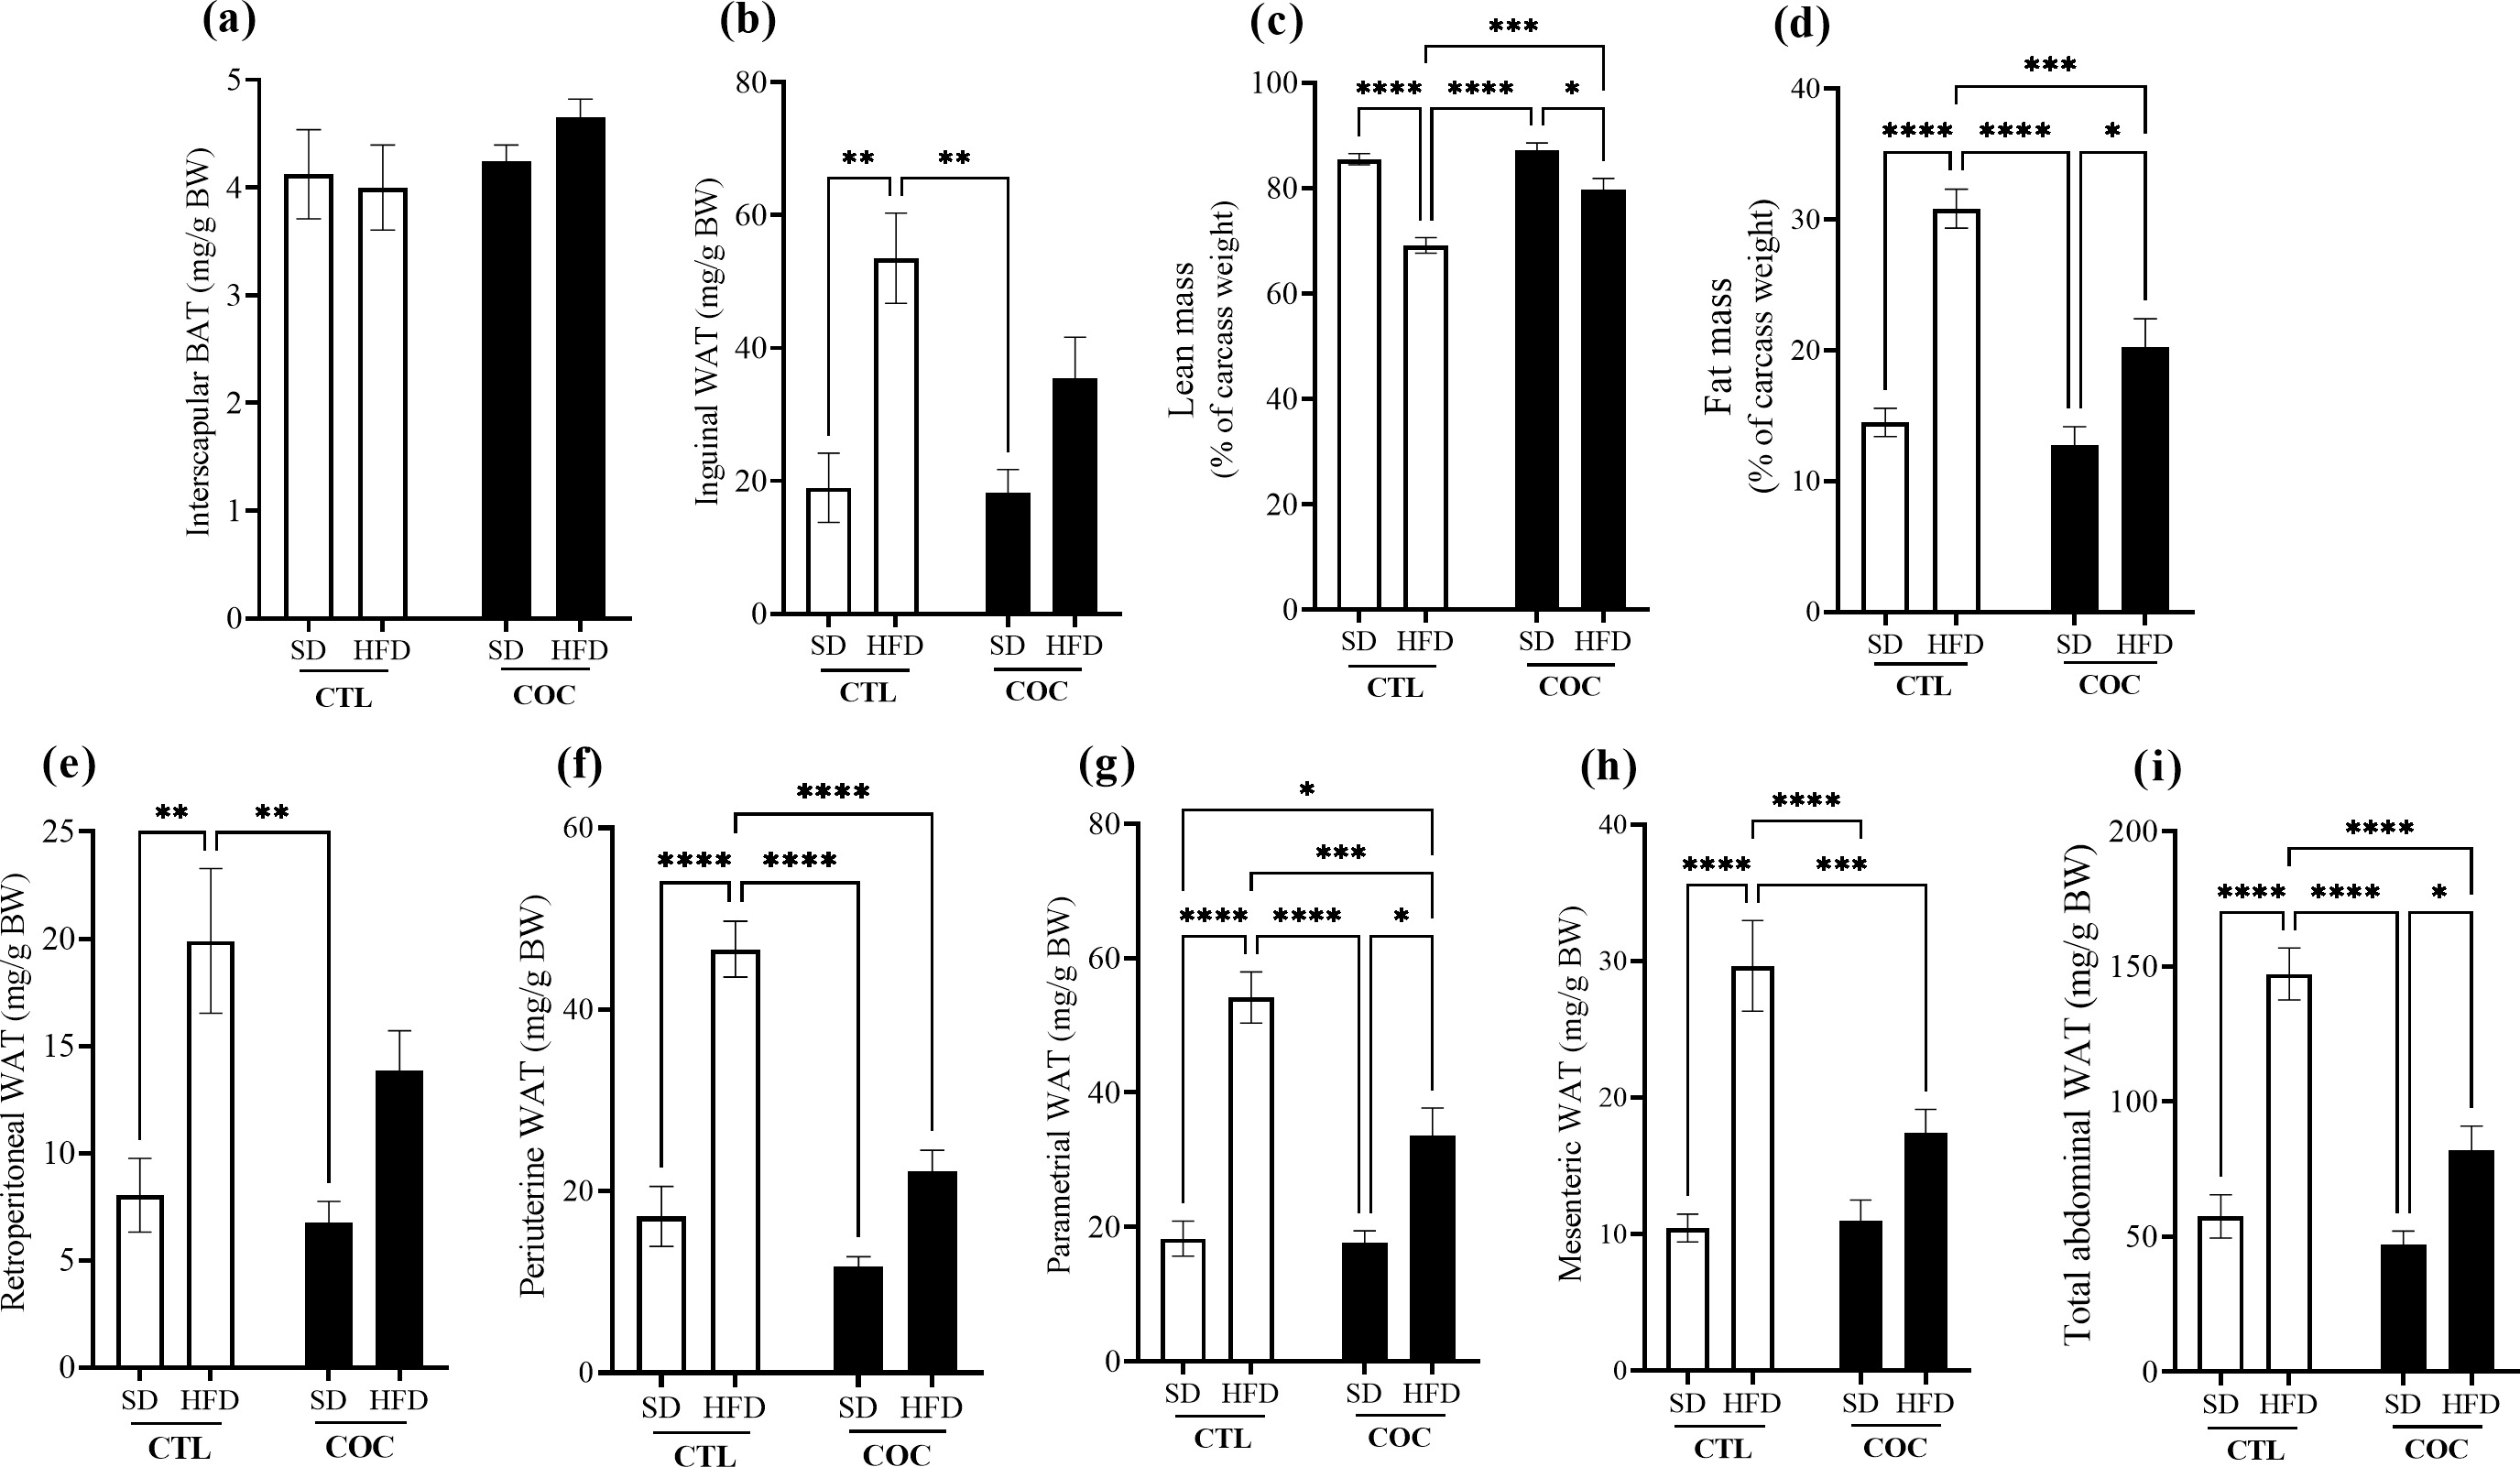
Regarding adiposity, two-way ANOVA revealed a diet-dependent effect for inguinal and retroperitoneal WAT weights (Figure 2b and e), and significant effects of COC, diet and their interaction on the percentage of lean (Figure 2c) and fat (Figure 2d) masses in the carcasses, as well as on the weights of periuterine (Figure 2f), parametrial (Figure 2g), and mesenteric (Figure 2h) WAT stores. Post-test analysis showed no differences in the amount of interscapular BAT (Figure 2a), inguinal WAT (Figure 2b) or in total subcutaneous fat content in carcasses (Figure 2d), as well as, in abdominal WAT stores (Figure 2e-i) among COC-SD and CTL-SD females. HFD intake increased subcutaneous fat deposition, as evidenced by 182% and 113% higher inguinal WAT weight (Figure 2b) and percentage of subcutaneous fat in carcass (Figure 2d), respectively, in CTL-HFD females, compared to CTL-SD (p < 0.005 and p < 0.0001). CTL-HFD females also exhibited a 19% reduction in the percentage of lean mass in their carcasses (p < 0.0001, Figure 2c) and augmented visceral adiposity, with higher weights of various abdominal WATs depots (p < 0.05, Figure 2e-h) and greater total abdominal adiposity (p < 0.0001, Figure 2i), when compared to CTL-SD. COC treatment attenuated these HFD-induced effects in COC-HFD females, since the percentage of subcutaneous fat in carcass (p < 0.001, Figure 2d), and the weights of the periuterine (p < 0.0001; Figure 2f), parametrial (p < 0.0005, Figure 2g), mesenteric (p < 0.001, Figu
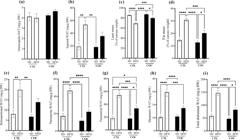
Means ± SEM of weight of the interscapular BAT (a) and inguinal WAT (b), percentage of lean (c) and fat (d) masses in the carcass, weight of the retroperitoneal (e), periuterine (f), parametrial (g), mesenteric (h) and total abdominal (i) WAT depots in CTL-SD (n = 12), CTL-HFD (n = 12), COC-SD (n = 11) and COC-HFD (n = 12) female mice. Lines over the bars indicate statistical differences among the indicated groups. * p < 0.05, ** p < 0.01, *** p < 0.001 and ****p < 0.0001 (two-way ANOVA followed by Tukey post-test).
Effects of COC on glucose homeostasis and plasma lipids and protein profiles in female mice fed on a SD or HFD
Table II shows nutritional biochemical parameters evaluated at the end of experimental period in fasted CTL and COC females fed either a SD or a HFD. Two-way ANOVA showed a significant effect of diet on plasma TG levels (p = 0.002) and on TyG index (p < 0.0001), as well as a significant interaction among COC and diet for the TyG index (p = 0.04). Post-test analysis demonstrated that fasting plasma concentrations of glucose, TG, total CHOL, total proteins and albumin were similar between COC-SD and CTL-SD females (Table II). HFD consumption led to an increase in plasma TG levels in CTL-HFD females, compared to CTL-SD (p = 0.002; Table II). Additionally, the TyG insulin resistance index was 12% higher in CTL-HFD females than in CTL-SD (p = 0.0014; Table II). However, in COC-HFD group, plasma TG levels and TyG index did not differ from those in the COC-SD and CTL-HFD groups (Table II).
Plasma glucose, lipid, and protein concentrations in fasting CTL and COC females fed either a SD or a HFD.
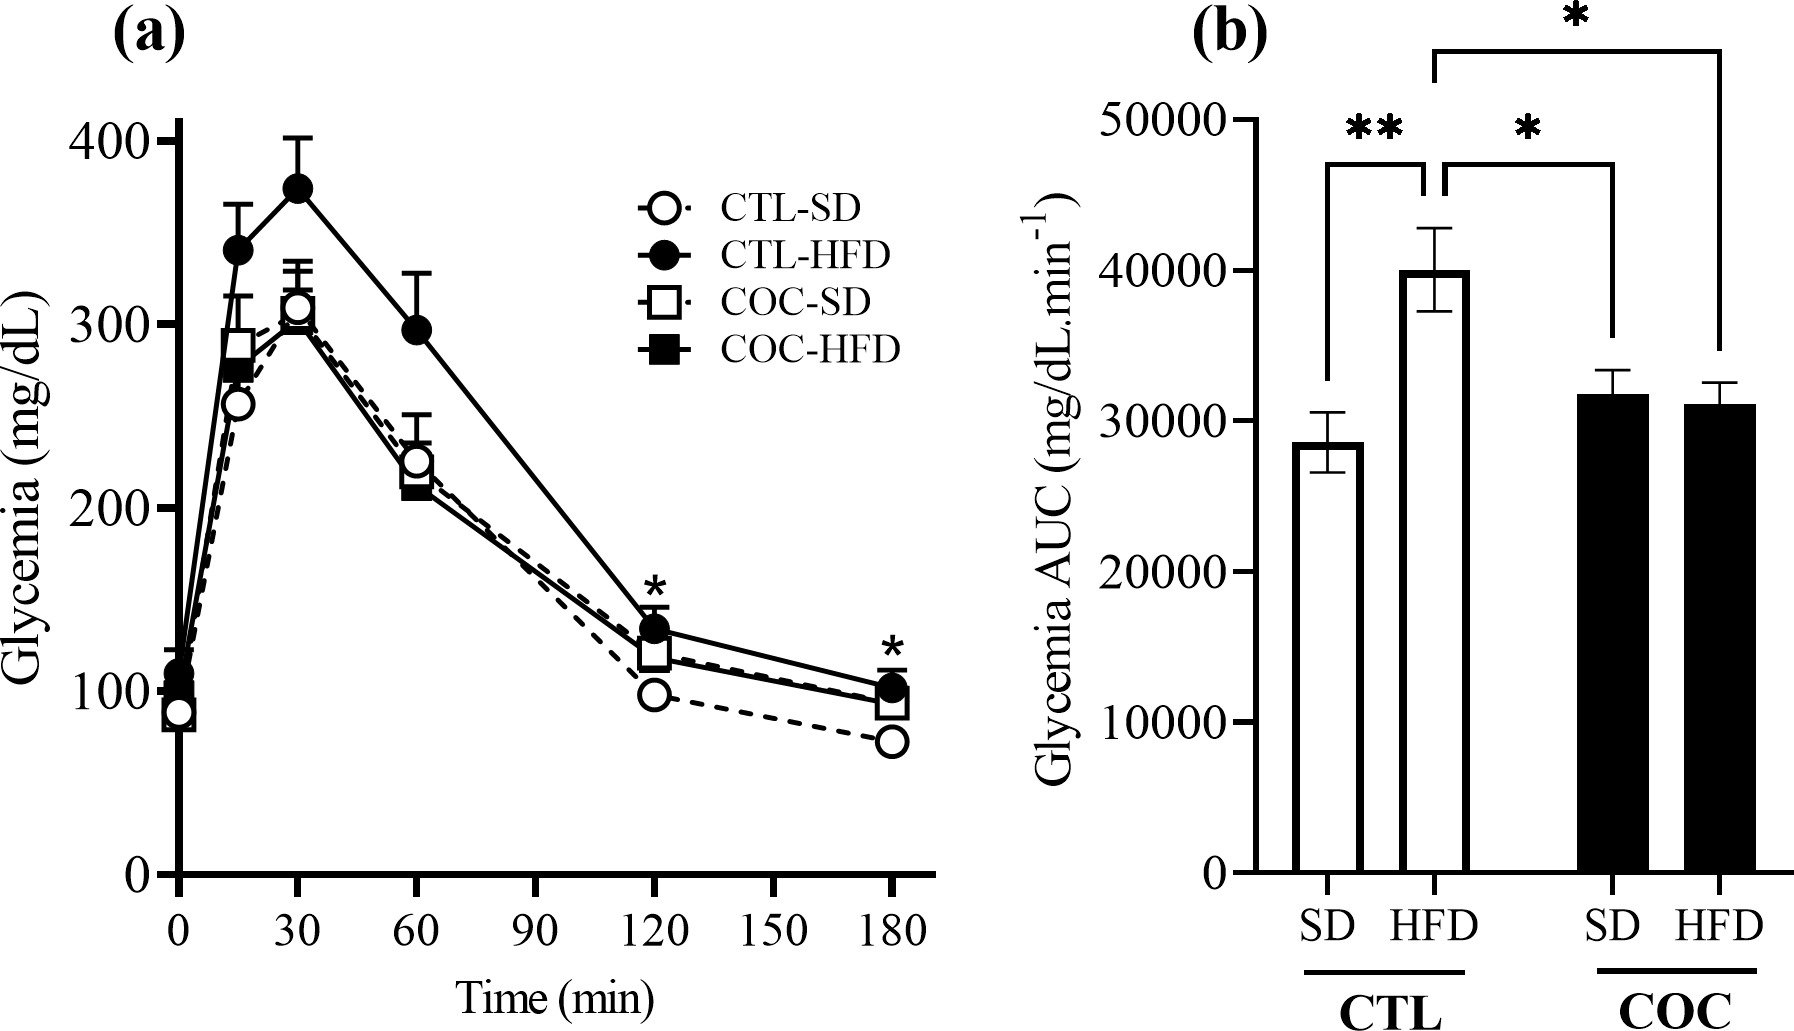
When subjected to an ipGTT, all fasted female mice exhibited a glycemia peak at 60 min, with levels returning close to basal glycemia at 180 min of the test. Two-way ANOVA showed a significant effect of diet at 120 and 180 min (p = 0.04 and p = 0.03, respectively), along with significant interactions among COC treatment and HFD at 15, 120 and 180 min (p = 0.04, p = 0.02 and p = 0.02, respectively). As can be seen in Figure 3a, HFD increased glycemia at 120 and 180 min of the test only in CTL-HFD, when compared with CTL-SD (p = 0.02 and p = 0.01, respectively). Furthermore, a significant effect of diet (p < 0.001) and an interaction among COC treatment and diet (p < 0.005) were observed for total glycemia during the ipGTT. Post-test analysis indicated that HFD increased total glycemia during the test only in CTL-HFD (p < 0.05, Figure 3b).
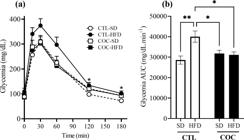
(a) Glycemia profile during the ipGTT performed in the last week of experimental period in CTL-SD (n = 10), CTL-HFD (n = 10), COC-SD (n = 10) and COC-HFD (n = 10) female mice. Glycemia was measured before and after an ip injection of 2 g/kg BW glucose. * Indicates a significant difference between CTL-HFD and CTL-SD (two-way ANOVA followed by Tukey post-test, p < 0.05). Means ± SEM of the total glycemia during the ipGTT (b), expressed by area under glycemia curve (AUC). Lines over the bars indicate statistical differences among the indicated groups. * p < 0.05 and ** p < 0.01 (two-way ANOVA followed by Tukey post-test).
Effects of COC on liver morphology, hepatic steatosis, and inflammation in female mice fed on a SD or HFD
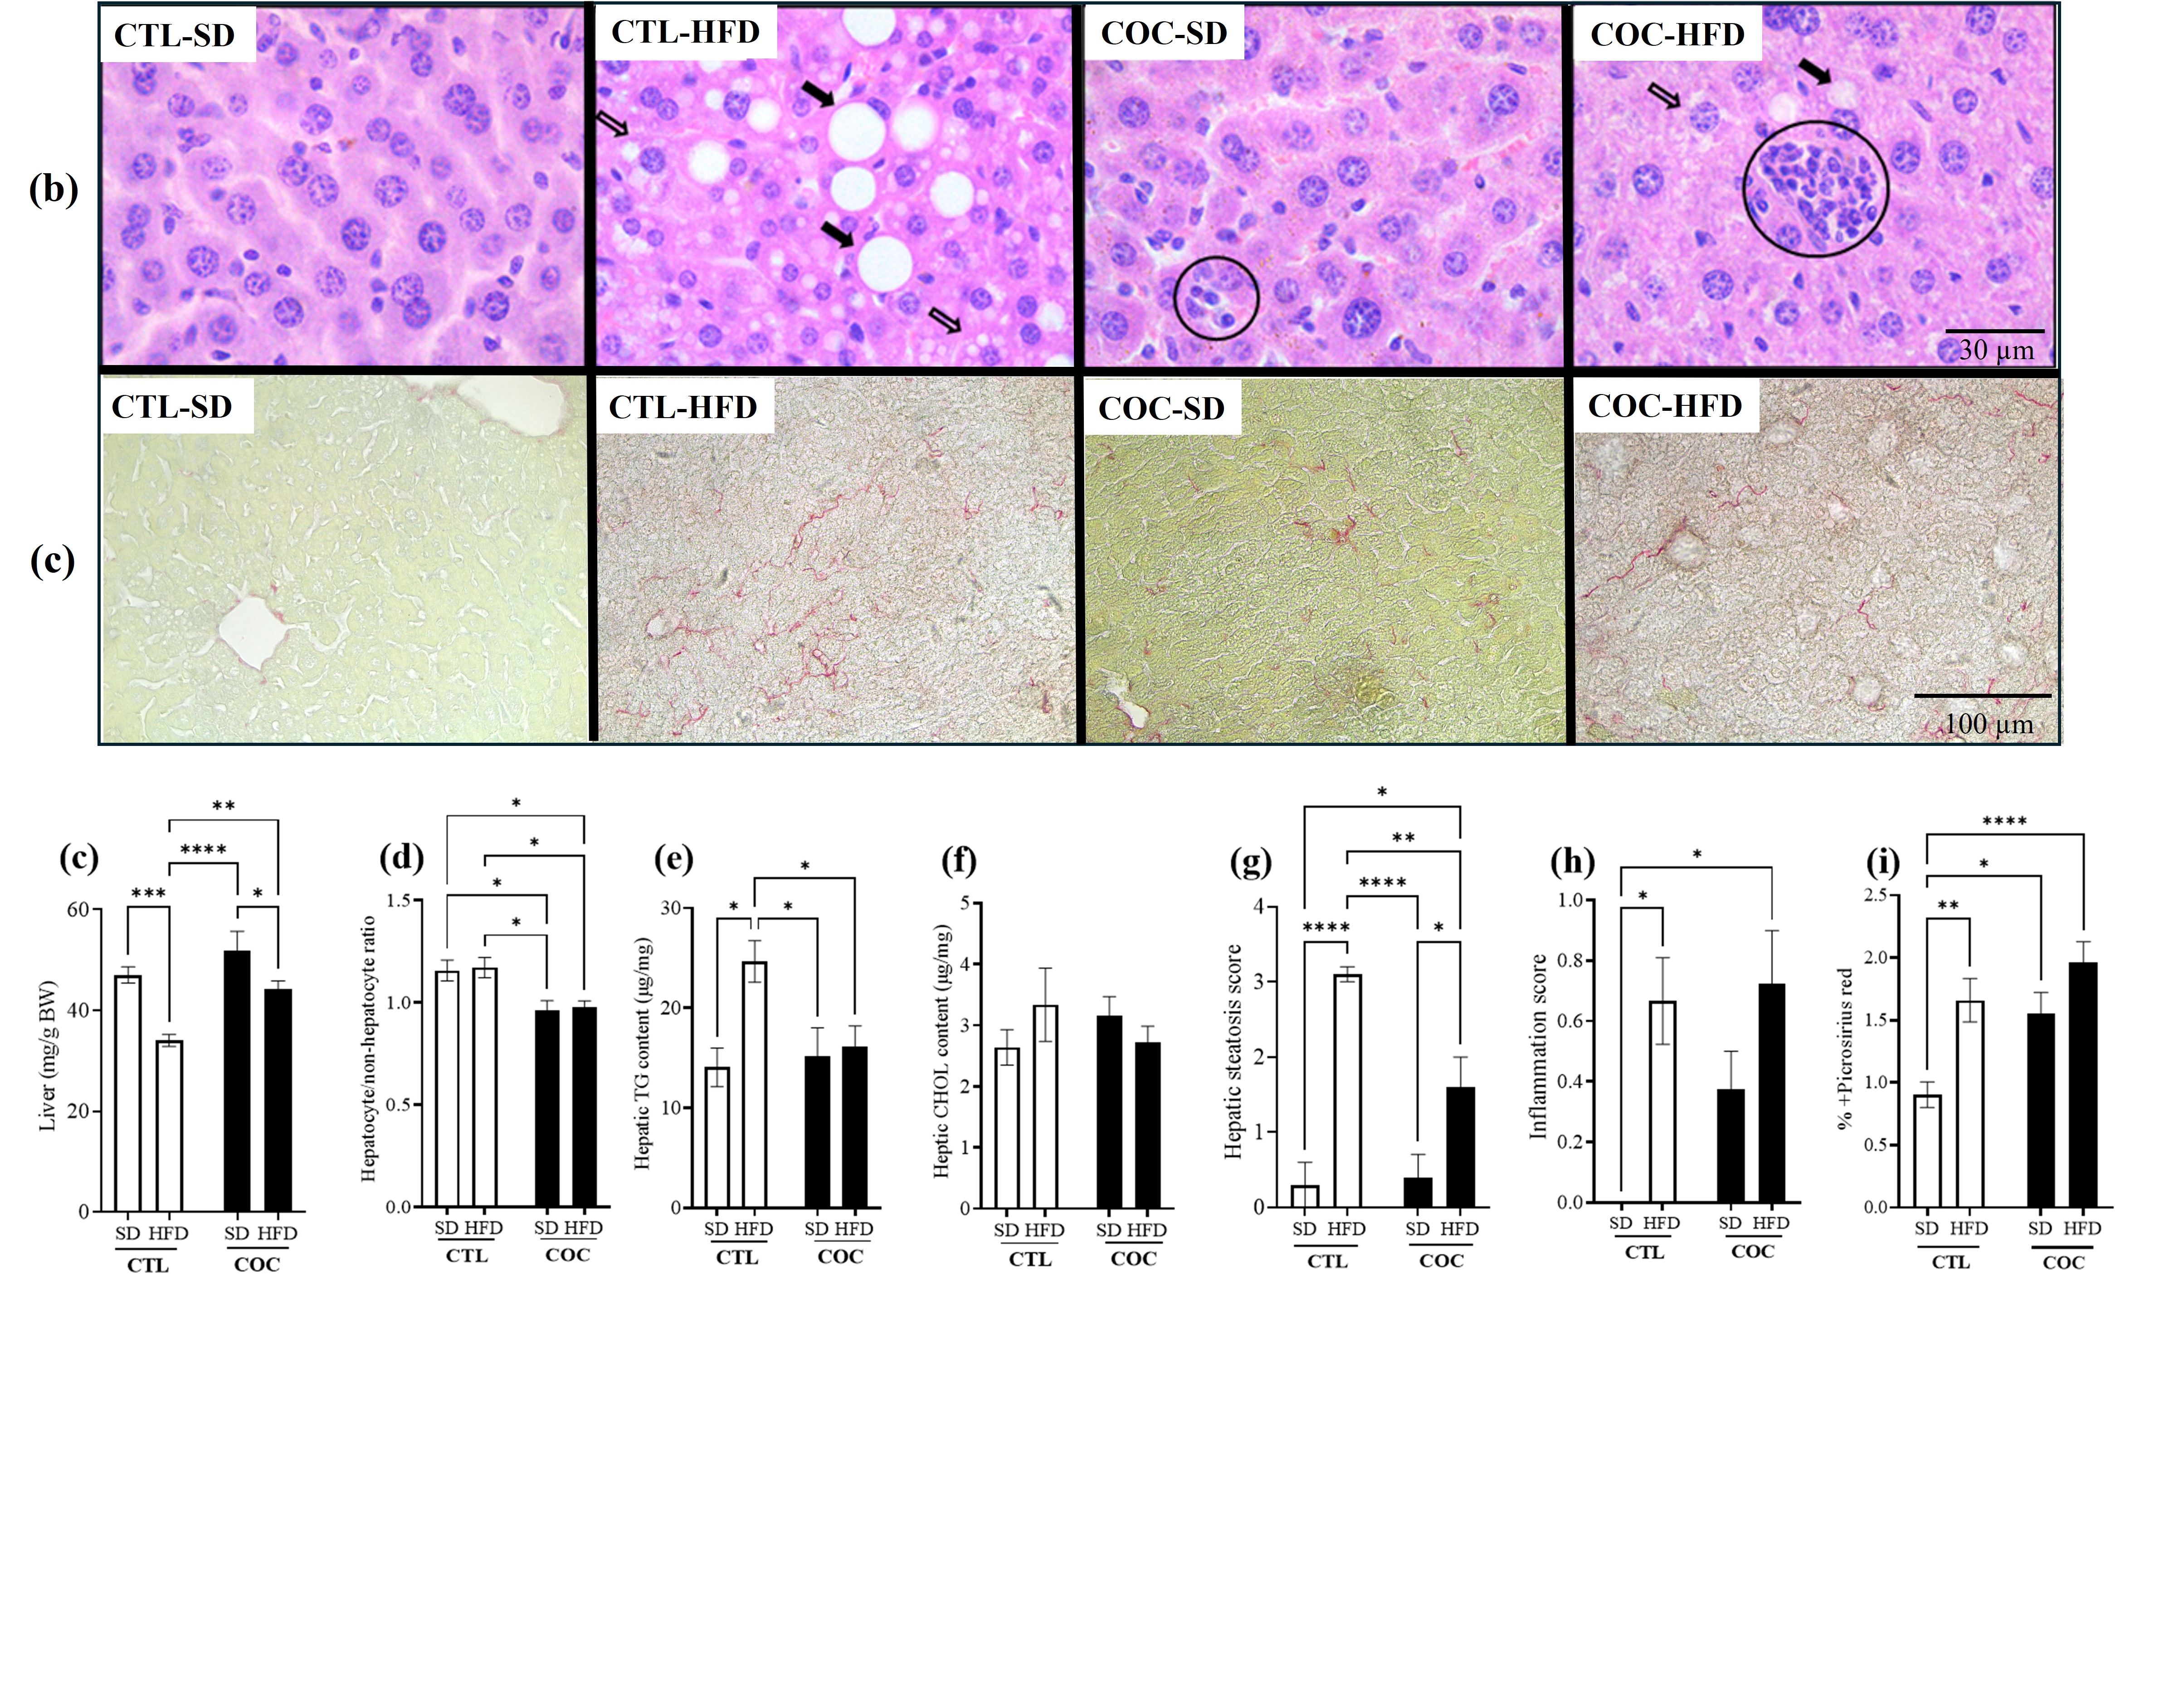
Figure 4 shows biochemical and histopathological analyses of hepatic steatosis in the livers of CTL and COC females fed either a SD or a HFD. Two-way ANOVA revealed significant effects of COC (p < 0.01) and diet (p < 0.0001) on liver weight. As shown in Figure 4c, COC treatment did not change liver weight in COC-SD compared to CTL-SD. However, HFD reduced liver weight in both COC-HFD and CTL-HFD groups, when compared with their respective control groups (p < 0.05 and p < 0.0005, respectively). Also, COC-HFD females exhibited a 30% higher liver weight than CTL-HFD (p < 0.01; Figure 4c).
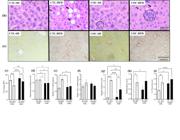
Representative histological sections (5-μm in thick) of the livers of CTL-SD, CTL-HFD, COC-SD and COC-HFD female mice stained with HE (a; scale bar = 30 µm) or picrosirius red (b; scale bar = 100 µm). Transparent arrow = microvesicular steatosis; Black arrow = macrovesicular steatosis; Circle = inflammatory infiltrate. Means ± SEM of liver weight (c), hepatocyte/non-hepatocyte ratio (d), TG (e) and CHOL (f) contents in the liver, hepatic steatosis (g) and inflammation (h) scores, and the percentage area positive (+) for picrosirius red staining (i) in the livers of CTL-SD (n = 10), CTL-HFD (n = 10), COC-SD (n = 10) and COC-HFD (n = 10) female mice. Lines over the bars indicate statistical differences among the indicated groups. * p < 0.05, ** p < 0.01, *** p < 0.001 and **** p < 0.0001 (two-way ANOVA followed by Tukey post-test).
At the microscopical level, morphometric analysis of the hepatic parenchyma revealed a significant effect of COC treatment on the N. of non-hepatocytes/field analyzed (p < 0.0001) and in the hepatocyte/non-hepatocyte ratio (p < 0.0001). In accordance, COC treatment caused a significant increase in the N. of non-hepatocytes/field in the livers of COC-SD (43.60 ± 1.46, p < 0.001), compared to CTL-SD (34.20 ± 1.43). In COC-HFD, there was only a trend toward an increase in this parameter (p = 0.09; 42.06 ± 1.52), compared to CTL-HFD (36.44 ± 1.98). The N. of hepatocyte/field analyzed remained similar across all groups: CTL-SD (38.05 ± 1.44), CTL-HFD (41.75 ± 1.75), COC-SD (41.55 ± 7.70), and COC-HFD (41.39 ± 1.45). However, the hepatocyte/non-hepatocyte ratio was significantly lower in both COC-SD and COC-HFD, when compared to CTL-SD (p < 0.02) and CTL-HFD (p < 0.03; Figure 4d), respectively.
Regarding hepatic lipids concentrations, a significant diet effect (p < 0.02), and interaction (p < 0.05) were observed for liver TG content. Also, two-way ANOVA revealed effects of COC treatment (p < 0.03), diet (p < 0.0001) and their interaction (p < 0.02) on hepatic steatosis scoring. The inflammation score was affected only by diet (p < 0.01). Post-test analysis showed that COC-SD and CTL-SD livers had similar TG (Figure 4e) and CHOL (Figure 4f) concentrations, as well as statistically comparable steatosis (Figure 4g) and inflammation scores (Figure 4h).
HFD increased hepatic TG content by 75% in CTL-HFD group (p = 0.02; Figure 4e), with no changes in hepatic CHOL levels (Figure 4f). Histopathological analysis revealed that all CTL-HFD mice (100%) developed hepatic steatosis, exhibiting hepatocytes with disorganized tissue distribution, large lipid vacuoles displacing nucleus to the periphery (macrovesicular steatosis), and small lipid inclusions (microvesicular steatosis; Figure 4a). Accordingly, CTL-HFD females had significantly higher hepatic steatosis (Figure 4g) and inflammation (Figure 4h) scores, than CTL-SD (p < 0.0001 and p < 0.02).
Notably, in the COC-HFD group, 30% of liver samples showed no hepatic steatosis, while 10%, 30% and 30% of COC-HFD females exhibited steatosis scores of 1, 2 and 3, respectively, predominantly of the microvesicular type (Figure 4a). Consequently, hepatic steatosis score was higher in COC-HFD, than in COC-SD (p < 0.04, Figure 4g). However, hepatic TG and CHOL contents in COC-HFD females were comparable to those in COC-SD (Figure 4e and f). Also, hepatic TG levels were lower in COC-HFD, than in CTL-HFD group (p = 0.03, Figure 4e). The inflammation score in COC-HFD did not differ from those in COC-SD or CTL-HFD groups but was significantly higher than in CTL-SD (p < 0.02, Figure 4h).
Figure 4I shows the percentage of collagen-positive (+) area in the liver parenchyma of CTL and COC females. Two-way ANOVA indicated significant effects of COC treatment (p < 0.005) and diet (p < 0.0005) on hepatic collagen deposition. Post-test analysis showed that COC treatment increased the percentage area for collagen in the livers of COC-SD females, compared to CTL-SD (p < 0.03, Figure 4i). HFD also increased hepatic collagen deposition in CTL-HFD (p < 0.005). The hepatic collagen content in COC-HFD was like that observed in CTL-HFD group (Figure 4i).
Effects of COC on BAT and liver mRNA expressions in female mice fed on a SD or HFD
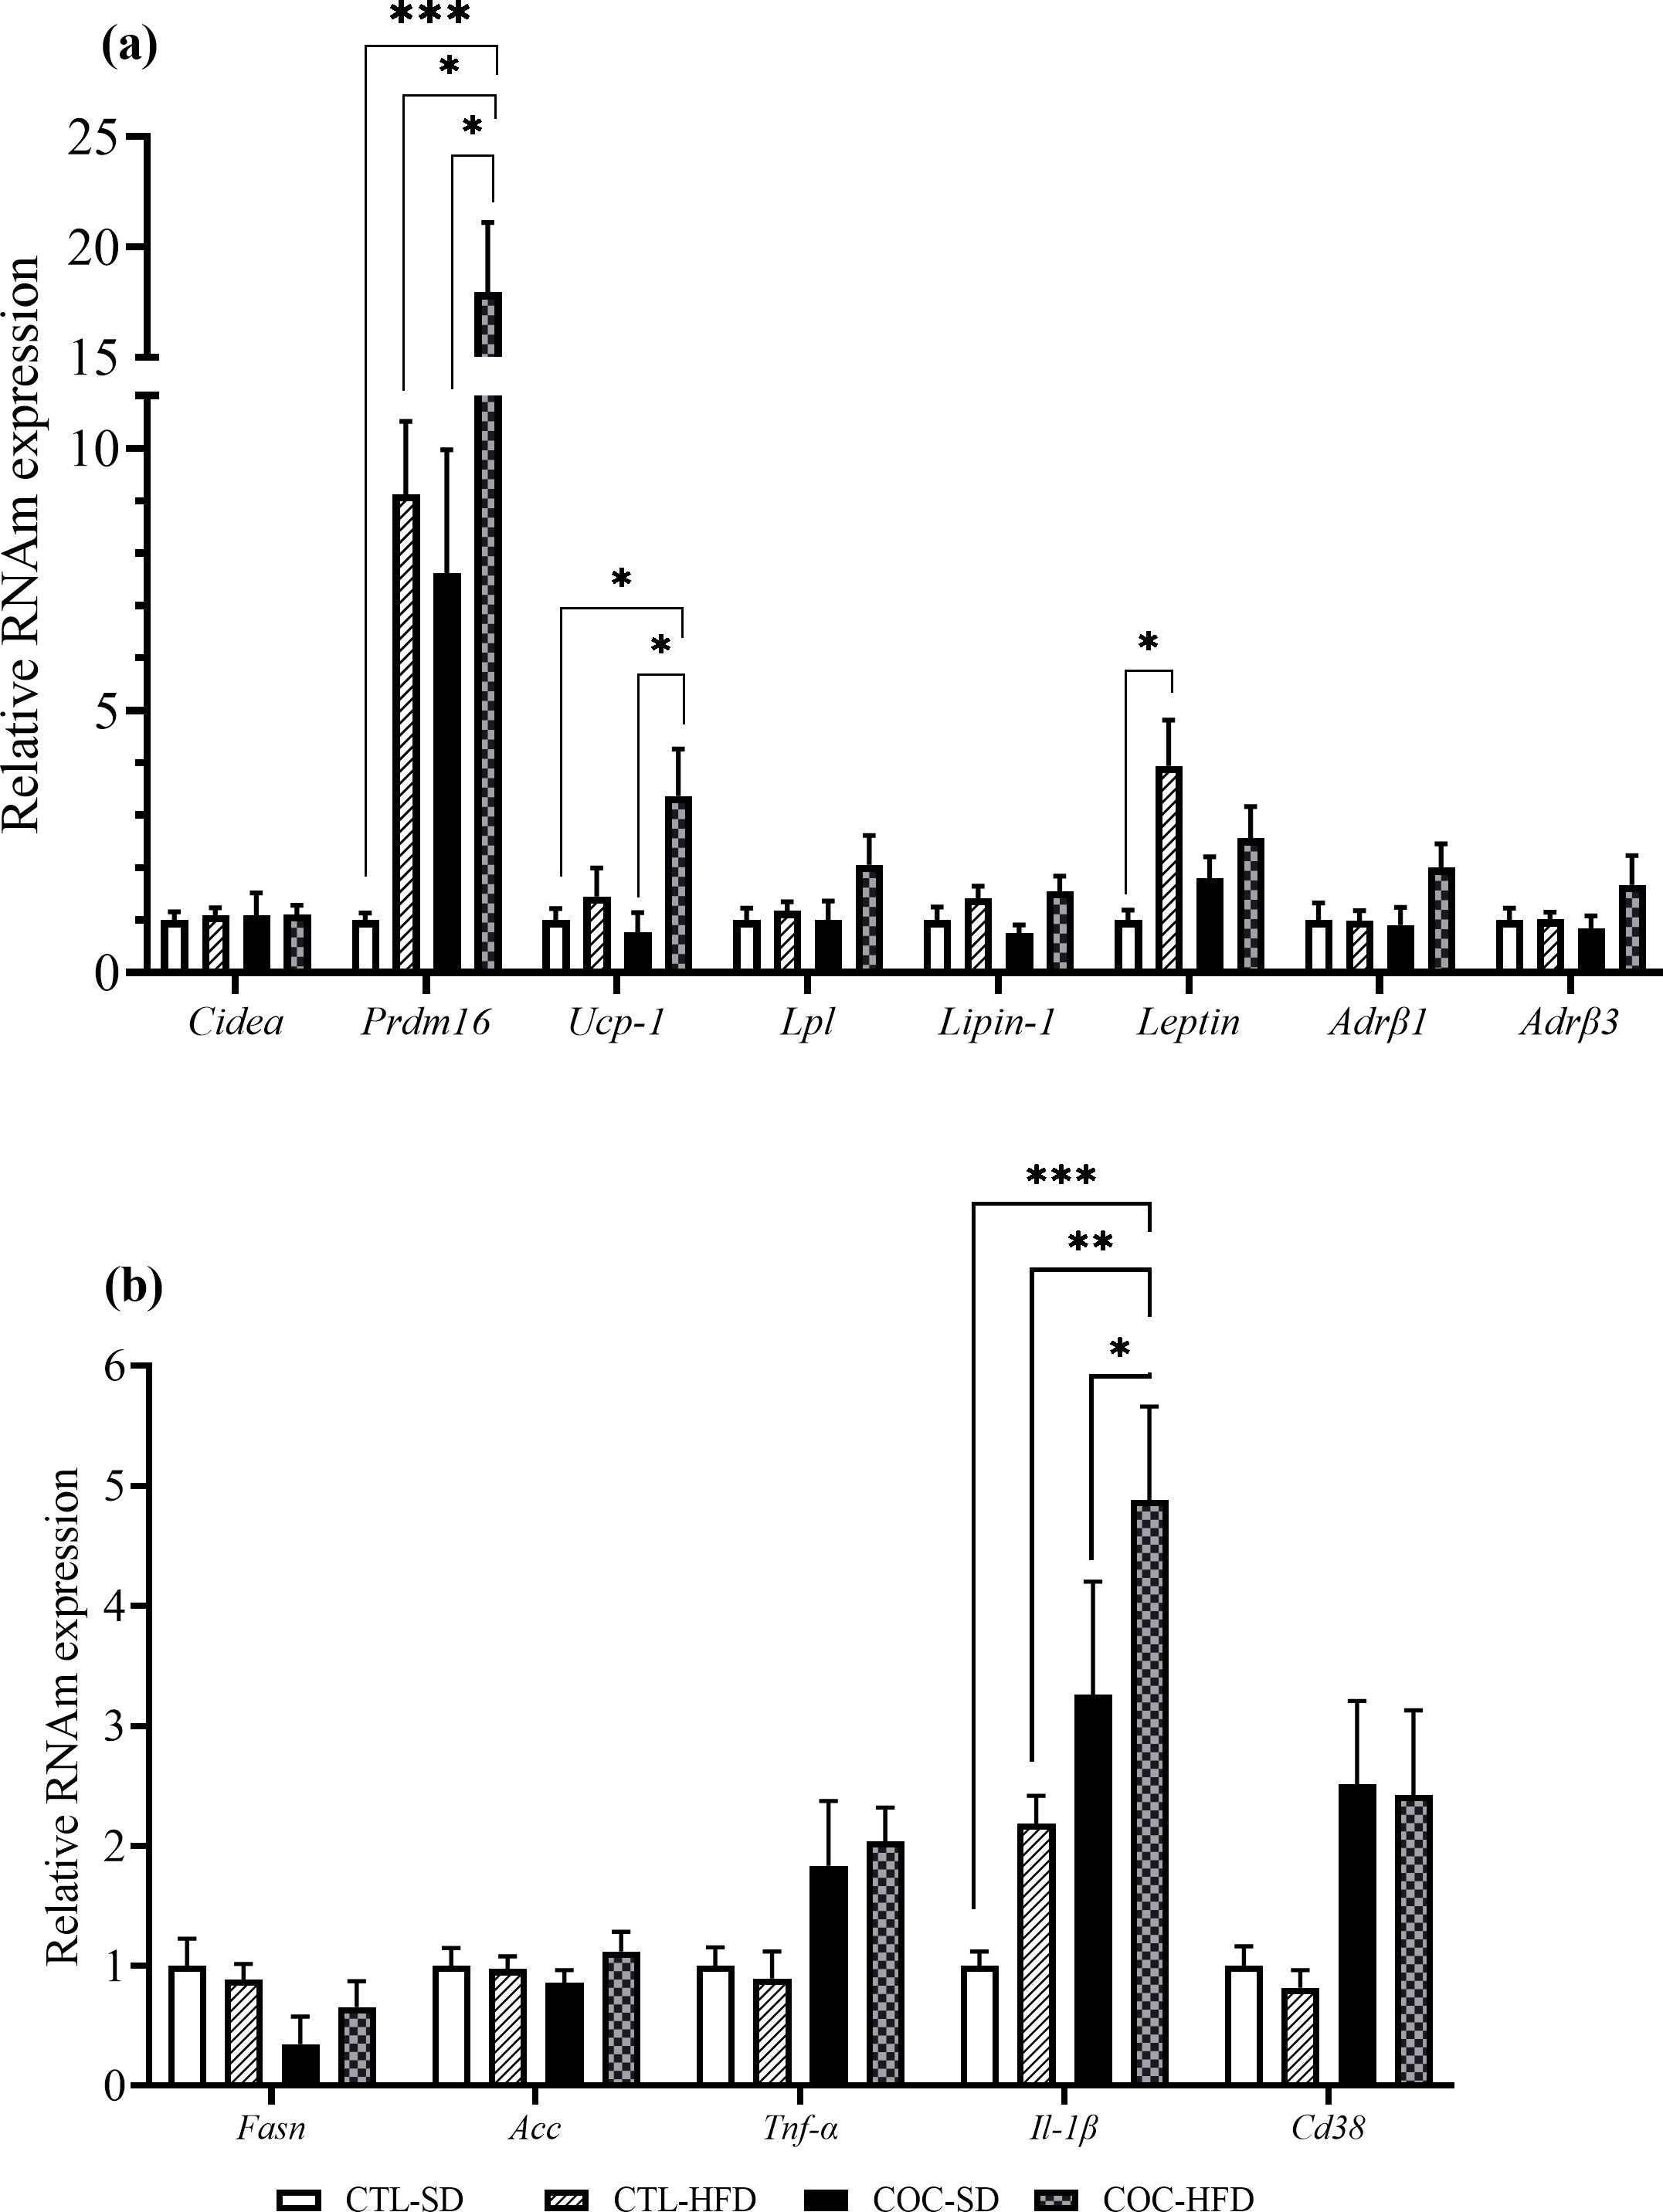
Figure 5a presents the mRNA expression profiles of genes involved in BAT function (Harms et al. 2014, Seale et al. 2007) in CTL and COC females fed either a SD or a HFD. Two-way ANOVA revealed a significant effect of COC treatment on Prdm16 mRNA expression (p < 0.005), and diet effect on Prmd16, Ucp-1 and leptin gene expressions (p < 0.05). Although some BAT genes exhibited a trend toward variation in COC-SD group, their relative mRNA expression levels were not significantly different from those observed in CTL-SD females (Figure 5a). HFD significantly upregulated Leptin gene expression in CTL-HFD females (p = 0.04). Notably, in the BAT of COC-HFD females, Prdm16 and Ucp-1genes were significantly increased compared to COC-SD (p = 0.02 and p = 0.04, Figure 5a). Furthermore, Prdm16 gene expression in COC-HFD was 96% higher than in CTL-HFD (p < 0.05; Figure 5a).
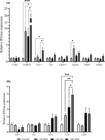
Means ± SEM of the relative mRNA expression of genes encoding Cidea, Prdm16, Ucp-1, Lpl, Lipin-1, Leptin, Adrβ1 and Adrβ3 in interscapular BAT (a), and Fasn, Acc1, Tnf-α, Il-1β and Cd38 in the liver (b) of CTL-SD (n = 7), CTL-HFD (n = 8), COC-SD (n = 7) and COC-HFD (n = 7) female mice. Lines over the bars indicate statistical differences among the groups for the gene indicated. * p < 0.05, ** p < 0.01, *** p < 0.001 and **** p < 0.0001 (two-way ANOVA followed by Tukey post-test).
In Figure 5a illustrates the hepatic mRNA expression of some genes involved in de novo lipogenesis (Zhu et al. 2023) and inflammation (Mirea et al. 2018, Negrin et al. 2014) in in CTL and COC females fed on a SD or a HFD. Two-way ANOVA showed significant effects of COC treatment (p < 0.001) and diet (p < 0.01) on mRNA expression of Il-1β. Post-test analysis revealed that hepatic Il-1β gene expression was significantly higher in COC-HFD than in CTL-HFD group (p = 0.01; Figure 5b). Although other genes showed some degree of variation, no statistically significant differences were observed in the hepatic mRNA expressions of Fasn, Acc1, Tnf-α and Cd38 among the groups.
DISCUSSION
The present study demonstrated that administering a COC composed of EE2 and DRSP for 65 days in reproductive-age female mice attenuated some obesogenic effects of a HFD. This was evidenced by lower BW (Figure 1a and b) and reduced adiposity gains (Figure 2) in COC-HFD females, which may be linked to modifications in energy expenditure. Despite similar caloric intake (Figure 1c) and fat excretion in feces (Figures 1h-h) compared to CTL-HFD mice, COC-HFD females exhibited lower feed efficiency (Figure 1d), suggesting increased energy expenditure. This metabolic shift was likely driven by enhanced BAT function, as evidenced by the upregulation of Prdm16 and Ucp-1 genes in the BAT of COC-HFD females (Figure 5a).
PRDM16 is a transcriptional co-regulator essential for brown adipocytes differentiation and the maintenance of their thermogenic identity, partly by inducing Ucp-1 gene expression, which encodes the main protein responsible for energy dissipation in BAT (Harms et al. 2014, Seale et al. 2007). Previous studies indicate that DRSP promotes WAT beiging in HFD-fed C57Bl/6 female mice by upregulating Prdm16 and Ucp-1 gene expressions (Armani et al. 2014). Although research on EE2’s effects on BAT is limited, studies on estradiol’s preventive role in HFD-induced obesity suggest that it can increase Ucp-1 gene expression in adipocytes through epigenetic mechanisms (Al-Qahtani et al. 2017). Based on these findings, we speculate that the increased Prdm16 mRNA in the BAT of the COC-HFD group was primarily driven by DRSP, while both EE2 and DRSP likely contributed to the enhanced expression of Ucp-1 gene. Together, these BAT modifications may have enhanced energy expenditure, reducing energy storage and ultimately attenuating obesity development in COC-HFD females.
It is important to highlight that the attenuation of adiposity observed in this study has not been previously demonstrated with a COC composed of EE2 and DRSP. However, similar results were observed in C57Bl/6 female mice fed on a HFD containing EE2 and LNG for 12 or 20 weeks (Fuller et al. 2022). Additionally, when administered alone, DRSP has been shown to inhibit adipocyte differentiation and hypertrophy (Armani et al. 2014, Caprio et al. 2011), and prevent HFD-induced obesity in C57Bl/6 female mice (Armani et al. 2014). But it is important to note that such study, DRSP was delivered via a subcutaneous implant releasing 6 mg DRSP/kg/day, a significantly higher dose than the 0.15 mg/kg/day used in the COC of our study.
In line with our previous findings (Oliveira et al. 2019) and clinical studies in women using COCs containing EE2 and DRSP (Oelkers et al. 1995), COC administration did not alter glucose tolerance in COC-SD mice, but prevented glucose intolerance in COC-HFD females (Figure 3). This protective action was unexpectedly, as in an early study, we observed that the administration of this COC for 35 days to Swiss female mice fed on a SD, increased insulin secretion and reduced insulin clearance (Oliveira et al. 2019). This raised the possibility that prolonged COC use, especially under metabolic stressors such as HFD intake, might impair insulin sensitivity. Further investigations are needed to evaluate insulin secretion, action and clearance in COC-HFD mice. Based on existing literature on rodents treated with DRSP (Armani et al. 2014) or estradiol (Chambliss et al. 2016) and exposed to an obesogenic challenge, we speculate that each hormone in the COC may have played roles in maintaining glucose homeostasis in response to HFD.
COC treatment also increased the N. of non-hepatocytes in the liver parenchyma of COC-SD and reduced the hepatocyte/non-hepatocyte ratio in COC-SD and COC-HFD groups (Figure 4d). Previously, in COC-treated female mice that fed on SD for 35 days, we also observed a reduction in hepatocyte/non-hepatocyte ratio, but only a trend toward an increase in N. non-hepatocyte/field analyzed in liver parenchyma (Oliveira et al. 2019). Furthermore, COC-HFD females exhibited lower ectopic fat deposition in the liver, resulting in a milder hepatic steatosis compared to CTL-HFD group (Figure 4g). On the other hand, the inflammation score was similar among COC-HFD and CTL-HFD (Figure 4h). Notably, only COC-HFD females exhibited a significant increase in hepatic expression of Il-1β gene (Figure 5b), indicating that liver injury induced by HFD is exacerbated by COC treatment. IL-1β expression plays a role in the development of hepatic steatosis by stimulating Fasn expression (Negrin et al. 2014) and contributes to NAFLD progression, by promoting hepatic stellate cell activation, proliferation, and survival, leading to liver fibrosis (Mirea et al. 2018). Since the increase in Il-1β gene expression in the COC-HFD group was not accompanied by changes in Fasn and Acc1 mRNA levels, it is possible that this proinflammatory cytokine primarily contributed to the inflammation and hepatic collagen content observed in the livers of the COC-HFD females.
The pronounced signs of inflammation in the livers of the COC-HFD group, evidenced by the higher hepatic Il-1β gene expression (Figure 5b), along with the increased hepatic collagen deposition in the COC-SD group (Figure 4b and i) and reductions in the hepatocyte/non-hepatocyte ratio in both COC-HFD and COC-SD females (Figure 4d), raises concerns about potential hepatic side effects of EE2 and DRSP. Remarkably, EE2 plus LNG administration in C57Bl/6 female mice for 12 weeks attenuated HFD-induced adiposity but caused liver damage due to impaired oxidative stress defenses (Fuller et al. 2022). Importantly, liver damages as intrahepatic cholestasis, has been observed in contraceptive users or in susceptible women during pregnancy (Kreek 1987). Additionally, C57Bl/6 female mice treated with 10 mg EE2/kg for 5 days exhibited various liver abnormalities, including inflammatory infiltrates, degeneration of hepatocytes with vacuolized cytoplasm, and increased proliferation of hepatocytes. These effects were mediated through estrogen receptor (ER)-α activation, as ER-α knockout mice did not develop hepatotoxicity following EE2 exposure (Yamamoto et al. 2006). In this context, the cellular and extracellular matrix modifications observed in COC-treated females may be partially attributed to the EE2 component of the COC.
In summary, the administration of a COC composed of EE2 and DRSP to female mice of reproductive age attenuated HFD-induced obesity, impairments in glucose homeostasis, and fat deposition in the liver, but did not prevent hepatic inflammation and fibrosis. The attenuation in obesity development may involve increased energy expenditure, as the COC upregulated Prdm16 and Ucp-1 genes in the BAT of COC-HFD females. However, the morphological changes observed in the liver of COC-treated groups suggest potential liver damage induced by the COC. Notably, when combined with HFD, COC treatment increased Il-1β gene expression, a pro-inflammatory cytokine that may exacerbate hepatic injury under obesogenic conditions.
Acknowledgements
This study forms part of the M.Sc. Thesis of Janaina de Oliveira Chaves† and was partially supported by grants from: Coordenação de Aperfeiçoamento de Pessoal de Nível Superior (CAPES, Finance Code 001). All experimental procedures were approved by the UFRJ-Macaé’s Animal Care and Use Committee under the certificate number: MAC039.
References
- ALLEN RH, KAUNITZ AM & HICKEY M. 2016. Hormonal Contraception. In: Melmed S et al. (Eds), Williams Textbook of Endocrinology, Elsevier, p. 664-693.
- AL-QAHTANI SM, BRYZGALOVA G, VALLADOLID-ACEBES I, KORACH-ANDRÉ M, DAHLMAN-WRIGHT K, EFENDIĆ S, BERGGREN P-O & PORTWOOD N. 2017. 17β-Estradiol suppresses visceral adipogenesis and activates brown adipose tissue-specific gene expression. Horm Mol Biol Clin Investig 29: 13-26.
- ARMANI A ET AL. 2014. Mineralocorticoid receptor antagonism induces browning of white adipose tissue through impairment of autophagy and prevents adipocyte dysfunction in high-fat-diet-fed mice. FASEB J 28: 3745-3757.
- BADMUS OO & OLATUNJI LA. 2019. Involvement of glucocorticoid and mineralocorticoid receptors in lipid accumulation and depressed G6PD activity in the livers of rats treated with postpartum oral estrogen-progestin. Naunyn Schmiedebergs Arch Pharmacol 392: 913-924.
- BJUNE, JAN-INGE, STRØMLAND PP, JERSIN RÅ, MELLGREN G & DANKEL SN. 2022. Metabolic and Epigenetic Regulation by Estrogen in Adipocytes. Front Endocrinol (Lausanne) 13: 828780.
- CAPRIO M, ANTELMI A, CHETRITE G, MUSCAT A, MAMMI C, MARZOLLA V, FABBRI A, ZENNARO M-C & FEVE B. 2011. Antiadipogenic Effects of the Mineralocorticoid Receptor Antagonist Drospirenone: Potential Implications for the Treatment of Metabolic Syndrome. Endocrinology 152: 113-125.
- CHAMBLISS KL ET AL. 2016. Non-Nuclear Estrogen Receptor Activation Improves Hepatic Steatosis in Female Mice. Endocrinology 157: 3731-3741.
- CONTOS MJ, CHOUDHURY J, MILLS AS & SANYAL AJ. 2004. The histologic spectrum of nonalcoholic fatty liver disease. Clin Liver Dis 8: 481-500.
-
DA SILVA JR JA, DA SILVA AC, FIGUEIREDO LS, ARAUJO TR, FREITAS IN, CARNEIRO EM, RIBEIRO ES & RIBEIRO RA. 2020. D-pinitol increases insulin secretion and regulates hepatic lipid metabolism in MSG-obese mice. An Acad Bras Cienc 92: e20201382. DOI: 10.1590/0001-3765202020201382.
» https://doi.org/10.1590/0001-3765202020201382 - FERRARA BE & RUTLAND ED. 1988. Liver tumor in long-term user of oral contraceptives. Postgrad Med 84: 107-109.
- FOLCH J, LEES M & SLOANE STANLEY GH. 1957. A simple method for the isolation and purification of total lipides from animal tissues. J Biol Chem 226: 497.
- FULLER KNZ, MCCOIN CS, STIERWALT H, ALLEN J, GANDHI S, PERRY CGR, JAMBAL P, SHANKAR K & THYFAULT JP. 2022. Oral combined contraceptives induce liver mitochondrial reactive oxygen species and whole-body metabolic adaptations in female mice. J Physiol 600: 5215-5245.
- HARMS MJ, ISHIBASHI J, WANG W, LIM H-W, GOYAMA S, SATO T, KUROKAWA M, WON K-J & SEALE P. 2014. Prdm16 Is Required for the Maintenance of Brown Adipocyte Identity and Function in Adult Mice. Cell Metab 19: 593-604.
- JENSEN JT & SPEROFF L. 2000. Health benefits of oral contraceptives. Obstet Gynecol Clin North Am 27: 705-721.
- KRATTENMACHER R. 2000. Drospirenone: pharmacology and pharmacokinetics of a unique progestogen. Contraception 62: 29-38.
- KREEK M. 1987. Female Sex Steroids and Cholestasis. Semin Liver Dis 7: 8-23.
- LEE SR, KWON SW, KAYA P, LEE YH, LEE JG, KIM G, LEE G-S, BAEK I-J & HONG E-J. 2018. Loss of progesterone receptor membrane component 1 promotes hepatic steatosis via the induced de novo lipogenesis. Sci Rep 8: 15711.
- LIANG W, MENKE AL, DRIESSEN A, KOEK GH, LINDEMAN JH, STOOP R, HAVEKES LM, KLEEMANN R & VAN DEN HOEK AM. 2014. Establishment of a general NAFLD scoring system for rodent models and comparison to human liver pathology. PLoS ONE 9: e115922.
- LIEBERMAN DA, KEEFFE EB & STENZEL P. 1984. Severe and prolonged oral contraceptive jaundice. J Clin Gastroenterol 6: 145-148.
- MIREA A-M, TACK CJ, CHAVAKIS T, JOOSTEN LAB & TOONEN EJM. 2018. IL-1 Family Cytokine Pathways Underlying NAFLD: Towards New Treatment Strategies. Trends Mol Med 24: 458-471.
- NEGRIN KA, ROTH FLACH RJ, DISTEFANO MT, MATEVOSSIAN A, FRIEDLINE RH, JUNG D, KIM JK & CZECH MP. 2014. IL-1 Signaling in Obesity-Induced Hepatic Lipogenesis and Steatosis. PLoS ONE 9: e107265.
- NG CH, LIM WH, LIM GEH, TAN DJH, SYN N, MUTHIAH MD, HUANG DQ & LOOMBA R. 2022. Mortality Outcomes by Fibrosis Stage in Nonalcoholic Fatty Liver Disease: A Systematic Review and Meta-analysis. Clin Gastroenterol Hepatol 21(4): 931-939.e5.
- OELKERS W, FOIDART JM, DOMBROVICZ N, WELTER A & HEITHECKER R. 1995. Effects of a new oral contraceptive containing an antimineralocorticoid progestogen, drospirenone, on the renin-aldosterone system, body weight, blood pressure, glucose tolerance, and lipid metabolism. J Clin Endocrinol Metab 80: 1816-1821.
- OLIVEIRA CAR ET AL. 2019. Combined oral contraceptive in female mice causes hyperinsulinemia due to β-cell hypersecretion and reduction in insulin clearance. J Steroid Biochem Mol Biol 190: 54-63.
- REAGAN-SHAW S, NIHAL M & AHMAD N. 2008. Dose translation from animal to human studies revisited. FASEB J 22: 659-661.
- RIAZI K, AZHARI H, CHARETTE JH, UNDERWOOD FE, KING JA, AFSHAR EE, SWAIN MG, CONGLY S, KAPLAN GG & SHAHEEN A-A. 2022. The prevalence and incidence of NAFLD worldwide: a systematic review and meta-analysis. Lancet Gastroenterol Hepatol 7: 851-861.
- ROSOLEN APF, RIBEIRO RA, TELEKEN JL, DE OLIVEIRA CHAVES J, PADILHA SC, GOES ME, MORARI J, BOSCHERO AC, BALBO SL & BONFLEUR ML. 2024. Pubertal glyphosate-based herbicide exposure aggravates high-fat diet-induced obesity in female mice. Environ Sci Pollut Res 31: 15872-15884.
- SEALE P, KAJIMURA S, YANG W, CHIN S, ROHAS LM, ULDRY M, TAVERNIER G, LANGIN D & SPIEGELMAN BM. 2007. Transcriptional Control of Brown Fat Determination by PRDM16. Cell Metab 6: 38-54.
- SIMENTAL-MENDÍA LE, RODRÍGUEZ-MORÁN M & GUERRERO-ROMERO F. 2008. The product of fasting glucose and triglycerides as surrogate for identifying insulin resistance in apparently healthy subjects. Metab Syndr Relat Disord 6: 299-304.
- SINCLAIR M, SCHELLEMAN A, SANDHU D & ANGUS PW. 2017. Regression of hepatocellular adenomas and systemic inflammatory syndrome after cessation of estrogen therapy. Hepatology 66: 989-991.
- SMITH MS, FREEMAN ME & NEILL JD. 1975. The control of progesterone secretion during the estrous cycle and early pseudopregnancy in the rat: prolactin, gonadotropin and steroid levels associated with rescue of the corpus luteum of pseudopregnancy. Endocrinology 96: 219-226.
-
UNITED NATIONS. 2020. Contraceptive use by method 2019. Data booklet. https://digitallibrary.un.org/record/3849735?v=pdf
» https://digitallibrary.un.org/record/3849735?v=pdf - VELÁZQUEZ KT, ENOS RT, BADER JE, SOUGIANNIS AT, CARSON MS, CHATZISTAMOU I, CARSON JA, NAGARKATTI PS, NAGARKATTI M & MURPHY EA. 2019. Prolonged high-fat-diet feeding promotes non-alcoholic fatty liver disease and alters gut microbiota in mice. World J Hepatol 11: 619-637.
- WANG J, WU AH, STANCZYK FZ, PORCEL J, NOUREDDIN M, TERRAULT NA, WILKENS LR & SETIAWAN VW. 2021. Associations Between Reproductive and Hormone-Related Factors and Risk of Nonalcoholic Fatty Liver Disease in a Multiethnic Population. Clin Gastroenterol Hepatol 19: 1258-1266.
- YAMAMOTO Y, MOORE R, HESS HA, GUO GL, GONZALEZ FJ, KORACH KS, MARONPOT RR & NEGISHI M. 2006. Estrogen Receptor alpha Mediates 17 alpha-Ethynylestradiol Causing Hepatotoxicity. J Biol Chem 281: 16625-16631.
- ZHU Z, ZHANG X, PAN Q, ZHANG L & CHAI J. 2023. In-depth analysis of de novo lipogenesis in non-alcoholic fatty liver disease: Mechanism and pharmacological interventions. Liver Res 7: 285-295.