 The role of local hydrology and leaf habit in leaf phenology patterns over 52 years of monitoring of canopy trees in central Amazonia, Brazil
ABSTRACT
Phenological cycles of tropical trees are shaped by environmental factors, yet the role of soil-water gradients on leaf phenology of equatorial forests remains poorly understood. We assessed the effects of water table depth (WT), classified into three categories based on Height Above Nearest Drainage (HAND) levels: Low (7-20m), representing shallow WT and greater root water access, Intermediate (21-60m) and High (61-89m), corresponding to deep WT and limited root water access, on leaf production and shedding of 547 canopy trees, monitored monthly for 52 years in Central Amazonia. Our results demonstrate that local hydrology is associated with phenological strategies and canopy persistence. Drier, high-HAND environments exhibited lower leaf flushing frequencies, a marked decline in mature leaves after 1990, and more frequent, prolonged canopy leaf-loss events. Conversely, wetter low-HAND sites showed higher leaf turnover and shorter flushing periods. Intra-annually, leaf flushing peaked during the dry season across all environments, but timing and intensity varied: low-HAND areas displayed bimodal patterns and earlier peaks (September), while high-HAND areas showed later peaks (October). Both deciduous and evergreen species responded to seasonal drought, but their temporal synchrony tended to be stronger in higher HAND environments, where climatic constraints are more severe. In wetter sites, weaker synchrony suggests reduced seasonal limitation on leaf production. We conclude that hydrological gradient and leaf habit jointly shape phenological dynamics, with drier environments experiencing greater canopy loss and tighter seasonal constraints on leaf renewal. These findings highlight the importance of local hydrological niches in forest responses to environmental change.
Keywords:
groundwater; tropical phenology; time-series; long-term monitoring, cryptic phenology
RESUMO
Ciclos fenológicos das árvores tropicais são moldados por fatores ambientais, contudo o papel dos gradientes de água no solo na fenologia foliar em florestas equatoriais permanece pouco compreendido. Avaliamos efeitos da profundidade do lençol freático - classificada em categorias de Altura Acima da Drenagem Mais Próxima (HAND): Baixo (7-20m), com lençóis freáticos rasos e maior acesso radicular à água; Intermediário (21-60m) e Alto (61-89m), correspondendo a lençóis freáticos profundos e acesso limitado à água - na produção e queda de folhas de 547 árvores do dossel, monitoradas mensalmente por 52 anos na Amazônia Central. Encontramos que ambientes mais secos (HAND Alto) tiveram menores frequências de brotação, um declínio de folhas maduras após 1990 e eventos de perda de dossel mais frequentes ao longo dos 50 anos. Locais de HAND Baixo mostraram maior substituição foliar e períodos de brotação mais curtos. Dentro do ano, a brotação de folhas atingiu o pico durante a estação seca em todos os ambientes, mas o tempo e a intensidade variaram: áreas de HAND Baixo exibiram padrões bimodais e picos mais precoces, enquanto áreas de HAND Alto mostraram picos tardios. Tanto espécies decíduas quanto perenes responderam à seca sazonal, com sincronia temporal mais forte em HAND Alto, onde as restrições climáticas são mais severas. Em locais mais úmidos, a menor sincronia sugere uma limitação sazonal reduzida. Concluímos que o gradiente hidrológico e o hábito foliar moldam conjuntamente a dinâmica fenológica, com ambientes mais secos sofrendo maior perda de dossel e restrições sazonais mais rígidas na renovação foliar.
Palavras-Chave:
água subterrânea; fenologia tropical; séries temporais; monitoramento de longo prazo, fenologia críptica
INTRODUCTION
Terra-firme forests in central Amazon are classified as evergreen (Reich et al. 2004; Wu et al. 2016), despite the fact that a wide diversity of phenological leaf turnover patterns exists among tree species, with deciduousness varying throughout the year. Most evergreen tropical forests that experience seasonality between dry and wet seasons tend to concentrate leaf shedding and new leaf flushing in the drier months (Lopes et al. 2016; Albert et al. 2018; Aleixo et al. 2023). This pattern is consistent with the hypothesis that trees optimize photosynthetic capacity by taking advantage of increased sunlight availability due to reduced cloud cover during the dry season. However, this pattern challenges the assumption that trees are limited by water availability in seasonal environments. Understanding the role of water in shaping leaf exchange patterns in Amazonian forests is important because it is directly tied to photosynthetic seasonality and gross photosynthetic productivity (Wu et al. 2016; Restrepo-Coupe et al. 2017; Albert et al. 2018). By examining the interaction between water availability and leaf phenology, we can gain insights into how local hydrological conditions influence forest functioning and resilience under current and future environmental changes.
Frequency, duration and timing of old leaf abscission and new leaf flushing define leaf phenology for trees. Massive leaf production or complete canopy defoliation events may occur at different moments and frequencies in the tree canopy over time (Aleixo et al. 2023). Some canopy tree species never completely lose all their leaves at the same time, retaining mature, old and new leaves during leaf turnover, while varying degrees of deciduousness can also be found. Tree species can be classified according to their leaf habit, encompassing evergreen and deciduous types, with particular conditions such as semideciduous and brevideciduous. Evergreen species maintain a consistent full canopy throughout the year, although the proportion of new, mature and old leaves fluctuates seasonally over time. Deciduous species completely shed their canopy leaves, remaining defoliated for some time during the dry season. Semideciduous species lose a substantial portion of their leaves but typically retain part of the canopy, resulting in a period of partial defoliation. In contrast, brevideciduous species experience a very short leafless period, often lasting only a few days to weeks, with rapid and nearly synchronous leaf flushing following abscission. Thus, leaf habit represents a continuum of strategies that balance water conservation and light acquisition under seasonal environmental constraints.
Seasonal leaf turnover during the dry season (Wu et al. 2016; Aleixo et al. 2023) can be regulated by the interaction of environmental and physiological factors such as light and water availability, tree species traits, and herbivory (Wright and van Schaik 1994, Coley et al. 1996, Sperry et al. 2002, Méndez-Alonzo et al. 2013, Brum et al. 2019, Gonçalves et al. 2020). This leaf turnover during the driest period may take advantage of increased light, avoid water stress, or herbivore damage. Producing new leaves during the early to mid-dry season may maximise the abundance of 3- to 5-month-old leaves during peak drought, when leaf stomatal control (Kitajima et al. 2002) and photosynthetic efficiency (Albert et al. 2018; Menezes et al. 2022) are maximised.
Leaf shedding during droughts (seasonal or severe) may protect trees against critical reduction in water potential due to high evaporative demand, safeguarding them against xylem cavitation (Wolfe et al. 2016; Restrepo-Coupe et al. 2023). Herbivore pressure in the Amazon is hard to measure over large spatial and temporal scales (Dyer et al. 2012), but theoretically, herbivore outbreaks occur during the rainy period (Coley et al. 1996), so producing new leaves during the dry period could be a strategy to avoid herbivory when leaves are young, unprotected and more palatable. In all of these factors, water availability may be a key, but poorly understood, factor in the dynamics of upper canopy leaf age composition in Amazonian ecosystems (Méndez-Alonzo et al. 2013; Wolfe et al. 2016; da Silva e Teodoro et al. 2022; Restrepo-Coupe et al. 2023).
Approximately 50% of the Amazon hydrographic basin is covered by forests that overlay a shallow water table, with depths of less than five meters (Costa et al. 2023). Within this basin there are contrasting hydrological environments, floristic composition, hydraulic architecture of trees (Cosme et al. 2017; Garcia et al. 2021), and root depth that are all known to vary with water table depth (Schietti et al. 2014; Costa et al. 2023). For instance, trees of the central Amazon dryer plateau tend to have deeper roots, a hydraulic system more resistant to drought, and lower hydraulic efficiency, whereas trees of wetter valleys tend to have shallow roots, greater efficiency and less hydraulic safety (i.e., less resistance to vessel embolism and cavitation (Cosme et al. 2017; Fan et al. 2017; Oliveira et al. 2019). However, little is known about how soil water gradients affect leaf phenology in equatorial forests with restricted seasonality. In dry tropical forests, where seasonality is more pronounced between dry and rainy seasons, differences in local-scale soil water availability can result in individuals of the same species varying from deciduous to evergreen (Borchert 1994; Singh and Kushwaha 2005).
Water is more easily accessible and constantly available to trees in areas with shallow water tables (locally known as ‘baixios’, i.e., valleys), allowing them to maintain leaves year-round. In contrast, with deeper water tables (locally known as ‘platôs’, i.e. plateaus) trees depend on rain and soil moisture, making them more vulnerable to droughts (Fan et al. 2019, Esteban et al. 2021). This suggests that in humid forests the frequency and timing of leaf shedding and flushing may vary depending on the depth of the water table in addition to soil moisture.
Furthermore, deciduous and evergreen trees, with their different evolutionary histories, may have distinct strategies for dealing with varying water availability. Deciduous trees generally have a higher photosynthetic rate per leaf, lower root development costs, and no leaf respiration during unfavourable seasons, but they are more susceptible to water stress (Givnish 2002; Brodribb et al. 2003; Choat et al. 2005; Fu et al. 2012). Conversely, evergreen trees have a longer photosynthetic period, are more resistant to water stress, have tougher leaves, and require less energy to maintain fewer leaves over their lifespan (Givnish 2002, but see Cianciaruso et al. 2013; Brodribb et al. 2003; Choat et al. 2005; Lopez et al. 2005; Fu et al. 2012). Studies in the Amazon rainforest find significant differences in the thresholds of hydraulic safety and efficiency among deciduous (more vulnerable), and evergreen (more resistant) trees (Oliveira et al. 2021).
To develop a comprehensive understanding of the role of the hydrological gradient in regulating tree phenological patterns in the central Amazon, we address the following questions: (1) Is leaf phenology (i.e., tendency along time, frequency, duration and timing of leaf loss and leaf flush) associated with the position of individuals along the hydrological gradient defined by water table depth? (2) Does the relationship between leaf phenology and water table depth differ according to leaf habit (i.e. deciduous vs. evergreen)?
We predict that (1) Where the water tables are deep (high HAND, plateau areas), deciduousness will be more common because trees exhibit higher frequency of leaf shedding and flushing as a mechanism to prevent water loss compared to areas with shallow water tables. (2) On plateaus (deep water table, high HAND), deciduous and evergreen trees are expected to show distinct phenological patterns due to their contrasting hydraulic strategies. Deciduous species, which are more hydraulically vulnerable, shed and flush leaves seasonally, whereas evergreen species, which are more hydraulically resilient, maintain their leaves longer despite limited access to groundwater. (3) In valleys, both leaf habits likely exhibit a similar pattern of leaf production, as the consistently greater water availability allow even deciduous species to retain mature leaves for longer periods. Additionally, the timing of leaf production is influenced by water availability. Trees on plateau typically synchronize leaf loss and production during the dry season, a pattern more pronounced in deciduous trees. In contrast, trees in valleys may also flush leaves during the drier months, but for a different physiological reason: during the rainy season, waterlogged or hypoxic soils can restrict oxygen availability, limiting the metabolic processes necessary for new leaf production (Zahra et al. 2021).
MATERIAL AND METHODS
Study site
This study was conducted in the central Amazon, near Manaus, Brazil, in two reserves of terra firme tropical rainforest of the National Institute of Amazon Research (INPA), Reserva Florestal Ducke (RD) and the Estação Experimental de Silvicultura Tropical (EEST, Appendix, Figure A1). Both have the typical undulating topography of the region. Different types of environments are determined by the topographic position and soil physical and chemical composition, though all soils are highly leached and low in phosphorus and soluble cations (Quesada et al. 2010). The tree communities here were selected over plateaus and in valleys. Plateaus have clayey soils with greater water retention but lower water tables. As relative elevation decreases, soils become sandier and more hydromorphic in valleys, with the water table closer to the surface year-round, and which become waterlogged during the rainy season (Chauvel et al. 1987).
The regional climate is classified as tropical monsoon type ‘Am’ according to the Köppen-Geiger classification (Peel et al. 2007). The climate is warm and humid throughout the year, with an annual average relative humidity ranging from 83% to 90% (Peel et al. 2007). The driest period, from July to September, marks the seasonality in the region, with precipitation potentially falling below 100 mm, which is the monthly evaporative demand of Amazon forest. Annual rainfall at the Ducke Forest Reserve over the past 52 years averaged 2,523 mm (Aleixo et al. 2019). The six drier months, from June to November, had a monthly rainfall of 136 ± 64 mm (mean ± SD) and temperature of 26.3 ± 1.3ºC. The six wetter months, from December to May, had mean monthly rainfall of 288 ± 99 mm and average temperature of 24.9 ± 1.1ºC (LBA, https://lba.inpa.gov.br, 2024).
All the study forest is low altitude humid tropical forest, with a high, dense, canopy and low-light understory. Local flora is diverse with approximately 1000 tree species and with the canopy varying 25 - 50 m high (Ribeiro et al. 1999; Hopkins 2005). The dominant tree families are Fabaceae, Burseraceae, Sapotaceae, Lecythidaceae, Chrysobalanaceae, Moraceae and Lauraceae (Ribeiro et al. 1999; Hopkins 2005).
HAND dataset
To determine the influence of the water table on phenology, we used the geolocation of each tree to extract HAND values for all selected trees. HAND is an algorithm that calculates the height above the nearest drainage and serves as a proxy for measuring the vertical distance to the groundwater surface (the water table) in the central Amazon (Rennó et al. 2008). The HAND map was created based on SRTM (Shuttle Radar Topographic Mission) 30m resolution data using 50 pixels as the minimum catchment area to define the starting point of permanent streams (Banon 2013). The HAND algorithm is a static proxy with respect to time and is therefore subject to changes in the landscape, such as erosion or sedimentation. However, the study sites are well-preserved areas in which, to the best of our knowledge, no major erosion processes and major landscape changes were recorded during the period of this study.
HAND was divided into three categories to better visualize three different portions of the water table level gradient: Low HAND, lower than 20 m; Intermediate HAND, between 21 m and 60 m; High HAND, above 61 m (lower and upper values for the focal trees were 7 m and 89 m). The HAND limit of 20 m is close to the threshold for a major vegetation composition change in the studied area (Schietti et al. 2014), and 61 m is the average value for the dataset.
Phenological dataset and metrics
The individuals analysed in the present study were selected from a 52-year phenological monitoring of tree species in RD and EEST (Alencar et al. 1979; Pinto et al. 2005, 2008; Barbosa et al. 2018; Aleixo, 2019). Species were selected based on their representativeness in the local flora and their silvicultural and economic interest (Alencar et al. 1979). The study criteria for the inclusion of trees in the monitoring were only healthy canopy trees with a height of 13-40 m, reproductively mature, with well-developed stems and crowns. A standard minimum basal diameter was used for each species (22-165 cm), depending on the species average for the region.
Each tree was assigned a numerical identification code and was monitored monthly until its death or, if still alive, until 2016, when the survey ended. Six trained field technicians monitored the canopy of each individual tree from the forest floor using binoculars ensuring good visibility from multiple viewing angles. Leaf phenology was assessed monthly, and each tree was classified into one of five phenophases: (1) the presence of new leaves (flushing), (2) the co-occurrence of mature/old and new leaves (3) predominance of mature/old leaves (4) partial defoliation (few leaves remaining, including new or mature/old leaves) and (5) complete no leaves. Leaf age classes were determined based on size and colour features typical of each monitored species (Appendix, Figure A2). Leaf phenophases are sub-annual states or conditions of each tree, in contrast with ‘leaf habit’, which is a long-term classification of each tree based on its deciduousness over time (e.g. evergreen and deciduous). Low HAND included 3 deciduous, 8 evergreen trees; intermediate HAND 129 deciduous, 143 evergreen; high HAND 123 deciduous, 141 evergreen trees.
To test the hypotheses, we used 547 georeferenced individuals (76 species, some of which were morphospecies with four or more individuals and 22 angiosperm families) monitored for a minimum of 14 and a maximum of 52 years (with an average of 43 years). These species are locally abundant, and some are considered hyperdominant in the Amazon basin (Ter Steege et al. 2013).
Local leaf habit classification
As used here, ‘leaf habit’ is a long-term classification of each tree by its leaf exchange strategy. It is based on criteria of consistency, completeness and duration of deciduousness during the entire multi-annual period of observation of a species. Our individual-based approach for leaf habit classification is totally based on local field observation and allowed us to assess intraspecific variation in contrasting environments. We call evergreens the trees that never exhibited few leaves (partially defoliated canopy) or ‘no leaves’ events during the monitoring period, as well as trees that showed some degree of deciduous behaviour but experienced no more than seven ‘no leaves’ events over the entire time series, a threshold derived from the observed distribution of leafless events across the local tree community and below the community-wide average of eight years. Sporadic events extrinsic to phenology such as insect attacks may occur. Any other tree with any degree of deciduousness was classified as deciduous, including brevideciduous and semideciduous trees.
Data analysis
Based on the time series of leaf phenology, we calculated the monthly proportion of trees in each phenophase across the monitoring period to assess long term patterns related to hydrological gradient. To investigate interannual variation, each phenophase time series was smoothed using a 12-month moving average, which reduces seasonality and highlights long-term dynamics. To explore intra-annual (seasonal) patterns, we calculated the average monthly frequency of trees in each phenophase. Linear models were applied for regression analysis (Bates et al. 2015). Missing observations were removed from the time series prior to the calculation of relative phenophase frequencies. In total, 2 trees died during the monitoring period in Low HAND environments, 41 in Intermediate, and 88 in High HAND environments. The 2 deaths in the Low HAND group were recorded in 1999 and 2015. They represent 18% of the data available for the group and began to occur later in the time series, therefore having a smaller effect on the observed patterns. Despite the greater proportion of deaths in the other two groups, the remaining living trees constitute the majority of the data available for a good characterization of phenological patterns.
To evaluate how trees with different leaf habits (evergreen or deciduous) respond along the hydrological gradient, we examined the long-term trends of each phenophase within the three hydrological classes defined by HAND levels. Due to (1) the small number of deciduous trees in low HAND areas (three deciduous, eight evergreens), and (2) the greater temporal resolution and availability of leaf flushing data across both leaf habits, we focused subsequent analyses on the leaf flushing phenophase to evaluate how leaf habit influences phenological patterns across hydrological conditions.
To test whether the relationship between leaf phenology and the hydrological gradient differs according to leaf habit, we assessed the flushing frequency time series between deciduous and evergreen trees within each hydrological environment. We applied a Granger-causality cross-test to detect temporal relationships between lags of the flushing time series of the two leaf habits. This test compares an unrestricted model, in which the dependent variable is explained by the specified lag times of that variable and the independent variable (predictor), with a restricted model, in which the dependent variable is only explained by the lags of itself. The Granger-causality test therefore indicates temporal precedence rather than a causal influence (Zeileis and Hothorn 2002; Granger and Newbold 2014; Grassmann 2020). Prior to conducting the Granger causality tests, we verified stationarity and linearity of the flushing time series using the Augmented Dickey-Fuller (ADF) test and visual inspection, respectively. According to the ADF results, all time series were stationary (p-value < 0.05; Table A1). Visual inspection indicated that the relationships between evergreen and deciduous flushing time series were approximately linear within each HAND category (Appendix, Figure A3). All analyses and data processing were conducted in the R environment (R Core Team 2021).
RESULTS
Effects of local hydrology on leaf phenology patterns
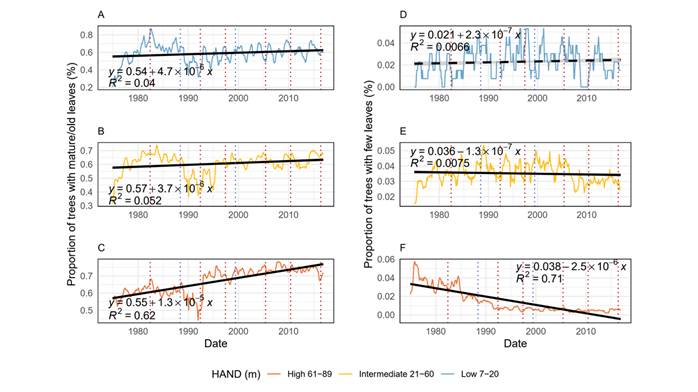
Leaf phenology showed clear and persistent differences along the hydrological gradient defined by the water table depth (HAND) (Tables 1-2; Appendix, Figure A4). The proportion of trees flushing new leaves increased slightly over time across all environments but was consistently higher in wetter, low-HAND areas (Figures 1a-c). In contrast, trees in drier, high-HAND environments displayed lower frequencies of new leaves and a marked decline of mature/old leaves after 1990 (Figures 1f, 2f). The frequency of partially defoliated canopies (‘few leaves’) and no leaves also increased with HAND, suggesting that drier environments are associated with more frequent and prolonged canopy loss events (Figures 2d-f, 3a-c). Together, these patterns indicate that local hydrology is associated with differences in leaf persistence and canopy renewal, promoting higher leaf turnover and shorter canopy duration in areas with deeper water tables.
Linear regression model statistics for the relationships between long-term temporal trends of each phenophase (N of individuals observed in a given phenophase per month) at each hydrological environment and time, as linear predictor. All leaf habits together. b: beta coefficients; b coefficients given in scientific notation (e.g., 1E-3 = 0.001).
Analysis of variance (ANOVA) and post-hoc Tukey multiple comparison of means between phenophases (N of individuals observed in a given phenophase per month) long-term variations between HAND groups.

Time series of monthly proportion of tree individuals with new leaves (a-c) and mature/old and new leaves (d-f) in three sections of the studied hydro-edaphic gradient in the central Amazon. Raw data was smoothed using moving average at lag -12 for the phenophase in the y axis. Dotted lines indicate years with extreme climatic conditions, dry in red (El Niño 1982, 1992, 1997, 2016/ NAO 2005, 2010), wet in blue (La Niña 1988, 1999). Solid black lines indicate significant regressions (p < 0.05), dashed lines indicate non-significant regressions.

Time series of monthly proportion of tree individuals with mature/old leaves (a-c) and few leaves (d-f) in three sections of the studied hydro-edaphic gradient in the central Amazon. Raw data was smoothed using moving average at lag -12 for the phenophase in the y axis. All leaf habits pooled together. Dotted lines indicate years with extreme climatic conditions, dry in red (El Niño 1982, 1992, 1997, 2016/ NAO 2005, 2010), wet in blue (La Niña 1988, 1999). Solid black lines indicate significant regressions (p < 0.05), dashed lines indicate non-significant regressions.

Time series of monthly proportion of tree individuals without leaves in three sections of the studied hydro-edaphic gradient in the central Amazon. Raw data was smoothed using moving average at lag -12 for the phenophase in the y axis. All leaf habits pooled together. Dotted lines indicate years with extreme climatic conditions, dry in red (El Niño 1982, 1992, 1997, 2016/ NAO 2005, 2010), wet in blue (La Niña 1988, 1999). Solid black lines indicate significant regressions (p < 0.05).
Intra-annual cycles varied in the mean values of the phenophases by hydrological habitat (Figure 4), although these differences were not statistically significant (Table 3). The stages of no leaves and few leaves together represented a small portion of the cycle, encompassing on average 4.5% of the monitoring period (Appendix, Figure A5). The leafless period peaked during the drier months across all environments: August in high HAND areas and September in intermediate areas. However, low HAND areas exhibited a bimodal pattern with peaks of similar intensity in May and September (Figure 4e). Similarly, the few leaves phenophase peaked in August for intermediate and high HAND areas, but occurred in the wet month of June for low HAND areas (Figure 4d). As trees began to recover their crowns, new leaf production followed an inverse trend to mature leaves, with minima at the end of the wet season and maxima during the dry season. This peak occurred in September for trees in shallow, low HAND areas, and in October for those in intermediate and high HAND environments (Figure 4a). The transition class of mature/old and new leaves showed the most striking contrast between habitats. While it remained almost constant throughout the year in high HAND areas, it was slightly seasonal in intermediate areas and markedly seasonal in low HAND areas, where peaks occurred in June at the end of the wetter period (Figure 4b). Finally, the presence of mature/old leaves remained consistent throughout the year, peaking near the end of the wet season in April and reaching minima in the dry season in September (Figure 4c).
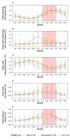
Average proportion of tree individuals in each phenophase during the year in contrasting hydrological environments. Vertical bars represent standard deviation for each month, red shaded area indicates the local drier season.
Linear mixed-effects models of intra-annual variation in phenophases across hydrological environments. Separate models were fitted for each phenophase (N of individuals observed in a given phenophase per month), including the interaction between month and HAND category (Height Above Nearest Drainage), monthly variability (standard deviation), random intercepts by HAND category, and temporal autocorrelation between months (AR(1) structure). Pairwise comparisons between HAND categories (low, intermediate, high) are shown below each model, with estimates, standard errors, t statistics, and p-values representing the expected differences in phenophase abundance across HAND groups at a given month (e.g. Flushing at low HAND at month i in relation to flushing at high HAND at month i).
The role of leaf habit on leaf flushing patterns in contrasting hydrological environments
Deciduous and evergreen trees exhibited broadly synchronous intra-annual patterns of leaf flushing across the hydrological gradient, with flushing peaking during the drier months (Figure 5). This indicates that both leaf habits respond to similar seasonal cues, regardless of water table depth. However, the degree of coupling between deciduous and evergreen flushing dynamics varied along the gradient. In lower HAND environments, where soil moisture remains high year-round, the temporal synchrony between deciduous and evergreen flushing was weaker, suggesting that trees in wetter sites experience weaker seasonal constraint on leaf production. In contrast, at intermediate and high HAND levels (Table 4), where trees are more exposed to seasonal water limitation, deciduous and evergreen trees tended to be more synchronous, suggesting stronger climatic constraints on the timing of leaf production. These results suggest that the relationship between phenological behavior and hydrological position depends on leaf habit only in terms of the degree of synchronization, not in the timing or frequency of flushing events themselves.

Interannual time series data of new leaves flushing on trees with contrasting leaf habits in three hydrological environments in the central Amazon. Raw data was smoothed using moving average at lag -12 for the phenophase in the y axis. Dotted lines indicate years with extreme climatic conditions, dry in red (El Niño 1982, 1992, 1997, 2016/ NAO 2005, 2010), wet in blue (La Niña 1988, 1999).
Leaf flushing across HAND and leaf habit revealed that both deciduous and evergreen species respond to seasonal drought. However, the timing and intensity of flushing varied depending on the hydrological environment (Appendix, Figure A6). In shallow HAND areas, evergreen species tended to flush leaves earlier than deciduous ones, whereas in deeper HAND areas, deciduous species exhibited a more intense leaf flushing than evergreen trees, despite no statistical significance. Overall, leaf flushing was synchronized with the dry season, but its intensity and timing were shaped by both the hydrological gradient (HAND) and leaf habit.
DISCUSSION
We demonstrate that there is a complex relationship between local hydrology and leaf habit in shaping long-term leaf phenology patterns in an Amazonian terra firme forest, highlighting the diverse strategies employed by trees to cope with water availability characteristics of this environment. The most pronounced long-term changes in leaf phenological patterns occurred in the trees growing in areas with deeper water table, whereas limited water access likely promotes greater variability in leaf production and loss over time. In contrast, trees in areas with shallow water table tended to maintain more stable phenological patterns, showing lower rates of change and more consistent timing of leaf flushing and shedding. We also note cryptic patterns of leaf turnover, characterized by the simultaneous presence of mature, old and new leaves within the same canopy (Albert et al. 2019), suggesting a continuous renewal strategy that may buffer trees against short-term environmental fluctuations.
Hydrological Gradient and Leaf Phenology
Our results support the hypothesis that leaf phenology patterns are associated with the position of trees along the local hydrological gradient. We identified contrasting long-term trends and intra-annual cycles of phenophases related to leaf maintenance and abscission across hydrological environments. This finding reinforces previous evidence that water availability is a key driver of leaf phenology in tropical forests (Borchert 1994; Singh and Kushwaha 2005; Méndez-Alonzo et al. 2013). Specifically, we observed that the frequency of individuals undergoing complete leaf shedding (‘no leaves’ phenophase) over the years diverged drastically between HAND classes, increased in areas with deeper water tables (high HAND), while it declined in shallower sites (low HAND). This pattern likely reflects the distinct water stress experienced by trees with limited access to groundwater (Fan et al. 2017). Conversely, the frequency of new leaves production exhibited relatively consistent trends along the gradient, suggesting that other factors, such as photoperiod or temperature, may exert stronger control over this phenophase.
The most pronounced long-term changes occurred in trees growing in deeper HAND, which showed a marked decline in the frequency of ‘mature/old and new leaves’ and ‘few leaves’ phenophases after 1990. This shift may reflect (1) increasing physiological stress associated with climatic change; (2) shifts in local hydrological conditions; or (3) adaptive strategies favoring longer leaf lifespan to enhance nutrient conservation under resource-limited conditions, or a combination of these factors. Instead of replacing their leaves, trees in deep water table environments retained mature/old leaves longer in more recent decades, consistent with a slowdown in canopy leaf turnover in these relatively drier areas. The selective pressure imposed by seasonal water limitation in environments of deep-water tables may favour individuals with more durable leaves that are relatively conservative in terms of their leaf economy (Cosme et al. 2017). The coordination between conservative leaf traits and a comparatively safer hydraulic system in plateaus than in valley trees (Oliveira et al. 2019) may contribute to the prolonged maintenance of mature/old leaves in the canopies of trees in these relatively drier soil areas. This pattern reinforces the idea that groundwater dependence may play a role in leaf production (Elliott et al. 2006; Vico et al. 2017).
Although overall seasonal trends were similar between hydrological environments, the timing and intensity of phenophase peaks varied across the groundwater. Despite the weak statistical evidence, the most distinct phenophase was the co-occurrence of mature/old and new leaves, particularly in evergreen trees. In wetter soil environments, evergreen species tended to synchronize leaf production with the end of the rainy season, possibly as a strategy to exploit the temporary increase in nutrient availability and light, while avoiding hypoxic conditions in the rooting zone during the peak of soil saturation. This timing may enhance nutrient uptake efficiency and optimize photosynthetic gains before the onset of the dry season. A notable limitation of this study is the relatively small sample size in the low HAND group (n = 11), which reduces the statistical power of comparisons, increasing the possibility of failing to detect differences when they do exist. Although a Tukey-Kramer adjustment was applied to account for unequal sample sizes, interpretations of group comparisons should be made cautiously. Low coefficient values and low R² values should also be interpreted carefully.
Additionally, it is important to recognize that the HAND index represents a static proxy of average soil water availability. It does not capture short-term fluctuations in water table depth, which are likely to play an important role in phenological responses Given the current and predicted climate changes for the central Amazon, with more severe droughts and more rainfall during the wet season (Gloor et al., 2013; Marengo et al. 2024), studies that address water table fluctuation dynamics of the water table would be valuable for understanding leaf exchange patterns. Another limitation is relative to the resolution of the HAND data. Despite its good vertical resolution, in forested regions such as our study sites, vegetation cover tends to smooth the actual relief. Despite these limitations, our results clearly indicate that local hydrology is a key determinant of both the temporal stability and interannual variability of leaf phenology in Amazonian canopy trees.
It is important to note that several of the observed relationships presented relatively low coefficients of determination (R²), indicating limited explanatory power of the linear models. Therefore, these results should be interpreted cautiously, as phenological dynamics are likely influenced by additional unmeasured environmental and biological factors.
Leaf Habit and Phenology
Contrary to our expectations, long-term variations in leaf phenological patterns were more influenced by leaf habits in intermediate and high HAND environments (p < 0.05 in Granger-causality test), where significant temporal relationships were detected in the Granger-causality tests, whereas no significant coupling was observed in low HAND conditions. Although deciduous and evergreen trees exhibited similar overall long-term trends in new leaf production, the degree of synchrony between their phenological time series varied across the hydrological gradient and at different temporal scales. In low HAND environments, deciduous and evergreen trees displayed weaker temporal coupling of leaf flushing across years, suggesting stronger niche differentiation and distinct strategies of leaf production where water is not a limiting factor in the long-term. The convergence in leaf production patterns observed in higher HAND areas (e.g. slopes and plateaus) may indicate a stronger environmental filter in these habitats, that overrides intrinsic differences between leaf habits due to stronger seasonal variation in soil water availability linked to rainfall seasonality (Fu et al. 2012; Méndez-Alonzo et al. 2013). Although these patterns are supported by Granger-causality tests, the relatively low explanatory power of the models suggests that additional drivers may contribute to this synchrony. Taken together, these results indicate that leaf flushing phenology emerges from the interplay between leaf habit and hydrological constraints, with water table depth and climate variability jointly shaping the timing and intensity of leaf canopy exchange. Understanding these mechanisms is essential for predicting how Amazonian tree communities will adjust their phenological cycles under future scenarios of altered rainfall regimes and increasing drought frequency. It is noteworthy that our interpretations of the Granger-causality test are written in terms of linear temporal correlation rather than strict causality because of the limitation of the linear model to capture potential non-linear dynamics in this case.
CONCLUSIONS
This study demonstrates that Amazonian terra firme forests maintain high phenological diversity within a broad evergreen strategy, structured by soil hydrological heterogeneity. Groundwater availability emerges as an important determinant of canopy dynamics, particularly where water limitation imposes strong environmental filtering. These findings underscore the need of incorporating local hydrology and species-specific traits into climate change models to accurately predict forest resilience. To improve projections of carbon cycling and ecosystem productivity, future research must integrate dynamic water availability measurements with multi-scale monitoring and physiological trait data, resolving the complex mechanisms underlying tropical leaf exchange strategies.
ACKNOWLEDGEMENTS
The authors thank the researchers V. Campbell de Araújo and J. da Cruz Alencar for selecting the trees during the implementation of the phenological research monitoring for maintaining the monitoring over the last years. Numerous grants have financed more than 50 years of research. We are grateful to the Coordenação de Tecnologia e Inovação (COTEI) and Grupo de Pesquisas de Espécies Amazônicas at the Instituto Nacional de Pesquisas da Amazônia for providing data, and to the field technicians J. Maciel, M. Azevedo, L. Reis, E. Nascimento and T. Nascimento for conducting field work. We thank the Coordenação de Aperfeiçoamento de Pessoal de Nível Superior (CAPES, finance code 001) for financial support. Authors thank The Other Side of the Drought Project (CNPq Process 406149/2021-6) team for insightful discussions on the importance of local hydrology for forest functioning.
REFERENCES
- Albert, L.P.; Wu, J.; Prohaska, N.; de Camargo, P.B.; Huxman, T.E.; Tribuzy, E.S.; et al. 2018. Age-dependent leaf physiology and consequences for crown-scale carbon uptake during the dry season in an Amazon evergreen forest. New Phytologist 219: 870-884.
- Albert, L.P.; Restrepo-Coupe, N.; Smith, M.N.; Wu, J.; Chavana-Bryant, C.; Prohaska, N.; et al. 2019. Cryptic phenology in plants: Case studies, implications, and recommendations. Global Change Biology 25: 3591-3608.
-
Aleixo, I.F. 2019. Padrões fenológicos e mortalidade de árvores de terra firme na Amazônia Central. Doctoral thesis. Instituto Nacional de Pesquisas da Amazônia -INPA), Brazil, 201p. (https://repositorio.inpa.gov.br/handle/1/12295)
» https://repositorio.inpa.gov.br/handle/1/12295 - Aleixo, I.F.; Maciel, J.M.; Reis, L.Q.; Nascimento, T.; Calvi, G.P.; Norris, D.; Barbosa, A.P. 2023. Fenologia: Árvores da Amazônia. Editora INPA, Manaus, Amazonas. 53 p.
- Alencar, J. da C.; Almeida, R.A.; Fernandes, N.P. 1979. Fenologia de espécies florestais em floresta tropical úmida de terra firme na Amazônia Central. Acta Amazonica 9: 163-198.
-
Banon, L.C. 2013. Árvores de decisão aplicadas à extração automática de redes de drenagem INPE, São José dos Campos, 115p. Available at: http://urlib.net/8JMKD3MGP7W/3FB9RFE
» http://urlib.net/8JMKD3MGP7W/3FB9RFE - Barbosa, A.; Moçambite, A.; Morellato, P.; Blair e Matos, C. 2018. Reproductive phenology of Carapa guianensis Aubl. (Meliaceae) in two forest areas of the Central Amazon. International Journal of Environment, Agriculture and Biotechnology 3: 714-724.
- Bates, D.; Mächler, M.; Bolker, B.M.; Walker, S.C. 2015. Fitting linear mixed-effects models using lme4. Journal of Statistical Software 67: 1-48.
- Borchert, R. 1994. Soil and Stem Water Storage Determine Phenology and Distribution of Tropical Dry Forest Trees. Ecology 75: 1437-1449.
- Brodribb, T.J.; Holbrook, N.M.; Edwards, E.J.; Gutiérrez, M.V. 2003. Relations between stomatal closure, leaf turgor and xylem vulnerability in eight tropical dry forest trees. Plant, Cell and Environment 26: 443-450.
- Brum, M.; Vadeboncoeur, M.A.; Ivanov, V.; Asbjornsen, H.; Saleska, S.; Alves, L.F.; et al. 2019. Hydrological niche segregation defines forest structure and drought tolerance strategies in a seasonal Amazon forest. Journal of Ecology 107: 318-333.
- Chauvel, A.; Lucas, Y.; Boulet, R. 1987. On the genesis of the soil mantle of the region of Manaus, Central Amazonia, Brazil. Experientia 43: 234-241.
- Choat, B.; Ball, M.C.; Luly, J.G.; Holtum, J.A.M. 2005. Hydraulic architecture of deciduous and evergreen dry rainforest tree species from north-eastern Australia. Trees 19: 305-311.
- Cianciaruso, M. V.; Silva, I.A.; Manica, L.T.; Souza, J.P. 2013. Leaf habit does not predict leaf functional traits in cerrado woody species. Basic and Applied Ecology 14: 404-412.
- Coley, P.D.; Barone, J.A.; Barone, C.&. 1996. Herbivory and plant defenses in tropical forests. Annual Review of Ecology and Systematics 27: 305-340.
- Cosme, L.H.M.; Schietti, J.; Costa, F.R.C.; Oliveira, R.S. 2017. The importance of hydraulic architecture to the distribution patterns of trees in a central Amazonian forest. New Phytologist 215: 113-125.
- Costa, F.R.C.; Schietti, J.; Stark, S.C.; Smith, M.N. 2023. The other side of tropical forest drought: do shallow water table regions of Amazonia act as large-scale hydrological refugia from drought? New Phytologist 237: 714-733.
- Dyer, L.A.; Carson, W.P.; Leigh Jr, E.G. 2012. Insect Outbreaks in Tropical Forests: Patterns, Mechanisms, and Consequences. In: Barbosa, P.; Letourneau, D.K.; Agrawal, A.A. (Eds.), Insect Outbreaks Revisited, 1st ed. Blackwell Publishing Ltd., 465p. Pp. 219 - 245.
- Elliott, S.; Baker, P.J.; Borchert, R. 2006. Leaf flushing during the dry season: the paradox of Asian monsoon forests. Global Ecology and Biogeography 15: 248-257.
- Esteban, E.J.L.; Castilho, C. V.; Melgaço, K.L.; Costa, F.R.C. 2021. The other side of droughts: wet extremes and topography as buffers of negative drought effects in an Amazonian forest. New Phytologist 229: 1995-2006.
- Fan, Y.; Miguez-Macho, G.; Jobbágy, E.G.; Jackson, R.B.; Otero-Casal, C. 2017. Hydrologic regulation of plant rooting depth. Proceedings of the National Academy of Sciences 114: 10572-10577.
- Fan, Y.; Clark, M.; Lawrence, D.M.; Swenson, S.; Band, L.E.; Brantley, S.L.; et al. 2019. Hillslope Hydrology in Global Change Research and Earth System Modeling. Water Resources Research 55: 1737-1772.
- Fu, P.L.; Jiang, Y.J.; Wang, A.Y.; Brodribb, T.J.; Zhang, J.L.; Zhu, S.D.; et al. 2012. Stem hydraulic traits and leaf water-stress tolerance are co-ordinated with the leaf phenology of angiosperm trees in an Asian tropical dry karst forest. Annals of Botany 110: 189-199.
- Garcia, M.N.; Ferreira, M.J.; Ivanov, V.; dos Santos, V.A.H.F.; Ceron, J.V.; Guedes, A.V.; et al. 2021. Importance of hydraulic strategy trade-offs in structuring response of canopy trees to extreme drought in central Amazon. Oecologia 197: 13-24.
- Givnish, T.J. 2002. Adaptive Significance of Evergreen vs. Deciduous Leaves: Solving the Triple Paradox. Silva Fennica 36: 703-743.
- Gloor, M. R. J. W.; Brienen, R. J.; Galbraith, D.; Feldpausch, T. R.; Schöngart, J.; Guyot, J. L.; Phillips, O. L. 2013. Intensification of the Amazon hydrological cycle over the last two decades. Geophysical Research Letters 40(9): 1729-1733.
- Gonçalves, N.B.; Lopes, A.P.; Dalagnol, R.; Wu, J.; Pinho, D.M.; Nelson, B.W. 2020. Both near-surface and satellite remote sensing confirm drought legacy effect on tropical forest leaf phenology after 2015/2016 ENSO drought. Remote Sensing of Environment 237: 111489.
- Granger, C.W.J.; Newbold, P. 2014. Forecasting economic time series. Academic Press, San Diego, 338p.
- Grassmann, G. 2020. New considerations on the validity of the Wiener-Granger causality test. Heliyon 6: e05208.
- Hopkins, M.J.G. 2005. Flora da Reserva Ducke, Amazonas, Brasil. Rodriguésia 56: 9-25.
- Kitajima, K.; Mulkey, S.S.; Samaniego, M.; Wright, S.J. 2002. Decline of photosynthetic capacity with leaf age and position in two tropical pioneer tree species. American Journal of Botany 89: 1925-1932.
- Lopes, A.P.; Nelson, B.W.; Wu, J.; Graça, P.M.L. de A.; Tavares, J.V.; Prohaska, N.; et al. 2016. Leaf flush drives dry season green-up of the Central Amazon. Remote Sensing of Environment 182: 90-98.
- Lopez, O.R.; Kursar, T.A.; Cochard, Hervé.; Tyree, M.T. 2005. Interspecific variation in xylem vulnerability to cavitation among tropical tree and shrub species. Tree Physiology 25: 1553-1562.
- Marengo, J.A.; Espinoza, J.C.; Fu, R.; Jimenez Muñoz, J.C.; Alves, L.M.; da Rocha, H.R.; et al. 2024. Long-term variability, extremes and changes in temperature and hydrometeorology in the Amazon region: A review. Acta Amazonica, 54(spe1), e54es22098.
- Méndez-Alonzo, R.; Pineda-García, F.; Paz, H.; Rosell, J.A.; Olson, M.E. 2013. Leaf phenology is associated with soil water availability and xylem traits in a tropical dry forest. Trees 27: 745-754.
- Menezes, J.; Garcia, S.; Grandis, A.; Nascimento, H.; Domingues, T.F.; Guedes, A. V.; et al. 2022. Changes in leaf functional traits with leaf age: When do leaves decrease their photosynthetic capacity in Amazonian trees? Tree Physiology 42: 922-938.
- Oliveira, R.S.; Costa, F.R.C.; van Baalen, E.; de Jonge, A.; Bittencourt, P.R.; Almanza, Y.; et al. 2019. Embolism resistance drives the distribution of Amazonian rainforest tree species along hydro-topographic gradients. New Phytologist 221: 1457-1465.
- Oliveira, R.S.; Eller, C.B.; Barros, F. de V.; Hirota, M.; Brum, M.; Bittencourt, P. 2021. Linking plant hydraulics and the fast-slow continuum to understand resilience to drought in tropical ecosystems. New Phytologist 230: 904-923.
- Peel, M.C.; Finlayson, B.L.; McMahon, T.A. 2007. Updated world map of the Köppen-Geiger climate classification. Hydrology and Earth System Sciences 11: 1633-1644.
- Pinto, A.M.; Morellato, L.P.C.; Barbosa, A.P. 2008. Fenologia reprodutiva de Dipteryx odorata (Aubl.) Willd (Fabaceae) em duas áreas de floresta na Amazônia Central. Acta Amazonica 38: 643-650.
- Pinto, A.M.; Ribeiro, R.J.; Alencar, J. da C.; Barbosa, A.P. 2005. Fenologia de Simarouba amara Aubl. na reserva florestal Adolpho Ducke, Manaus, AM. Acta Amazonica 35: 347-352.
- Quesada, C.A.; Lloyd, J.; Schwarz, M.; Patiño, S.; Baker, T.R.; Czimczik, C., et al. 2010. Variations in chemical and physical properties of Amazon forest soils in relation to their genesis. Biogeosciences 7: 1515-1541.
- R Core Team. 2022. R: A language and environment for statistical computing. R version 4.4.0. R Foundation for Statistical Computing, Vienna, Austria.
- Reich, P.B.; Uhl, C.; Walters, M.B.; Prugh, L.; Ellsworth, D.S. 2004. Leaf demography and phenology in amazonian rain forest: a census of 40000 leaves of 23 tree species. Ecological Monographs 74: 3-23.
- Rennó, C.D.; Nobre, A.D.; Cuartas, L.A.; Soares, J.V.; Hodnett, M.G.; Tomasella, J.; et al. 2008. HAND, a new terrain descriptor using SRTM-DEM: Mapping terra firme rainforest environments in Amazonia. Remote Sensing of Environment 112: 3469-3481.
- Restrepo-Coupe, N.; Levine, N.M.; Christoffersen, B.O.; Albert, L.P.; Wu, J.; Costa, M.H.; et al. 2017. Do dynamic global vegetation models capture the seasonality of carbon fluxes in the Amazon basin? A data-model intercomparison. Global Change Biology 23: 191-208.
- Restrepo-Coupe, N.; O’Donnell C.B.; Longo, M.; Alves, L.F.; Campos, K.S.; da Araujo, A.C.; et al. 2023. Asymmetric response of Amazon forest water and energy fluxes to wet and dry hydrological extremes reveals onset of a local drought-induced tipping point. Global Change Biology 29: 6077-6092.
- Ribeiro, J.E.L.S.; Hopkins, M.G.J.; Vicentini, A.; Sothers, C.A.; Costa, M.A.S.; Brito, J.M.; et al. 1999. Flora da Reserva Ducke: Guia de Identificação das Plantas Vasculares de uma Floresta de Terra Firme na Amazônica Central INPA, Manaus, Brasil, 238p.
- Schietti, J.; Emilio, T.; Rennó, C.D.; Drucker, D.P.; Costa, F.R.C.; Nogueira, A.; et al. 2014. Vertical distance from drainage drives floristic composition changes in an Amazonian rainforest. Plant Ecology and Diversity 7: 241-253.
- Silva E Teodoro, É.D.M.; Silva, A.P.A.; Brito, N.D.; Rodal, M.J.N.; Shinozaki-Mendes, R.A.; Lima, A.L.A. 2022. Functional traits determine the vegetative phenology of woody species in riparian forest in semi-arid Brazil. Plant Ecology 223: 1137-1153.
- Singh, K.P.; Kushwaha, C.P. 2005. Paradox of leaf phenology: Shorea robusta is a semi-evergreen species in tropical dry deciduous forests in India. Current Science 88: 1820-1824.
- Sperry, J.S.; Hacke, U.G.; Oren, R.; Comstock, J.P. 2002. Water deficits and hydraulic limits to leaf water supply. Plant, Cell and Environment 25: 251-263.
- Ter Steege, H.; Pitman, N.C.A.; Sabatier, D.; Baraloto, C.; Salomão, R.P.; Guevara, J.E.; et al. 2013. Hyperdominance in the Amazonian tree flora. Science 342: 1243092.
- Vico, G.; Dralle, D.; Feng, X.; Thompson, S.; Manzoni, S. 2017. How competitive is drought deciduousness in tropical forests? A combined eco-hydrological and eco-evolutionary approach. Environmental Research Letters 12: 065006.
- Wolfe, B.T.; Sperry, J.S.; Kursar, T.A. 2016. Does leaf shedding protect stems from cavitation during seasonal droughts? A test of the hydraulic fuse hypothesis. New Phytologist 212: 1007-1018.
- Wright, S.J.; Van Schaikt, C.P. 1994. Light and the phenology of tropical trees. The American Naturalist 143: 192-199.
- Wu, J.; Albert, L.P.; Lopes, A.P.; Restrepo-Coupe, N.; Hayek, M.; Wiedemann, K.T.; et al. 2016. Leaf development and demography explain photosynthetic seasonality in Amazon evergreen forests. Science 351: 972-976.
- Zahra, N.; Hafeez, M.B.; Shaukat, K.; Wahid, A.; Hussain, S.; Naseer, R.; et al. 2021. Hypoxia and Anoxia Stress: Plant responses and tolerance mechanisms. Journal of Agronomy and Crop Science 207: 249-284.
- Zeileis, A.; Hothorn, T. 2002. Diagnostic checking in regression relationships. R News 2: 7-10.
Data availability
The data that support the findings of this study are available in Zenodo and can be accessed at doi: 10.5281/zenodo.18392884.
APPENDIX
Tameirão et al. The role of local hydrology and leaf habit in leaf phenology patterns over 52 years monitoring of canopy trees in central Amazonia

Map showing the distribution of the studied trees (right panels) at two research sites at the central Amazon (left panel). White dots: georeferenced trees from the phenological monitoring.

Pictures A-B showing trees flushing new leaves, with most of the canopy with light green leaves. Small sprouts in (A), larger leaves in (B). Pictures C-D showing trees flushing new leaves, while still having mature and old green leaves at the same time. (C) Reddish new leaves. (D) Light green new leaves. Pictures E-F showing trees with most of the canopy with mature and old fully developed leaves. Picture in (G) shows diverse phenological patterns occurring at the same location, top left a tree with mostly mature/old leaves, in the centre mature/old and new leaves, bottom right a leafless tree. (H) in the centre a tree with few leaves in the canopy. Credits: Lucas Tameirão. Location: Reserva Florestal Ducke.

Scatterplots to check linearity assumption for the Granger-causality test. In blue a linear regression line and in red a non-linear LOESS (Locally Estimated Scatterplot Smoothing) smoother. The Granger causality test assumes a linear relationship between the time series to be tested. Flushing time series of deciduous trees in the Y axis, and of evergreen trees in the X axis.

Time series of monthly proportion of tree individuals in three hydro-edaphic environments in the central Amazon. Raw data was smoothed using moving average at lag -12 for the phenophase in the y axis. All leaf habits are pooled together. Dotted lines indicate years with extreme climatic conditions, dry in red (El Niño 1982, 1992, 1997, 2016/ NAO 2005, 2010), wet in blue (La Niña 1988, 1999). Solid black lines indicate significant regressions (p < 0.05), dashed lines indicate non-significant regressions.

Percentage of time (counted in months) spent by individual trees in different phenophases in two central Amazonia humid forests. Circles represent 547 individual trees monitored monthly for 12 to 52 years (average of 43.5 years of observation). The monitored individuals spent most of the time with ‘Mature/old leaves’ (66%), followed by ‘Flushing new leaves’ (23%). The other phenophases (‘Mature/old and new leaves’ (6.5%); ‘Few leaves’ (2.5%) and ‘No leaves’ (2%)) represented together 11% of the time invested by the trees when observed at the community level.

Average proportion of trees flushing leaves along the year, across contrasting hydro-edaphic environments. Vertical bars represent standard deviation for each month, red shaded area indicates the local drier season.
Results from the Augmented Dickey-Fuller (ADF) test for stationarity of flushing time series for deciduous and evergreen trees. ADF test determines if a series has a trend by testing for a unit root. The null hypothesis of the test is that a unit root is present (the series is non-stationary), a p-value under 0.05 indicates the rejection of the null hypothesis.
Results from the weighted Generalised Least Squares (GLS) model controlling for size difference between HAND groups and temporal autocorrelation. The models were fitted to estimate the effect of climate variables (Local precipitation, cumulative water deficit - CWD, vapor pressure deficit - VPD, sea surface temperature at the Atlantic Meridional Mode - SST AMM, North Atlantic Oscillation - NAO and El Niño Southern Oscillation) in interaction with HAND for each of the five studied phenophases, controlling for temporal autocorrelation (corARMA(Time) term). Dummy variable is the level of HAND group used for statistical comparison. All levels of HAND were tested in turn as dummy variable within the same model for each phenophase, only the significant interactions are shown. SE stands for standard error.